

Regulatory T cells constrain the TCR repertoire of antigen-stimulated conventional CD4 T cells
- PMID: 29263148
- PMCID: PMC5793804
- DOI: 10.15252/embj.201796881
Regulatory T cells constrain the TCR repertoire of antigen-stimulated conventional CD4 T cells
Abstract
To analyze the potential role of Tregs in controlling the TCR repertoire breadth to a non-self-antigen, a TCRβ transgenic mouse model (EF4.1) expressing a limited, yet polyclonal naïve T-cell repertoire was used. The response of EF4.1 mice to an I-Ab-associated epitope of the F-MuLV envelope protein is dominated by clones expressing a Vα2 gene segment, thus allowing a comprehensive analysis of the TCRα repertoire in a relatively large cohort of mice. Control and Treg-depleted EF4.1 mice were immunized, and the extent of the Vα2-bearing, antigen-specific TCR repertoire was characterized by high-throughput sequencing and spectratyping analysis. In addition to increased clonal expansion and acquisition of effector functions, Treg depletion led to the expression of a more diverse TCR repertoire comprising several private clonotypes rarely observed in control mice or in the pre-immune repertoire. Injection of anti-CD86 antibodies in vivo led to a strong reduction in TCR diversity, suggesting that Tregs may influence TCR repertoire diversity by modulating costimulatory molecule availability. Collectively, these studies illustrate an additional mechanism whereby Tregs control the immune response to non-self-antigens.
Keywords: CD4+ T‐cell lymphocytes; TCR repertoire analysis; regulatory T cells.
© 2017 The Authors.
Figures

- A, B
Representative FACS contour plots of cells restimulated in control medium or in the presence of 106 M env122–141 peptide and mean percentage of CD69‐ and CD40L‐expressing cells in gated Vα2+ or Vα2− CD4+ T cells. Symbols represent mean values (± s.e.m., n = 2 mice). Results are from three independent experiments.

Representative FACS contour plots (left panel) and mean percentage of Ki67 expression (right panel) in gated CD4+ Vα2+ or Vα2− T cells 5 days after immunization (+env) or not (NI) (n = 13–15 mice/group, Mann–Whitney test).
Representative FACS contour plots (left panel) and mean percentage of IFN‐γ expression (right panel) of in vivo primed, in vitro‐restimulated (10−6 M env122–141 peptide) Vα2+ or Vα2− CD4+ T cells (n = 14 mice/group, Mann–Whitney test).
Spectratyping plots of Vα2+ CD4+ T cells from C57BL/6 wild‐type, TCRβ‐tg‐naïve, immunized TCRβ‐tg, OTII, and Marilyn mice. Data are representative of four mice.

- A, B
Representative FACS contour plots and mean percentage of FoxP3‐expressing CD4+ T cells (n = 24 mice/group for immunized mice and 4 mice/group for NI mice, Mann–Whitney test).
- C, D
Representative FACS contour plots and mean percentage of Ki67 expression in gated Vα2+ or Vα2− CD4+ T cells (n = 25–27 mice/group for immunized mice and four mice/group for NI mice, Student's t‐test).

Representative FACS contour plots of IFN‐γ‐expressing cells from control or env‐supplemented (10−6 M) cultures.
Mean percentage of IFN‐γ‐expressing cells in gated Vα2+ or Vα2− CD4+ T cells.
Functional avidity, as measured by the percent maximal number of IFN‐γ‐expressing cells in gated Vα2+ CD4+ T cells.
Effective peptide concentration required to induce a half‐maximal response (EC50).

Spectratyping plots of immune CD4+ Vα2+ T cells derived from IgG (upper row) or anti‐CD25‐treated mice (see legend to Fig 3 for detailed protocol).
Index of oligoclonality for CDR3Vα2, determined as described in Materials and Methods section. Histograms represent mean values (± s.e.m., n = 17 mice/group for immunized mice and n = 4–7 mice for naïve wild‐type and TCRβ‐tg mice, Mann–Whitney test) with each symbol referring to an individual mouse. Results are from five independent experiments for immunized mice and from one experiment for naïve wild‐type and TCRβ‐tg mice.

- A, B
Sum of frequencies and relative frequencies of the 10 most dominant TCR Vα2 nucleotide sequences.
- C
Lorenz curves representing the degree of skewness of the Vα2 TCR repertoire of CD4+ T cells from immune and non‐immune cells are displayed by plotting the cumulative frequency of unique sequences vs. the cumulative frequency of total sequences. The line of equality represents an even distribution of clonotypes.
- D
Gini coefficient was calculated for each group.
- E
Shannon diversity index was used to estimate clonal diversity and distribution.

- A
Sum of frequencies of the 10 most dominant TCR Vα2 nucleotide sequences.
- B
Length of TCR CDR3α2 nucleotide sequences (virtual spectratypes).
- C
Relative frequencies of the 10 most dominant TCR Vα2 nucleotide sequences.
- D
Lorenz curves of Vα2 TCR repertoires.
- E, F
Gini‐TCR skewing and Shannon diversity indexes estimated as described in Materials and Methods section.

- A
The sum of frequencies of the 10 most dominant TCR Vα2 nucleotide sequences.
- B
Virtual spectratypes showing the length of TCR CDR3α2 nucleotide sequences.
- C–E
Virtual spectratypes illustrating the relative frequencies of J‐gene usage by the 10 most dominant TCR Vα2 nucleotide sequences from (C) naïve (n = 4 mice), (D) immunized, Treg‐sufficient (n = 27 mice) and (E) immunized, Treg‐depleted TCRβ‐tg mice (n = 27 mice).
- F
The relative frequencies of the 10 most dominant TCR Vα2 nucleotide sequences in both groups of immune animals.
- G
Lorenz curves of Vα2 TCR repertoire in control and Treg‐depleted mice.
- H, I
Gini‐TCR skewing and Shannon diversity indexes.

- A, B
Virtual spectratypes illustrating the relative frequencies of J‐gene usage by the 10 most dominant TCR Vα2 nucleotide sequences from naïve and antigen‐activated FoxP3‐negative (upper panel) and FoxP3‐positive (lower panel) T cells (n = 6 mice for the naïve group and n = 10 mice for the immunized group).
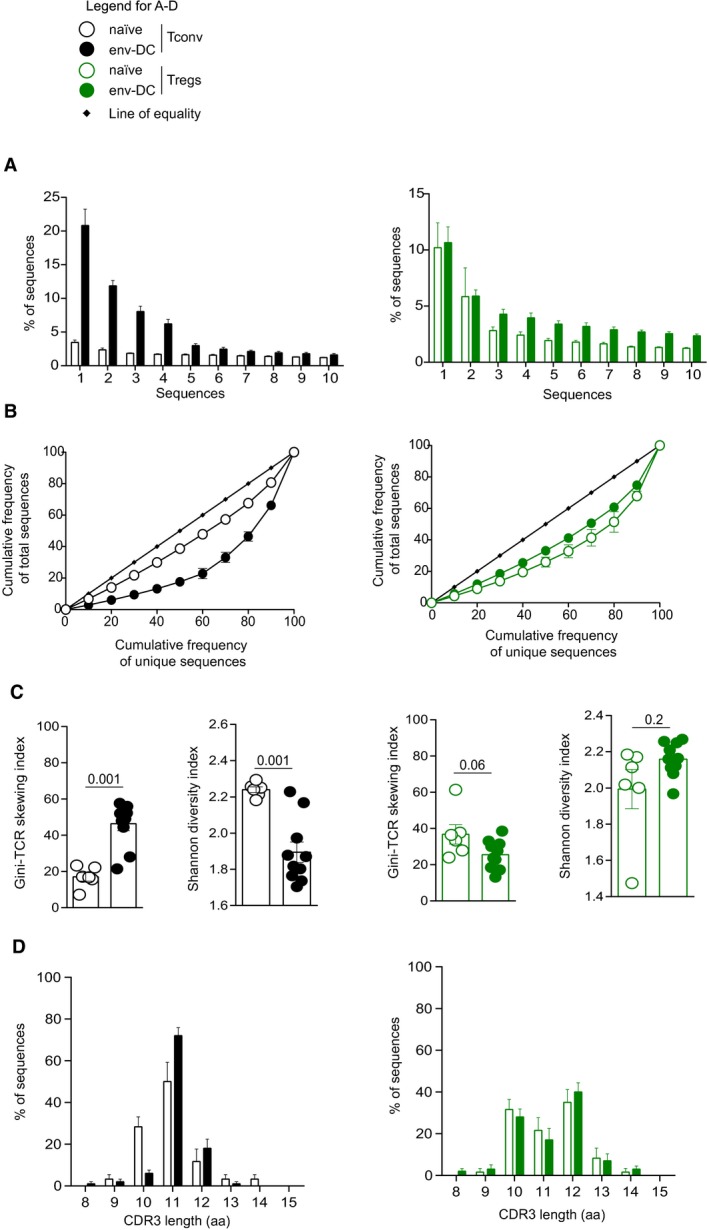
The relative frequencies of the 10 most dominant TCR Vα2 nucleotide sequences.
Lorenz curves of Vα2 TCR repertoire in Tconv and Tregs.
Gini‐TCR skewing and Shannon diversity indexes
Virtual spectratypes showing the length of TCR CDR3α2 nucleotide sequences.

- A
Mean percentage of Ki67‐expressing CD4+ T cells.
- B, C
The sum of frequencies and the relative frequencies of the 10 most dominant TCR Vα2 nucleotide sequences.
- D
Lorenz curves of Vα2 TCR repertoires.
- E, F
Gini‐TCR skewing and Shannon diversity indexes.
- G
Virtual spectratypes illustrating the TCR CDR3α2 length from DT‐treated, immunized TCRβ‐tg (black bars), PBS‐treated, immunized FoxP3DTR TCRβ‐tg (green bars) and DT‐treated, immunized FoxP3DTR TCRβ‐tg mice (magenta bars).
- H–J
Virtual spectratypes of the relative frequencies of J‐gene usage by the 10 most dominant TCR Vα2 nucleotide sequences in (H) DT‐treated, immunized TCRβ‐tg (n = 4), (I) PBS‐treated, immunized FoxP3DTR TCRβ‐tg (n = 4) and (J) DT‐treated, immunized FoxP3DTR TCRβ‐tg mice (n = 7).
- K
Virtual spectratypes illustrating the length of TCR CDR3α2 nucleotide sequences in naïve, PBS vs. DT‐treated FoxP3DTR TCRβ‐tg mice.
- L, M
Virtual spectratypes of the relative frequencies of J‐gene usage by the 10 most dominant TCR Vα2 nucleotide sequences in naïve, (L) PBS (n = 3) vs. (M) DT‐treated (n = 2) FoxP3DTR TCRβ‐tg mice.

- A, B
Representative FACS contour plots and mean percentage of Ki67‐expressing cells in gated Vα2+ or Vα2− CD4+ T cells.
- C, D
The sum of frequencies and the relative frequencies of the 10 most dominant TCR Vα2 nucleotide sequences.
- E
Lorenz curves of Vα2 TCR repertoires in naïve and immunized mice in the presence or absence of anti‐CD86 mAbs.
- F, G
Gini‐TCR skewing and Shannon diversity indexes.
- H–J
Virtual spectratypes illustrating (H) the TCR CDR3α2 length, (I) the relative frequencies of J‐gene usage by the 10 most dominant TCR Vα2 nucleotide sequences in control‐treated, immunized TCRβ‐tg mice (n = 9) and (J) anti‐CD86‐treated, immunized TCRβ‐tg mice (n = 9).
Similar articles
-
Immunodominance in the TCR repertoire of a [corrected] TCR peptide-specific CD4+ Treg population that controls experimental autoimmune encephalomyelitis.J Immunol. 2008 Apr 1;180(7):4577-85. doi: 10.4049/jimmunol.180.7.4577. J Immunol. 2008. PMID: 18354180
-
Anti-GITR Antibody Treatment Increases TCR Repertoire Diversity of Regulatory but not Effector T Cells Engaged in the Immune Response Against B16 Melanoma.Arch Immunol Ther Exp (Warsz). 2017 Dec;65(6):553-564. doi: 10.1007/s00005-017-0479-1. Epub 2017 Jun 21. Arch Immunol Ther Exp (Warsz). 2017. PMID: 28638937 Free PMC article.
-
The Lower Limit of Regulatory CD4+ Foxp3+ TCRβ Repertoire Diversity Required To Control Autoimmunity.J Immunol. 2017 Apr 15;198(8):3127-3135. doi: 10.4049/jimmunol.1601966. Epub 2017 Mar 6. J Immunol. 2017. PMID: 28264971 Free PMC article.
-
Dendritic cells expand antigen-specific Foxp3+ CD25+ CD4+ regulatory T cells including suppressors of alloreactivity.Immunol Rev. 2006 Aug;212:314-29. doi: 10.1111/j.0105-2896.2006.00422.x. Immunol Rev. 2006. PMID: 16903923 Review.
-
Narrowing the Gap: Preserving Repertoire Diversity Despite Clonal Selection during the CD4 T Cell Response.Front Immunol. 2015 Aug 11;6:413. doi: 10.3389/fimmu.2015.00413. eCollection 2015. Front Immunol. 2015. PMID: 26322045 Free PMC article. Review.
Cited by
-
Activated B-Cells enhance epitope spreading to support successful cancer immunotherapy.Front Immunol. 2024 Mar 19;15:1382236. doi: 10.3389/fimmu.2024.1382236. eCollection 2024. Front Immunol. 2024. PMID: 38571942 Free PMC article. Review.
-
Possible involvement of regulatory T cell abnormalities and variational usage of TCR repertoire in children with autoimmune neutropenia.Clin Exp Immunol. 2021 Apr;204(1):1-13. doi: 10.1111/cei.13559. Epub 2020 Dec 27. Clin Exp Immunol. 2021. PMID: 33289074 Free PMC article.
-
Friend retrovirus studies reveal complex interactions between intrinsic, innate and adaptive immunity.FEMS Microbiol Rev. 2019 Sep 1;43(5):435-456. doi: 10.1093/femsre/fuz012. FEMS Microbiol Rev. 2019. PMID: 31087035 Free PMC article. Review.
-
Dormant pathogenic CD4+ T cells are prevalent in the peripheral repertoire of healthy mice.Nat Commun. 2019 Oct 25;10(1):4882. doi: 10.1038/s41467-019-12820-3. Nat Commun. 2019. PMID: 31653839 Free PMC article.
-
Characterization of the UK anthrax vaccine and human immunogenicity.Hum Vaccin Immunother. 2021 Mar 4;17(3):747-758. doi: 10.1080/21645515.2020.1799668. Epub 2020 Sep 8. Hum Vaccin Immunother. 2021. PMID: 32897798 Free PMC article.
References
-
- Afgan E, Baker D, van den Beek M, Blankenberg D, Bouvier D, Čech M, Chilton J, Clements D, Coraor N, Eberhard C, Grüning B, Guerler A, Hillman‐Jackson J, Von Kuster G, Rasche E, Soranzo N, Turaga N, Taylor J, Nekrutenko A, Goecks J (2016) The Galaxy platform for accessible, reproducible and collaborative biomedical analyses: 2016 update. Nucleic Acids Res 44: gkw343 - PMC - PubMed
-
- Alamyar E, Giudicelli V, Li S, Duroux P, Lefranc MP (2012) IMGT/Highv‐quest: the IMGT web portal for immunoglobulin (IG) or antibody and T cell receptor (TR) analysis from NGS high throughput and deep sequencing. Immunome Res 8: 1–15
-
- Arstila TP, Casrouge A, Baron V, Even J, Kourilsky P (1999) A direct estimate of the human αβ T cell receptor diversity. Science 286: 958–961 - PubMed
-
- Bianconi E, Piovesan A, Facchin F, Beraudi A, Casadei R, Frabetti F, Vitale L, Pelleri MC, Tassani S, Piva F, Perez‐Amodio S, Strippoli P, Canaider S (2013) An estimation of the number of cells in the human body. Ann Hum Biol 40: 463–471 - PubMed
Publication types
MeSH terms
Substances
LinkOut - more resources
Full Text Sources
Other Literature Sources
Molecular Biology Databases
Research Materials
