. 2018 Jan 1;78(1):205-215.
doi: 10.1158/0008-5472.CAN-17-1636. Epub 2017 Dec 20.

MUC1-C Induces PD-L1 and Immune Evasion in Triple-Negative Breast Cancer

Affiliations

MUC1-C Induces PD-L1 and Immune Evasion in Triple-Negative Breast Cancer

Takahiro Maeda et al. Cancer Res. .

Abstract

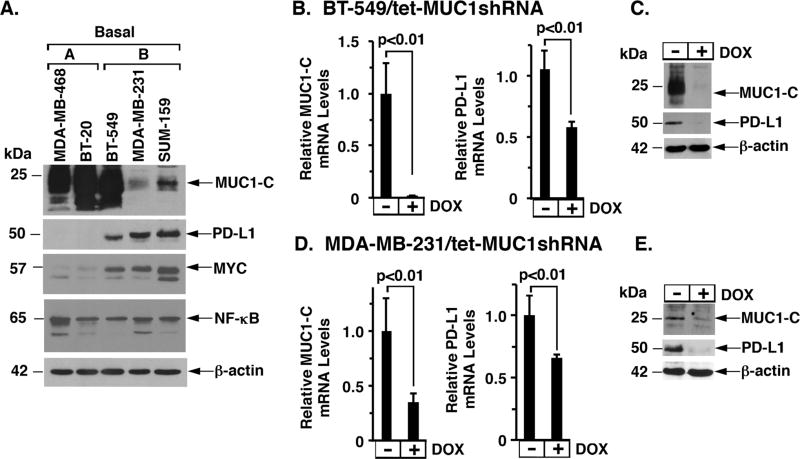
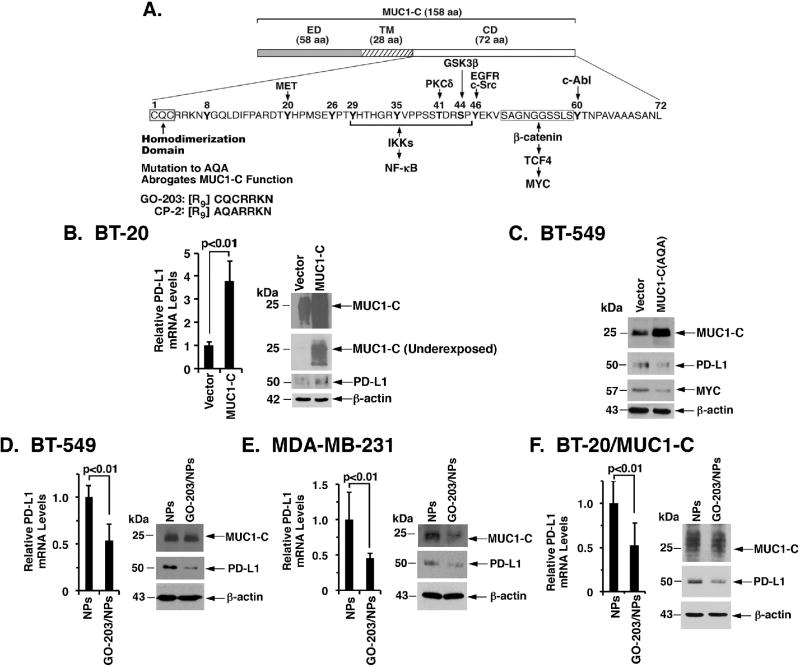
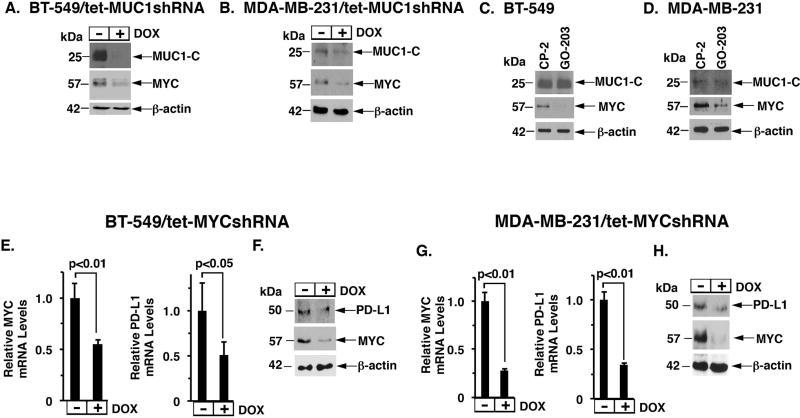
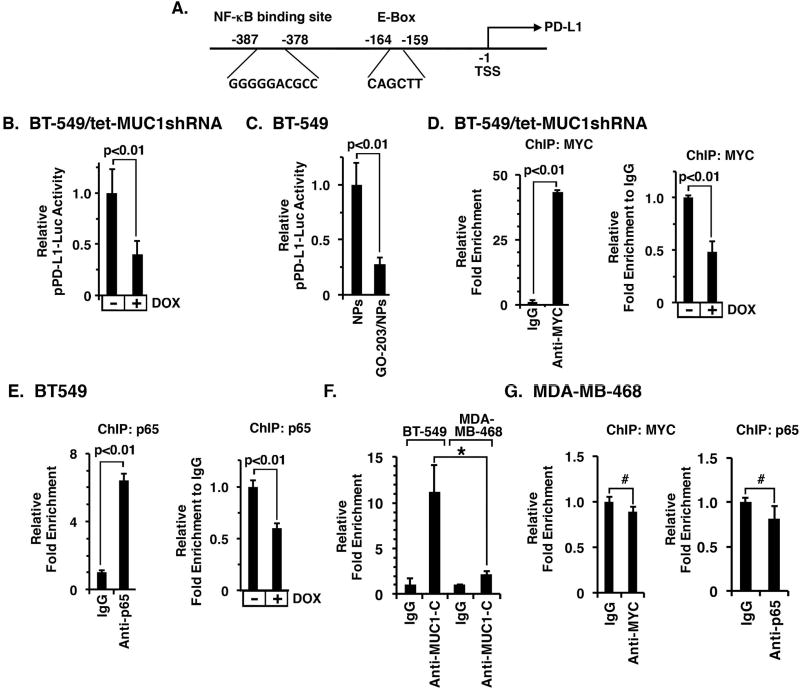
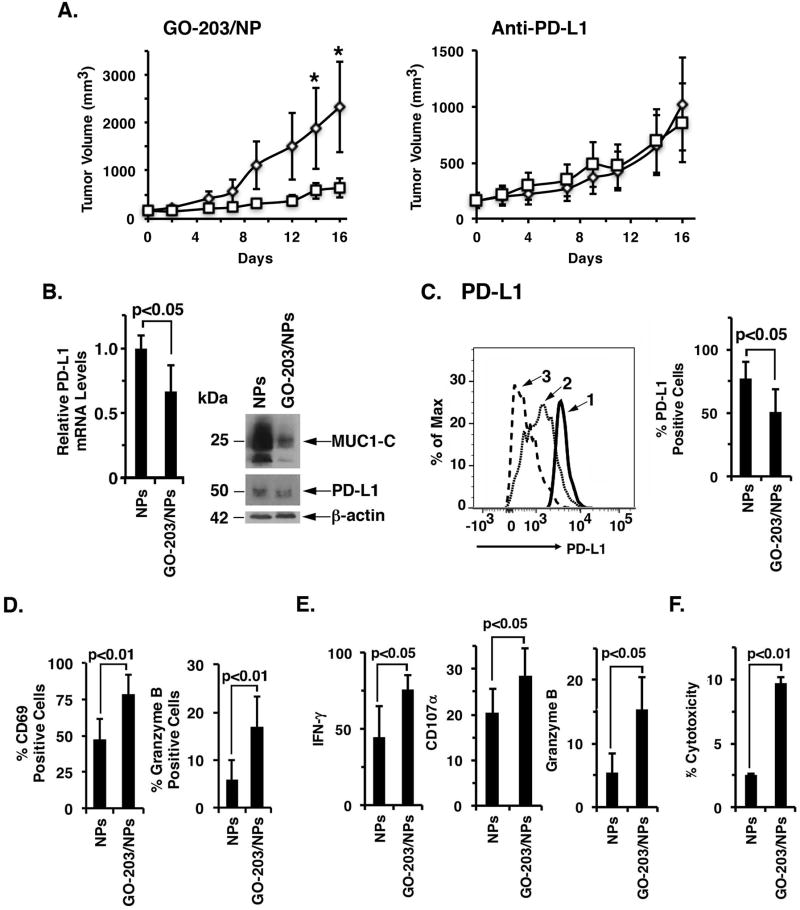
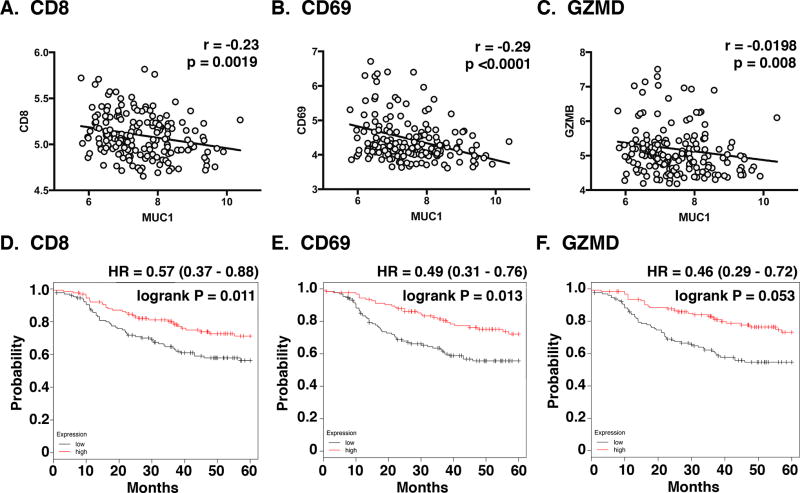
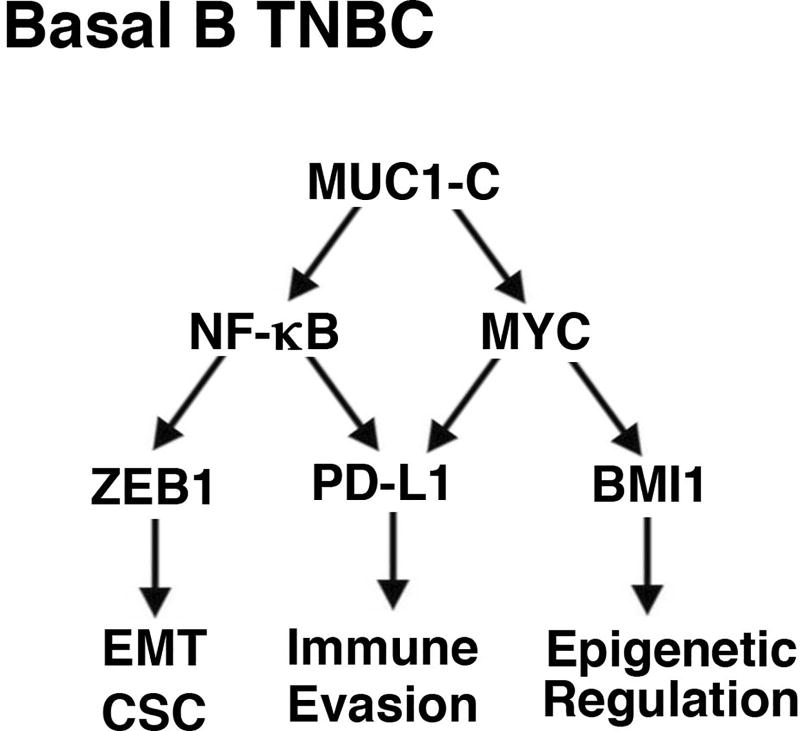
The immune checkpoint ligand PD-L1 and the transmembrane mucin MUC1 are upregulated in triple-negative breast cancer (TNBC), where they contribute to its aggressive pathogenesis. Here, we report that genetic or pharmacological targeting of the oncogenic MUC1 subunit MUC1-C is sufficient to suppress PD-L1 expression in TNBC cells. Mechanistic investigations showed that MUC1-C acted to elevate PD-L1 transcription by recruitment of MYC and NF-κB p65 to the PD-L1 promoter. In an immunocompetent model of TNBC in which Eo771/MUC1-C cells were engrafted into MUC1 transgenic mice, we showed that targeting MUC1-C associated with PD-L1 suppression, increases in tumor-infiltrating CD8+ T cells and tumor cell killing. MUC1 expression in TNBCs also correlated inversely with CD8, CD69, and GZMB, and downregulation of these markers associated with decreased survival. Taken together, our findings show how MUC1 contributes to immune escape in TNBC, and they offer a rationale to target MUC1-C as a novel immunotherapeutic approach for TNBC treatment.Significance: These findings show how upregulation of the transmembrane mucin MUC1 contributes to immune escape in an aggressive form of breast cancer, with potential implications for a novel immunotherapeutic approach. Cancer Res; 78(1); 205-15. ©2017 AACR.


Conflict of interest statement

Potential Conflict of Interest: The authors declare competing financial interests, D.K. holds equity in Genus Oncology and is a consultant to the company. The other authors disclosed no potential conflicts of interest.

Figures

Figure 1
Figure 1. MUC1-C induces PD-L1 expression
A. Lysates from the designated basal A and basal B TNBC cells were immunoblotted with the indicated antibodies. B–C. BT-549 cells were transduced to stably express a tetracycline-inducible MUC1 shRNA (tet-MUC1shRNA). Cells treated with or without 500 ng/ml DOX for 4 d were analyzed for MUC1 (left) and PD-L1 mRNA levels (right) by qRT-PCR. The results (mean±SD of 3 determinations) are expressed as relative mRNA levels compared with that obtained for control DOX-untreated cells (assigned a value of 1) (B). Lysates from cells treated with or without 500 ng/ml DOX for 7 d were immunoblotted with the indicated antibodies (C). D–E. MDA-MB-231/tet-MUC1shRNA cells treated with or without 200 ng/ml DOX for 4 d were analyzed for MUC1 (left) and PD-L1 mRNA levels (right) by qRT-PCR (mean±SD of 3 determinations) (D). Lysates from cells treated with or without 200 ng/ml DOX for 7 d were immunoblotted with the antibodies (E).
Figure 2
Figure 2. Targeting MUC1-C suppresses PD-L1 expression
A. Schema of MUC1-C with the 58 amino acid (aa) extracellular domain (ED), the 28 aa transmembrane domain (TM), and the 72 aa cytoplasmic domain (CD). The CQC motif of the CD domain is indispensable for MUC1-C homodimerization, and is targeted by the cell-penetrating GO-203 peptide. Highlighted are interactions of the MUC1-C cytoplasmic domain with the NF-κB p65 and MYC pathways. B. BT-20 cells stably transduced to express a control or MUC1-C vector were analyzed for PD-L1 mRNA levels by qRT-PCR. The results (mean±SD of 3 determinations) are expressed as relative PD-L1 mRNA levels compared to that obtained for vector cells (assigned a value of 1) (left). Lysates were immunoblotted with the indicated antibodies (right). C. BT-549 cells were transfected to stably express an empty vector or MUC1-C(AQA) mutant. Lysates were immunoblotted with the indicated antibodies. D–F. BT-549 (D), MDA-MB-231 (E), and BT-20/MUC1-C (F) cells treated with empty NPs or 2.5 µM GO-203/NPs for 5 d were analyzed for PD-L1 mRNA levels by qRT-PCR. The results (mean±SD of 3 determinations) are expressed as relative PD-L1 mRNA levels compared to that obtained for empty NPs (assigned a value of 1)(left). Lysates from cells treated with empty NPs or 2.5 µM GO-203/NPs for 7 d were immunoblotted with the indicated antibodies (right).
Figure 3
Figure 3. MUC1-C→MYC signaling induces PD-L1 expression
A-B. Lysates from BT-549/tet-MUCshRNA (A) and MDA-MB-231/tet-MUCshRNA (B) cells treated with or without DOX for 7 d were immunoblotted with the indicated antibodies. C–D. Lysates from BT-549 (C) and MDA-MB-231 (D) cells treated with 5 µM CP-2 or 5 µM GO-203 for 3 d were immunoblotted with the indicated antibodies. E–F. BT-549/tet-MYCshRNA cells treated with or without 200 ng/ml DOX for 1 d were analyzed for MYC and PD-L1 levels by qRT-PCR. The results (mean±SD of 3 determinations) are expressed as relative mRNA levels compared with that obtained for control DOX-untreated cells (assigned a value of 1)(E). Lysates from cells treated with or without 200 ng/ml DOX for 3 d were immunoblotted with the indicated antibodies (F). G–H. MDA-MB-231/tet-MYCshRNA cells treated with or without 200 ng/ml DOX for 1 d were analyzed for MYC and PD-L1 levels by qRT-PCR (mean±SD of 3 determinations) (G). Lysates from cells treated with or without 200 ng/ml DOX for 3 d were immunoblotted with the indicated antibodies (H).
Figure 4
Figure 4. MUC1-C enhances MYC and NF-κB p65 occupancy on the PD-L1 promoter
A. Schema of the pPD-L1 promoter with highlighting of the E-box at −159 to −164 and NF-κB binding site at −378 to −387 upstream to the transcription start site (TSS). B. BT-549/tet-MUC1shRNA cells cultured with or without DOX for 5 d were transfected with the pPD-L1-Luc reporter for 48 h and then assayed for luciferase activity. The results (mean±SD of 3 determinations) are expressed as the relative luciferase activity compared to that obtained for control DOX-untreated cells (assigned a value of 1). C. BT-549 cells treated with NPs or GO-203/NPs for 4 d were transfected with pPD-L1-Luc reporter for 48 h and then assayed for luciferase activity. The results (mean±SD of 3 determinations) are expressed as the relative luciferase activity compared to that obtained with empty NP-treated cells (assigned a value of 1). D. Soluble chromatin from BT-549/tet-MUC1shRNA cells was precipitated with anti-MYC or a control IgG (left). The final DNA samples were amplified by qPCR with primers for the PD-L1 promoter MYC binding region or GAPDH as a control. The results (mean±SD of three determinations) are expressed as the relative fold enrichment compared to that obtained with the IgG control (assigned a value of 1). Soluble chromatin from 549/tet-MUC1shRNA cells cultured with or without DOX for 5 d was precipitated with anti-MYC or a control IgG. The final DNA samples were amplified by qPCR. The results (mean±SEM of three determinations) are expressed as the relative fold enrichment compared to that obtained for control DOX-untreated cells (assigned a value of 1) (right). E. Soluble chromatin from BT-549/tet-MUC1shRNA cells was precipitated with anti-NF-κB p65 or a control IgG (left). The final DNA samples were amplified by qPCR with primers for the PD-L1 promoter NF-κB binding region or GAPDH as a control. The results (mean±SD of three determinations) are expressed as the relative fold enrichment compared to that obtained with the IgG control (assigned a value of 1). Soluble chromatin from BT-549/tet-MUC1shRNA cells cultured with or without DOX for 5 d was precipitated with anti-NF-κB p65 or a control IgG (right). The final DNA samples were amplified by qPCR. The results (mean±SEM of three determinations) are expressed as the relative fold enrichment compared to that obtained for control DOX-untreated cell chromatin (assigned a value of 1). F. Soluble chromatin from BT-549 and MDA-MB-468 cells was precipitated with anti-MUC1-C or a control IgG. The final DNA samples were amplified by qPCR with primers for the PD-L1 promoter or GAPDH as a control. The results (mean±SD of three determinations) are expressed as the relative fold enrichment compared to that obtained with the IgG controls (assigned a value of 1). *p<0.05. G. Soluble chromatin from MDA-MB-468 cells was precipitated with anti-MYC (left), anti-NF-κB p65 (right) or a control IgG (left). The final DNA samples were amplified by qPCR with primers for the PD-L1 promoter or GAPDH as a control. The results (mean±SD of three determinations) are expressed as the relative fold enrichment compared to that obtained with the IgG controls (assigned a value of 1). #p>0.05.
Figure 5
Figure 5. Targeting MUC1-C in Eo771/MUC1-C tumors activates the immune microenvironment
A. Eo771/MUC1-C cells were injected subcutaneously into the flanks of MUC1.Tg mice. Left panel. Mice with established tumors of approximately 150 mm3 were pair-matched and then treated with empty NPs (diamonds) or 15 mg/kg GO-203/NPs (squares)(left). The results are expressed as tumor volume (mean±SEM; 5 mice per group). One of the tumors in the GO-203/NP-treated group was undetectable at the time of harvest. *p<0.05. Tumors were harvested on day 16 when the controls showed signs of necrosis. Right panel. In a subsequent experiment, mice were treated with PBS or 10 mg/kg anti-PD-L1 on days 1 and 6. Tumors in the control group showed signs of necrosis on day 17 when the study was terminated according to the animal protocol. B. Tumor cells were analyzed for PD-L1 mRNA levels by qRT-PCR. The results (mean±SD of 4 determinations) are expressed as relative mRNA levels compared with that obtained for empty NP-treated tumors (assigned a value of 1)(left). Lysates were immunoblotted with the indicated antibodies (right). C–E. Single cell suspensions were prepared for FACS analysis. C. In a representative histogram, tumor cells from NP-treated (profile #1) and GO-203/NP-treated (profile #2) mice were analyzed for PD-L1 expression (left). An isotype identical antibody was used as a control (profile #3)(left). The percentage of PD-L1-positive tumor cells is expressed as the mean±SD (4 tumors per group)(right). D. Tumor-infiltrating CD8+ T-cells were analyzed for CD69 and granzyme B expression. The results are expressed as the percentage (mean±SD; n=4) of CD69 (left) and granzyme B (right) positive cells. E. Tumor-infiltrating immune cells were isolated by Ficoll separation and stimulated with the Leucocyte Activation Cocktail. CD8+ T-cells were analyzed for expression of the CD107α degranulation marker (left), IFN-γ (middle) and granzyme B (right). The results are expressed as the percentage (mean±SD; n=4) of positive cells. F. Lymph nodes obtained from NP- and GO-203/NP-treated mice were disrupted into cell single suspensions. Effectors were plated in 96-well plates with Eo771/MUC1-C target cells at a 3:1 ratio. After 6 h, T-cell mediated cytotoxicity was assayed measuring LDH release. The results are expressed as percentage cytotoxicity (mean±SD; n=4).
Figure 6
Figure 6. Correlation between MUC1 and T-cell activation in TNBCs
A–C. Gene expression data of TNBCs was obtained from GSE25066 datasets. Correlation between MUC1 and CD8A/B (A), CD69 (B) and GZMB (C) expression (C) was assessed using the Spearman’s correlation coefficient, where p<0.05 was considered as statistically significant. D–F. Kaplan-Meier plots comparing the Relapse-Free Survival (RFS) of TNBC patients. Patients were stratified with high (red) or low (black) expression of CD8 (D), CD69 (E) and GZMB (F) against the median. The survival curves were compared using the log-rank test. HR, hazard ratio.
Figure 7
Figure 7. Proposed model for MUC1-C-induced integration of PD-L1 expression with EMT, CSC state and epigenetic programming in basal B TNBC cells
The present results demonstrate that MUC1-C activates the PD-L1 gene by NF-κB p65- and MYC-mediated mechanisms. MUC1-C→NF-κB p65 signaling also activates the ZEB1 gene and thereby represses miR-200c with induction of the EMT program and CSC state (26,31). Additionally, the MUC1-C→NF-κB p65 pathway promotes epigenetic reprogramming by induction of genes encoding DNMT1/3b and components of the PRC2 complex, including EZH2 (18,21). Moreover, MUC1-C-induced activation of the MYC pathway induces BMI1 expression and PRC1-mediated epigenetic alterations (20). In this way, MUC1-C integrates PD-L1 expression with the EMT program, CSC state and epigenetic reprogramming in basal B TNBC cells.

References

    1. Bianchini G, Balko JM, Mayer IA, Sanders ME, Gianni L. Triple-negative breast cancer: challenges and opportunities of a heterogeneous disease. Nat Rev Clin Oncol. 2016;13:674–90. - PMC - PubMed
    1. Garcia-Teijido P, Cabal ML, Fernandez IP, Perez YF. Tumor-infiltrating lymphocytes in triple negative breast cancer: The future of immune targeting. Clin Med Insights Oncol. 2016;10:31–9. - PMC - PubMed
    1. Groschel S, Bommer M, Hutter B, Budczies J, Bonekamp D, Heining C, et al. Integration of genomics and histology revises diagnosis and enables effective therapy of refractory cancer of unknown primary with PDL1 amplification. Cold Spring Harb Mol Case Stud. 2016;2:a001180. - PMC - PubMed
    1. Soliman H, Khalil F, Antonia S. PD-L1 expression is increased in a subset of basal type breast cancer cells. PLoS One. 2014;9:e88557. - PMC - PubMed
    1. Beckers RK, Selinger CI, Vilain R, Madore J, Wilmott JS, Harvey K, et al. Programmed death ligand 1 expression in triple-negative breast cancer is associated with tumour-infiltrating lymphocytes and improved outcome. Histopathology. 2016;69:25–34. - PubMed

Publication types

MeSH terms