. 2018 Jan 2;215(1):319-336.
doi: 10.1084/jem.20161881. Epub 2017 Dec 20.

RAF/MEK/extracellular signal-related kinase pathway suppresses dendritic cell migration and traps dendritic cells in Langerhans cell histiocytosis lesions

Affiliations

RAF/MEK/extracellular signal-related kinase pathway suppresses dendritic cell migration and traps dendritic cells in Langerhans cell histiocytosis lesions

Brandon Hogstad et al. J Exp Med. .

Abstract

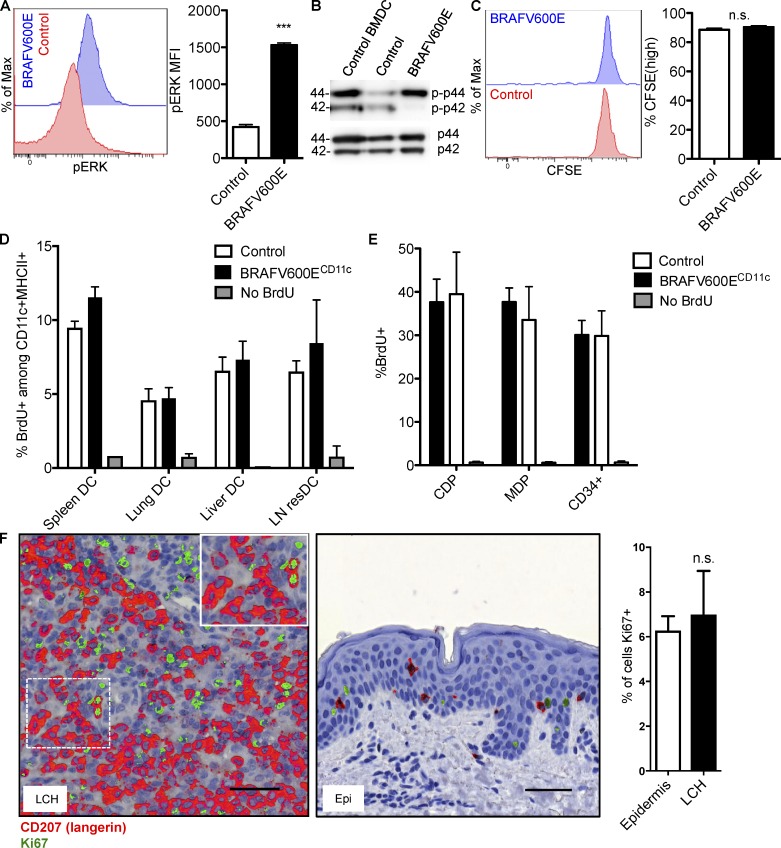
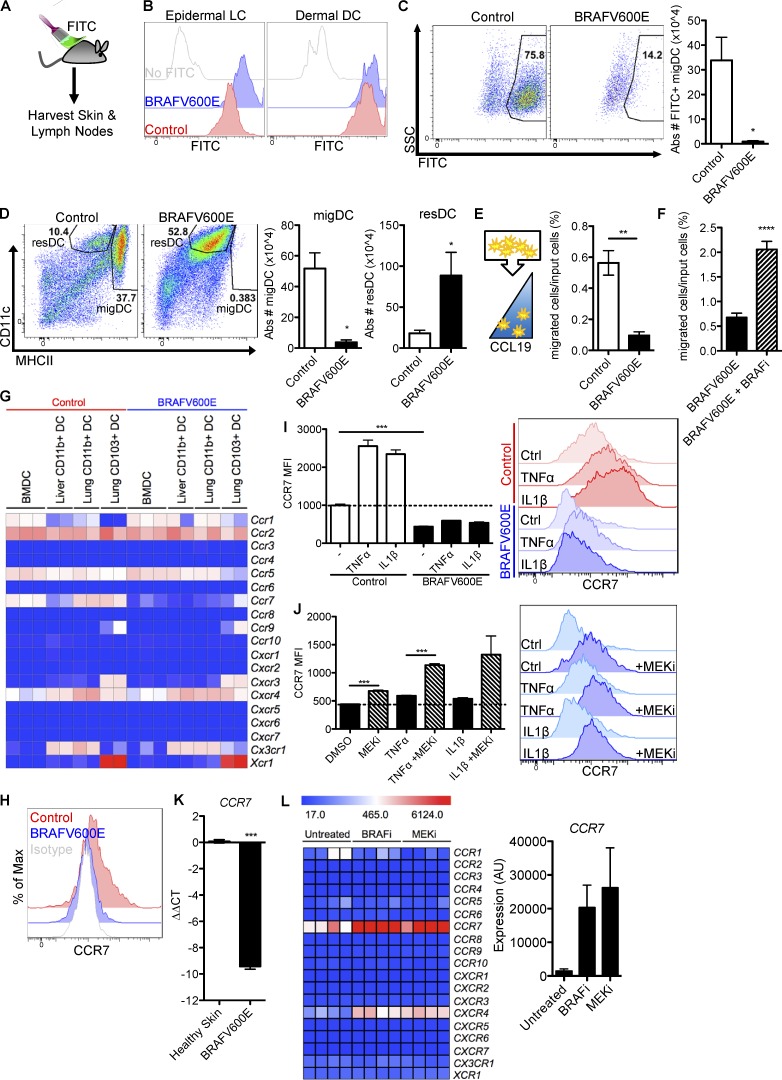
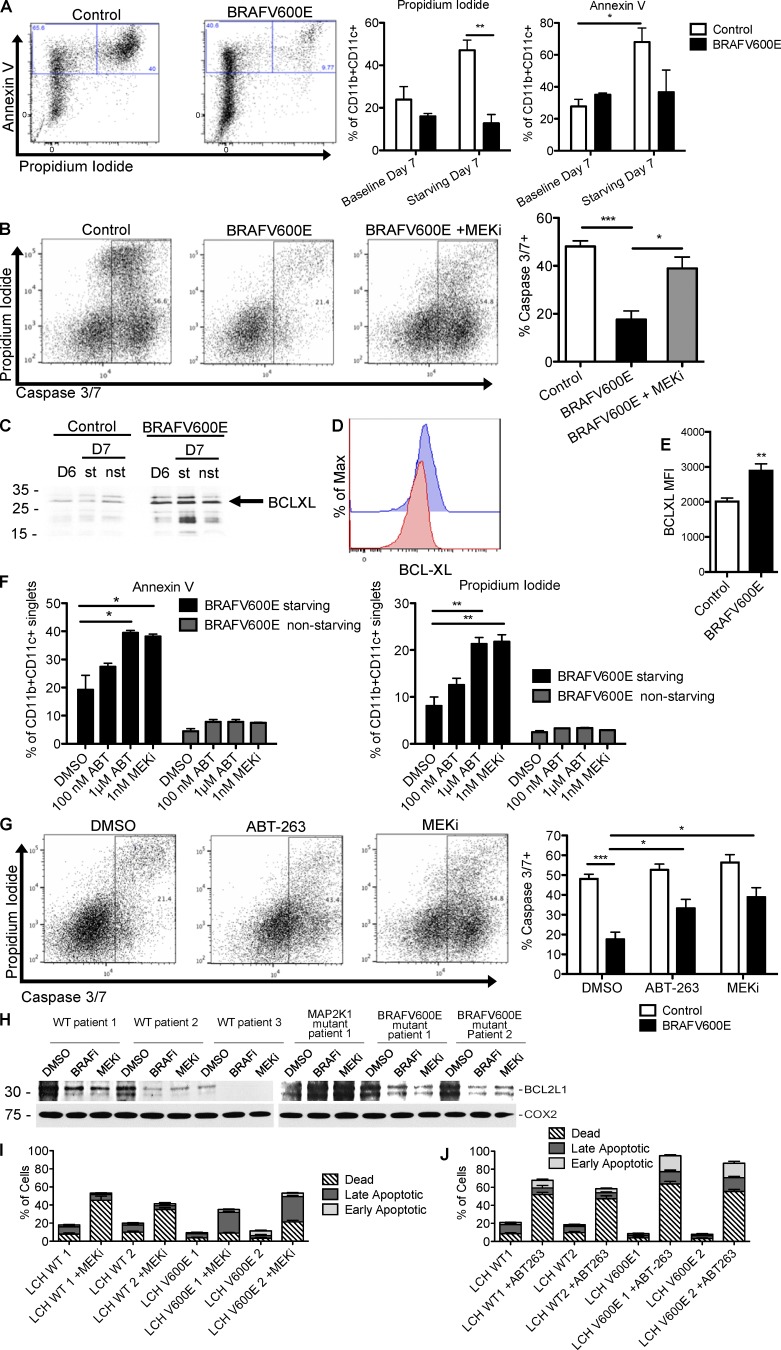
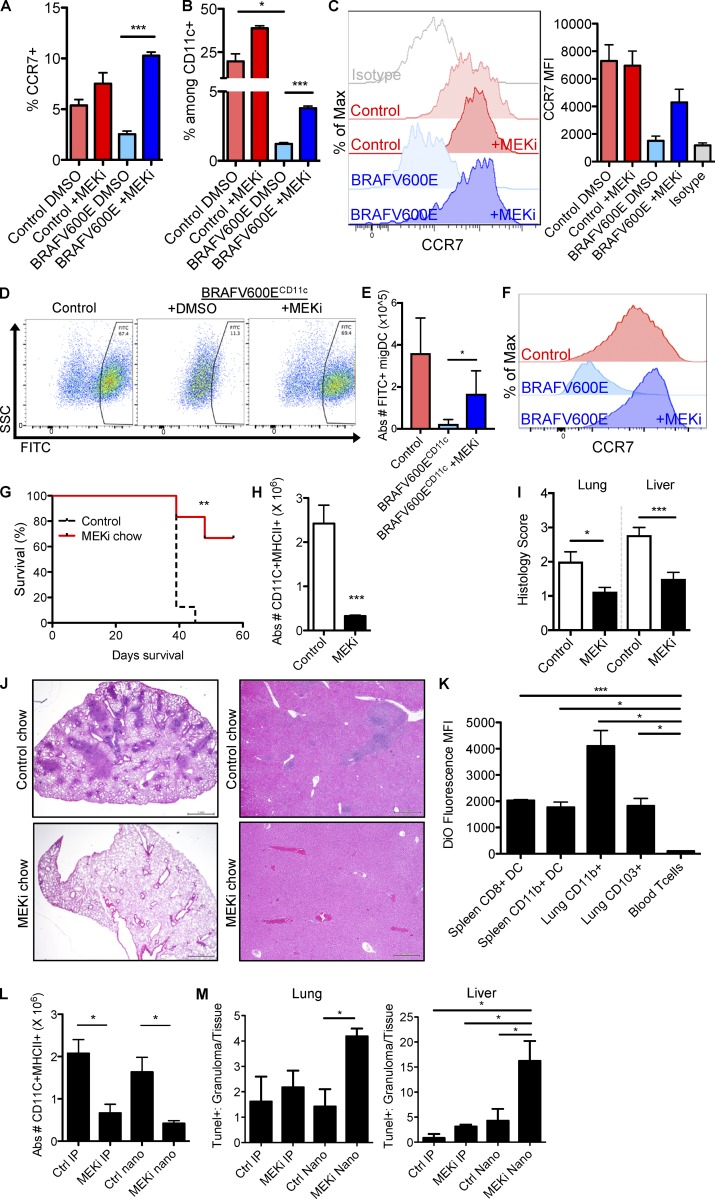
Langerhans cell histiocytosis (LCH) is an inflammatory myeloid neoplasia characterized by granulomatous lesions containing pathological CD207+ dendritic cells (DCs) with constitutively activated mitogen-activated protein kinase (MAPK) pathway signaling. Approximately 60% of LCH patients harbor somatic BRAFV600E mutations localizing to CD207+ DCs within lesions. However, the mechanisms driving BRAFV600E+ LCH cell accumulation in lesions remain unknown. Here we show that sustained extracellular signal-related kinase activity induced by BRAFV600E inhibits C-C motif chemokine receptor 7 (CCR7)-mediated DC migration, trapping DCs in tissue lesions. Additionally, BRAFV600E increases expression of BCL2-like protein 1 (BCL2L1) in DCs, resulting in resistance to apoptosis. Pharmacological MAPK inhibition restores migration and apoptosis potential in a mouse LCH model, as well as in primary human LCH cells. We also demonstrate that MEK inhibitor-loaded nanoparticles have the capacity to concentrate drug delivery to phagocytic cells, significantly reducing off-target toxicity. Collectively, our results indicate that MAPK tightly suppresses DC migration and augments DC survival, rendering DCs in LCH lesions trapped and resistant to cell death.


Figures

Figure 1.
Figure 1.
BRAFV600E DCs proliferate at normal DC rates. (A) ERK phosphorylation levels in control and BRAFV600E BMDCs as analyzed by flow cytometry. Histograms show representative ERK MFI expression in control and BRAFV600E BMDC. Bar graph quantification of phospho-ERK MFI expression in control and BRAFV600E BMDCs. Data shown are representative of 5 experiments. Bar graph represents mean of three technical replicates from one experiment ± SEM (***, P < 0.0001; unpaired t test). (B) CD11c+ cells were isolated from the spleen of BRAFV600ECD11c mice and control mice, and whole cell lysates were analyzed for the expression of phospho-ERK (p-p42/44) by Western blot analysis. Representative data of at least three experiments are shown. Molecular mass is indicated in kilodaltons. (C–E) Measuring in vivo proliferation of BRAFV600ECD11c DCs. (C) CFSE dye–labeled BMDCs were transferred intranasally into congenic CD45.1+ C57B6 recipient mice. Proliferation of engrafted BMDCs was analyzed 6 d after transfer. Histograms shown are representative of two experiments. Bar graph represents pooled data from two experiments (n = 3–6 mice per group) ± SEM (P = 0.2769, unpaired t test). (D and E) In vivo BrdU labeling of (D) CD11c+MHCII+ DCs and (E) BM progenitors from control versus BRAFV600ECD11c mice analyzed 5 h after i.p. injection of 1 mg BrdU. Data shown are the mean ± SEM from four experiments (n = 10–12 for spleen, lung and BM; n = 3 for liver, n = 3 for skin dLN). Two-way ANOVA reveals no significant effect of BRAFV600E on overall DC BrdU incorporation (P = 0.1729, ANOVA). (F) Frequency of Ki-67+ cells in LCH lesion from paraffin-embedded tissue sections. LCH lesions and healthy epidermis (Epi) sections were stained serially for CD207 and Ki-67. LCH lesions and Epi were scored for frequency of Ki-67+ nuclei among CD207+ cells ± SEM. Representative images highlight CD207 (red) overlaid with Ki-67 (green) to show staining localization. Scoring is mean of (total Ki-67+CD207+ cells)/(total CD207+ cells) in LCH lesions and Epi obtained from three LCH patients and four healthy donors (P = 0.7068, unpaired t test). Bars, 50 µm.
Figure 2.
Figure 2.
BRAFV600E abrogates CCR7 function and DC migration and trap DCs in tissues. (A–D) Tracing DC migration to the tissue dLN in BRAFV600ECD11c mice. (A) Cartoon depicts the experimental procedure to trace migDCs. The skin of BRAFV600ECD11c or control mice was painted with FITC to promote the migration of skin FITC+ DCs to the skin dLN. (B) Histograms show FITC uptake by skin DCs including epidermal LC and dermal DCs. (C) Flow cytometry pseudo-color dot plots show the representative frequency and bar graphs show absolute numbers of FITC+CD3B220CD11c+MHCIIhigh migDCs that have migrated to the skin dLN in control and BRAFV600ECD11c mice (*, P = 0.0104; unpaired t test). (D) Flow cytometry plots and bar graphs show the quantification of CD11cintMHCIIhigh migDCs (*, P = 0.0104; unpaired t test) and CD11chighMHCIIint lymphoid-resident DCs (P = 0.0328, unpaired t test) in the skin dLN of BRAFV600ECD11c or control mice. Data shown are representative of at least two experiments ± SEM (n = 3–4 per group). (E) Transwell migration assay in which control and BRAFV600E BMDCs were exposed to CCL19 chemokine gradient. Representative data of at least three experiments with three biological replicates are shown ± SEM (**, P = 0.0014; unpaired t test). (F) BRAFV600ECD11c BMDCs were subjected to transwell migration assay as in E ± BRAF inhibitor (****, P < 0.00001; unpaired t test). (G) Heat map summarizes the chemokine receptor expression profile measured by genechip arrays on ex-vivo FACS-sorted DC subsets (CD103+ lung DC, CD11b+ lung DC, and CD11b+ liver DC) and BMDCs from control versus BRAFV600ECD11c mice. (H) CCR7 surface protein levels measured by flow cytometry staining of control (red) and BRAFV600E (blue) BMDCs. Isotype staining control is depicted in gray. Representative of at least five experiments with three technical replicates each. (I and J) CCR7 protein expression levels measured by flow cytometry in control and BRAFV600E BMDCs (***, P < 0.0001; unpaired t test) stimulated overnight with 100 ng/ml TNFα or 100 ng/ml IL-1β. Data representative of at least twp independent experiments with triplicate technical replicates are shown ± SEM. (J) BRAFV600E BMDC unstimulated (***, P < 0.0003; unpaired t test), stimulated with TNFα (***, P < 0.0001; unpaired t test), or stimulated with IL-1β (P = 0.0778, unpaired t test) as in I overnight ± 100 nM GSK1120212 MEKi. (K) Quantitative real-time PCR analysis of CCR7 mRNA expression in BRAF-WT and BRAFV600E lesion relative to healthy skin. CCR7 expression was normalized to CD207 expression in each lesion to normalize for DC numbers. Units are expressed in log2 format to express fold-change relative to healthy skin. Data represent 3 tissue samples per group. (***, P < 0.0001; unpaired t test). (L) Chemokine receptor expression profile analyzed by Affymetrix genechip of purified CD207+ cells isolated from four BRAFV600E+ human LCH lesions untreated or treated with Vemurafenib BRAF inhibitor or Trametinib MEKi for 12 h. Error bars indicate SEM.
Figure 3.
Figure 3.
BCL-XL up-regulation via RAF/MEK/ERK signaling contributes to suppressed apoptosis in DCs. (A) Apoptosis measured in control and BRAFV600E BMDC by Annexin V/propidium iodide (PI) staining. On day 6 of culture, GM-CSF cytokine was removed from BMDC culture, and BMDC viability was measured on day 7 by flow cytometry. Dot plots show representative frequency of apoptotic Annexin+PI+ CD11c+CD11b+ BMDC from two experiments. Bar graph show the mean of triplicate samples representative of two experiments ± SEM (n = 3–5; control vs. BRAFV600E starved PI positivity: **, P = 0.0055; unpaired t test; baseline vs. starved control Annexin V positivity: *, P = 0.0419; unpaired t test). (B) Caspase 3/7 activation measured in control and BRAFV600E BMDCs starved of GM-CSF growth factor overnight (***, P = 0.0008; unpaired t test), ±1 nM GSK1120212 (*, P = 0.0161; unpaired t test). Representative samples shown in FACS plots. Bar graphs show the mean of three biological replicates representative of two experiments ± SEM. (C) Bclxl expression was measured by Western blot in BRAFV600ECD11c BMDC starved (st) or not starved (nst) of GM-CSF growth factor in overnight culture and harvested on day 6 (D6) or day 7 (D7) of culture. Representative data of two independent experiments are shown. (D and E) BCL-XL protein levels in control and BRAFV600E BMDCs as measured by flow cytometry. Representative data from at least two experiments with three biological replicates are shown. Bar graph in E represents quantification of triplicate conditions within one experiment ± SEM (**, P = 0.0089; unpaired t test). (F) Percentage of apoptotic BMDCs among control or BRAFV600E BMDC cultured overnight with 100 nM BCL2-family inhibitor ABT-263, 1 µM ABT-263 (Annexin V: *, P = 0.0211; unpaired t test; PI: **, P = 0.0032’ unpaired t test) or 1 nM GSK1120212 MEKi (Annexin V: *, P = 0.0268; unpaired t test; PI: **, P = 0.0030; unpaired t test). BMDCs were starved or nonstarved of GM-CSF growth factor during overnight drug treatment and analyzed for apoptosis using Annexin V/PI staining by flow cytometry. Bar graphs show mean of three biological replicates ± SEM, representative of two independent experiments. (G) Caspase 3/7 activation measuring BRAFV600E BMDC treated with control vehicle (***, P = 0.0004; unpaired t test) or with 1 nM GSK1120212 (*, P = 0.0118; unpaired t test), as shown in B, or in the presence of 1 µM ABT-263 (*, P = 0.0330; unpaired t test) overnight. Bar graphs show the mean results of triplicate conditions from two independent experiments ± SEM. (H) Western blot showing BCL2L1 protein levels in human LCH lesions cultured without serum overnight, then treated with BRAF or MEKi’s for 2 h. (C and H) Molecular mass is indicated in kilodaltons. (I and J) Viability of human LCH lesions cultured overnight without serum, then treated for 2 h with 1 nM GSK1120212 MEKi (I), or 1 µM ABT-263 BCL2-family inhibitor (J). Three patient samples in each treatment group. Data represent means shown ± SEM.
Figure 4.
Figure 4.
MEK inhibition rescues DC migration and pathological DC accumulation. (A–C) BRAFV600ECD11c and control mice were injected with two doses of 1 mg/kg MEKi GSK1120212 and sacrificed 30 h after the first injection (5 h after the second injection). (A) Frequency of CCR7+ DCs among live CD11c+MHCII+F480 lung DCs is shown (***, P < 0.0001; unpaired t test). (B) Frequency of CD11cintMHCIIhigh mDCs and resident CD11chighMHCIIint DCs among live MHCII+CD11c+CD3B220 from skin dLN (*, P < 0.0132; ***, P = 0.0002, unpaired t test). Flow cytometry plots show representative samples, and bar graph shows the mean ± SEM (n = 3). (C) Histogram shows CCR7 surface protein levels CD11cintMHCIIhigh migDCs from skin dLN. (D–F) BRAFV600ECD11c and control mice were injected with 1 mg/kg MEKi GSK1120212 or control vehicle 16 h before FITC painting challenge, injected with drug or control vehicle immediately after FITC painting, and then sacrificed 16 h later to harvest LNs for flow cytometry analysis. Representative of three experiments with two to three mice per group. (D) Representative frequency of FITC+ migDCs within the skin dLN. (E) Graph represents quantification of absolute numbers of FITC+ migDCs (*, P = 0.0213; unpaired t test). (F) CCR7 expression on skin dLN migDCs ±MEKi treatment. (G–J) BRAFV600ECD11c chimeras treated with control or MEKi chow for 3 wk. (G) Survival of BRAFV600ECD11c chimeric mice treated with either control chow or PD0325901 MEKi chow as described in the methods (**, P = 0.0014; Mantel-Cox test). Data shown are the mean survival of six to eight mice per group. (H) Absolute number of CD11c+MHCII+ DCs in the lung of BRAFV600ECD11c chimeras (***, P = 0.0005; unpaired t test) after 3 wk of treatment with PD0325901 MEKi or control chow (n = 8–9 mice/treatment group). (I) Histological scores of LCH lesions in lungs (*, P = 0.0178; unpaired t test) and livers (***, P = 0.0006; unpaired t test) of PD0325901 MEKi or control chow treated BRAFV600ECD11c chimeras. (J) Representative images of treated lung and liver lesions. Bars, 500 µm. (K) Fluorescent nanoparticle labeling of DCs in BRAFV600ECD11c chimeric mice injected i.v. with a single dose of DiO-HDL nanoparticles. Tissues were harvested 48 h after injection and analyzed for fluorescent labeling by flow cytometry. Data represent mean, n = 2 mice. Representative of two experiments (***, P = 0.0005; *, P < 0.05; unpaired t test). (L and M) Efficacy of i.p. injected GSK1120212 MEKi and GSK1120212–loaded nanoparticles. BRAFV600ECD11c chimeras were treated with i.p. injection of control vehicle (Ctrl IP) or MEKi (1 mg/kg GSK1120212; MEKi IP), i.v. injection of empty HDL nanoparticle (Ctrl nano), or i.v. 1 mg/kg GSK1120212-loaded nanoparticle (MEKi nano) two times per week for 2 wk (four total injections). (L) Bar graphs show the absolute numbers of CD11+MHCII+ DCs in the lungs of treated BRAFV600ECD11c chimeras (*, P < 0.05; unpaired t test). Data represent mean ± SEM (n = 3–4 mice per treatment group). (M) TUNEL staining in the liver (*, P = 0.0102; unpaired t test) and lung (*, P = 0.0193; unpaired t test) of treated BRAFV600ECD11c chimeras. Bar graphs show the ratio of TUNEL+ nuclei within granuloma divided by TUNEL+ nuclei in total tissue (*, P < 0.05; unpaired t test). Data represent mean ± SEM (n = 3–4 mice per treatment group).

References

    1. Abla O., Egeler R.M., and Weitzman S.. 2010. Langerhans cell histiocytosis: Current concepts and treatments. Cancer Treat. Rev. 36:354–359. 10.1016/j.ctrv.2010.02.012 - DOI - PubMed
    1. Aguilera-Montilla N., Chamorro S., Nieto C., Sánchez-Cabo F., Dopazo A., Fernández-Salguero P.M., Rodríguez-Fernández J.L., Pello O.M., Andrés V., Cuenda A., et al. 2013. Aryl hydrocarbon receptor contributes to the MEK/ERK-dependent maintenance of the immature state of human dendritic cells. Blood. 121:e108–e117. 10.1182/blood-2012-07-445106 - DOI - PubMed
    1. Alexandrov L.B., Nik-Zainal S., Wedge D.C., Aparicio S.A., Behjati S., Biankin A.V., Bignell G.R., Bolli N., Borg A., Børresen-Dale A.L., et al. ICGC PedBrain . 2013. Signatures of mutational processes in human cancer. Nature. 500:415–421. 10.1038/nature12477 - DOI - PMC - PubMed
    1. Allen C.E., Li L., Peters T.L., Leung H.C., Yu A., Man T.K., Gurusiddappa S., Phillips M.T., Hicks M.J., Gaikwad A., et al. 2010. Cell-specific gene expression in Langerhans cell histiocytosis lesions reveals a distinct profile compared with epidermal Langerhans cells. J. Immunol. 184:4557–4567. 10.4049/jimmunol.0902336 - DOI - PMC - PubMed
    1. Allen C.E., Ladisch S., and McClain K.L.. 2015. How I treat Langerhans cell histiocytosis. Blood. 126:26–35. 10.1182/blood-2014-12-569301 - DOI - PMC - PubMed

Publication types

MeSH terms

Substances