. 2017 Dec 20;9(421):eaai7635.
doi: 10.1126/scitranslmed.aai7635.

A human microglia-like cellular model for assessing the effects of neurodegenerative disease gene variants

Affiliations

A human microglia-like cellular model for assessing the effects of neurodegenerative disease gene variants

Katie J Ryan et al. Sci Transl Med. .

Abstract

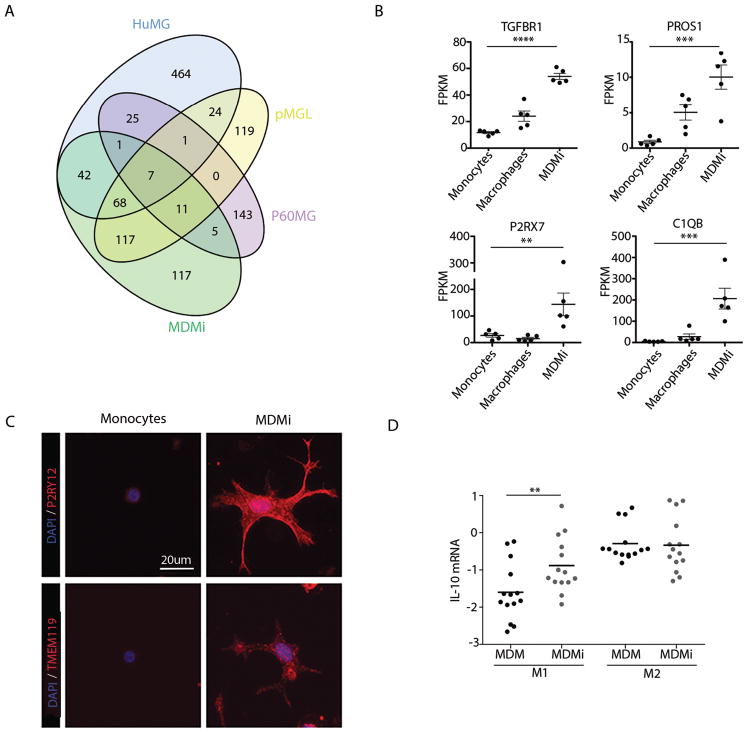
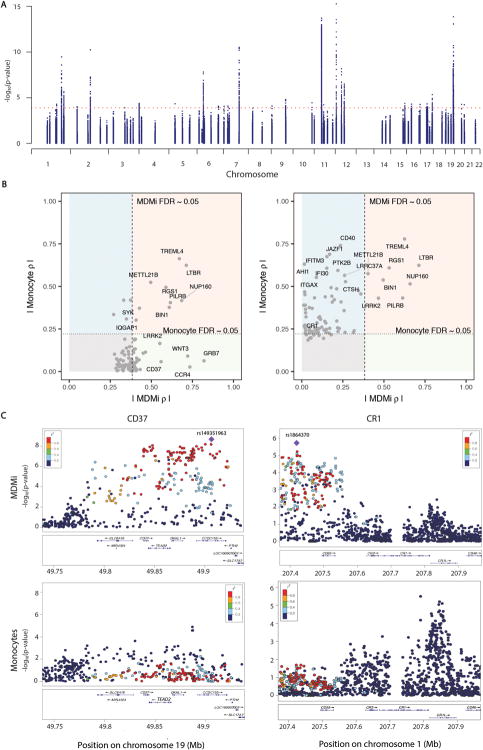
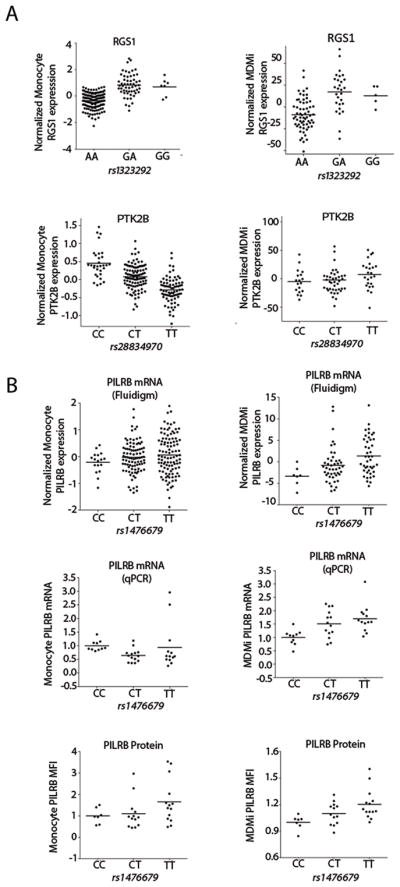
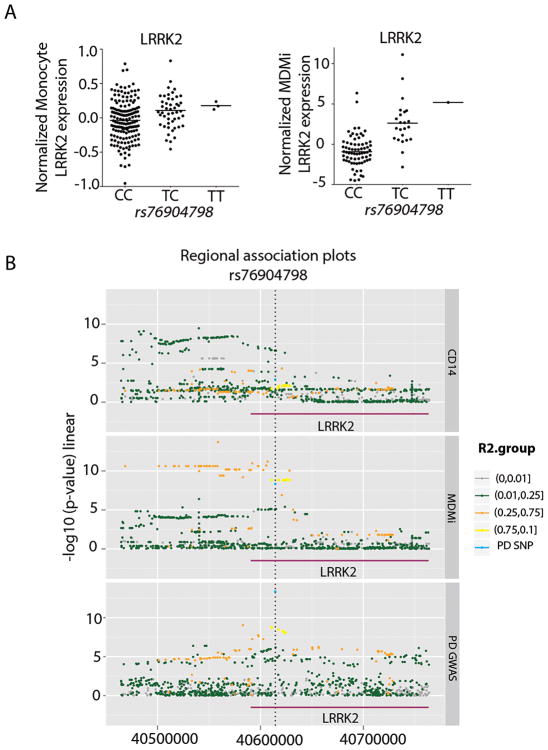
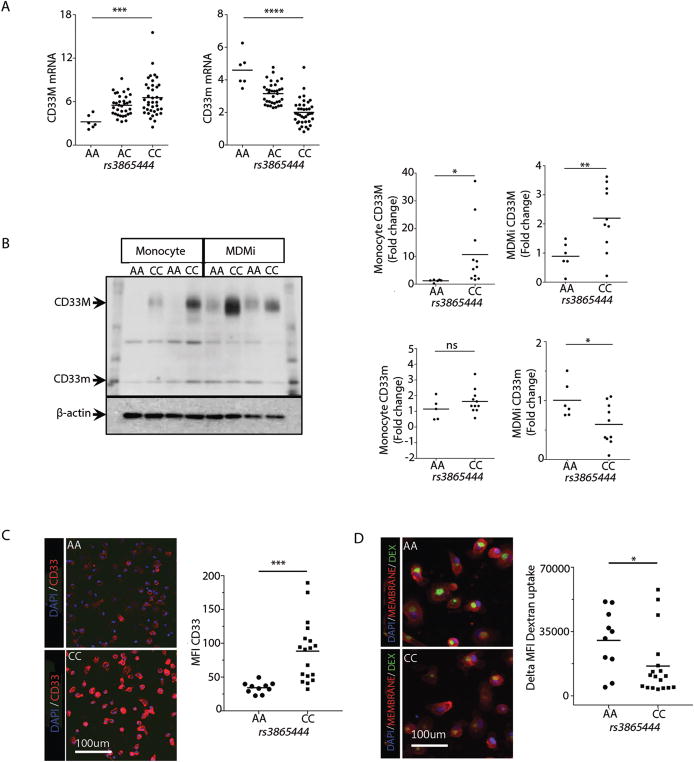
Microglia are emerging as a key cell type in neurodegenerative diseases, yet human microglia are challenging to study in vitro. We developed an in vitro cell model system composed of human monocyte-derived microglia-like (MDMi) cells that recapitulated key aspects of microglia phenotype and function. We then used this model system to perform an expression quantitative trait locus (eQTL) study examining 94 genes from loci associated with Alzheimer's disease, Parkinson's disease, and multiple sclerosis. We found six loci (CD33, PILRB, NUP160, LRRK2, RGS1, and METTL21B) in which the risk haplotype drives the association with both disease susceptibility and altered expression of a nearby gene (cis-eQTL). In the PILRB and LRRK2 loci, the cis-eQTL was found in the MDMi cells but not in human peripheral blood monocytes, suggesting that differentiation of monocytes into microglia-like cells led to the acquisition of a cellular state that could reveal the functional consequences of certain genetic variants. We further validated the effect of risk haplotypes at the protein level for PILRB and CD33, and we confirmed that the CD33 risk haplotype altered phagocytosis by the MDMi cells. We propose that increased LRRK2 gene expression by MDMi cells could be a functional outcome of rs76904798, a single-nucleotide polymorphism in the LRKK2 locus that is associated with Parkinson's disease.


Figures

Fig. 1
Fig. 1. Polarization of monocytes to MDMi induces a microglial gene expression and functional phenotype
Peripheral human monocytes from young healthy subjects were incubated with polarizing cytokines and differentiated to MDMi. (A) The cell-type specific enriched genes for MDMi, ex vivo human microglia (Zhang), ex vivo murine microglia (P60MG) and iPSC/ES induced microglia were compared (pMGL). (B) Four genes defined as being microglia-specific in mice were significantly upregulated in MDMi (TGFβR1 ****P < 0.0001, PROS1 ***P = 0.0005, C1QB ***P = 0.0007, P2RX7 **P = 0.0058) at day 10 of differentiation compared to freshly isolated monocytes and MDM from the same 5 individuals. Gene expression was quantified via RNA-sequencing. One-way ANOVA with Tukey’s post hoc test. (C) P2RY12 and TMEM119 are highly expressed at the protein level in MDMi compared to monocytes. (D) MDMi functionally mimic human microglia in response to conditions that lead to M1 or M2 polarization. Under M1 conditions MDMi express significantly more IL-10 mRNA (**P < 0.01) compared to MDM from the same individuals. Student’s t-test, N = 14. For (B) and (D) each dot represents a biological replicate. Horizontal line denotes the mean.
Fig. 2
Fig. 2. Genotype-induced differential gene expression varies between monocytes and MDMi
Using a Fluidigm high-throughput qPCR chip, we measured the expression of 94 genes found in loci associated with susceptibility to AD, MS or PD in MDMi differentiated from the monocytes of 94 young healthy subjects of European ancestry with genome-wide genotype data. (A) Manhattan plot of eQTL results for the 94 genes measured in MDMi. N = 95 biological replicates per gene. Each dot is one SNP; selected SNPs include all of those found within 1 Mb of the transcription start site of the profiled gene. The x-axis denotes the physical position of the SNP, and the y axis reports the significance of the SNP’s association with the expression of the nearby gene (eQTL result). The red line highlights the threshold of significance in our analysis. (B) We compared our MDMi eQTL results to those of our previously published monocyte eQTL results derived from N = 211 young, healthy subjects of European ancestry (13). In the left panel, we plot the top eQTL SNP for each gene in the MDMi data; the x-axis reports the absolute value of the effect size (ρ) of the SNP in MDMI while the ρ in the monocyte data is presented in the y-axis. The threshold of significance (FDR<0.05) is shown by dotted lines in each dimension. The light red quadrant contains those loci with consistent effects in both cell types, while the light green quadrant contains those loci which have a significant association only in MDMi cells. The light blue quadrant contains those loci with an effect in monocytes that is not significant in our current MDMi analysis. The right panel displays the best SNP for each locus in the monocyte data. (C) Locus zoom plots highlight the regional distribution of associations in two loci, CD37 and CR1, which have very different eQTL associations in the two cell types. Each dot is one SNP in these figures, with the physical position captured on the x-axis and eQTL significance on the y-axis. The location of genes in this locus is shown below the SNPs. The top eQTL SNP for the MDMi data is shown as a purple diamond, and the other SNPs are colored by the extent of linkage disequilibrium (r2) with the lead SNP. In the monocyte plots, the SNP colors are defined by the lead MDMi SNP, highlighting the fact that the haplotype driving association in MDMi does not have a strong effect in monocytes. MDMi N = 95 biological replicates, monocytes N = 211 biological replicates.
Fig. 3
Fig. 3. Association of disease-specific GWAS SNPs with gene expression in MDMi identifies different associations than in monocytes
Each gene selected for the fluidigm experiment is in a locus associated with either AD, PD or MS. (A) Example of a cis-eQTL shared between monocytes and MDMi (upper pair of graphs): the association for RGS1 expression and the MS risk allele rs1323292G were similar in both cell types. With PTK2B (lower pair of graphs), the AD associated rs28834970C risk allele has an effect in monocytes but not in MDMi. N = 95 (MDMi), N = 211 (monocytes). (B) A significant eQTL was found in MDMi for the PILRB gene (P = 0.00084), illustrated with the AD SNP rs1476679 that was not seen in the monocyte dataset (P = 0.19) (upper row). N = 95 (MDMi), N = 211 (monocytes). This finding was replicated in an independent set of 37 individuals at the RNA level (P = 0.0034) using TaqMan PCR (middle row) and 34 individuals at the protein level (P = 0.0112) (bottom row). One-way ANOVA with Tukey’s post hoc test. Each dot represents a biological replicate. Horizontal line denotes the mean.
Fig. 4
Fig. 4. Significant association in MDMi between LRRK2 gene expression and the PD SNP rs7690479
(A) The PD GWAS rs76904798T risk allele was associated with increased LRRK2 expression in MDMi (right) (P < 8.92E-07), while there is a non-significant trend in the monocyte data (left) (P < 1.77E-02). (B) Three regional association plots illustrate the colocalization of the PD susceptibility haplotype, tagged by rs76904798, and the eQTL haplotype in MDMi but not in monocytes. In the top panel, we present data from monocytes: each dot is one SNP and is colored in relation to the extent of linkage disequilibrium (r2) with the lead PD SNP (rs76904798). The color key is presented to the right of the panels. The x-axis presents the physical position of the SNP, and the y-axis presents the association between the SNP and the level of LRRK2 expression. In the middle panel, the same set of SNPs is presented; here, the association P-value is derived from the relation of each SNP to LRRK2 expression in MDMi cells. In the bottom panel, the results of the published PD GWAS (44) are presented for the same set of SNPs.
Fig. 5
Fig. 5. Differential expression of CD33 isoforms in MDM
(A) In our model system, we found a significant effect of genotype on CD33 expression: an increase in CD33M mRNA expression (***P = 0.0009) and decreased CD33m mRNA expression (****P < 0.0001) in MDMi in a dose dependent fashion relative to the rs3865444C risk allele in the fluidigm dataset. One-way ANOVA with Tukey’s post hoc test, N = 95. (B) Western blot analysis shows a significant effect of genotype on CD33M protein expression in monocytes (*P = 0.034) and MDMi (**P = 0.009) from a second set of individuals (N = 16). However, a significant effect of genotype on CD33m protein expression was only observed in MDMi (*P = 0.016) and not monocytes (P = 0.124). A representative western blot displays the data from four subjects, with each subject being in a column. The genotype of the subject is included at the top of the column. (C) The genotype-dependent difference in CD33 surface expression (P = 0.001) and (D) FITC-dextran uptake (P = 0.047) was further confirmed in MDMi using high content imaging. Each dot represents a biological replicate. Student’s t-test performed for B–D.

References

    1. Bradshaw EM, Chibnik LB, Keenan BT, Ottoboni L, Raj T, Tang A, Rosenkrantz LL, Imboywa S, Lee M, Von Korff A, Morris MC, Evans DA, Johnson K, Sperling RA, Schneider JA, Bennett DA, De Jager PL. CD33 Alzheimer’s disease locus: altered monocyte function and amyloid biology. Nature neuroscience. 2013;16:848–850. - PMC - PubMed
    1. Griciuc A, Serrano-Pozo A, Parrado AR, Lesinski AN, Asselin CN, Mullin K, Hooli B, Choi SH, Hyman BT, Tanzi RE. Alzheimer’s disease risk gene CD33 inhibits microglial uptake of amyloid beta. Neuron. 2013;78:631–643. - PMC - PubMed
    1. Malik M, Simpson JF, Parikh I, Wilfred BR, Fardo DW, Nelson PT, Estus S. CD33 Alzheimer’s risk-altering polymorphism, CD33 expression, and exon 2 splicing. The Journal of neuroscience: the official journal of the Society for Neuroscience. 2013;33:13320–13325. - PMC - PubMed
    1. Guerreiro RJ, Lohmann E, Bras JM, Gibbs JR, Rohrer JD, Gurunlian N, Dursun B, Bilgic B, Hanagasi H, Gurvit H, Emre M, Singleton A, Hardy J. Using exome sequencing to reveal mutations in TREM2 presenting as a frontotemporal dementia-like syndrome without bone involvement. JAMA neurology. 2013;70:78–84. - PMC - PubMed
    1. Guerreiro R, Wojtas A, Bras J, Carrasquillo M, Rogaeva E, Majounie E, Cruchaga C, Sassi C, Kauwe JS, Younkin S, Hazrati L, Collinge J, Pocock J, Lashley T, Williams J, Lambert JC, Amouyel P, Goate A, Rademakers R, Morgan K, Powell J, St George-Hyslop P, Singleton A, Hardy J. TREM2 variants in Alzheimer’s disease. The New England journal of medicine. 2013;368:117–127. - PMC - PubMed

Substances

LinkOut - more resources