. 2018 Jan 31;38(5):1249-1263.
doi: 10.1523/JNEUROSCI.2988-17.2017. Epub 2017 Dec 20.

Gonadotropin-Releasing Hormone (GnRH) Neuron Excitability Is Regulated by Estradiol Feedback and Kisspeptin

Affiliations

Gonadotropin-Releasing Hormone (GnRH) Neuron Excitability Is Regulated by Estradiol Feedback and Kisspeptin

Caroline Adams et al. J Neurosci. .

Abstract

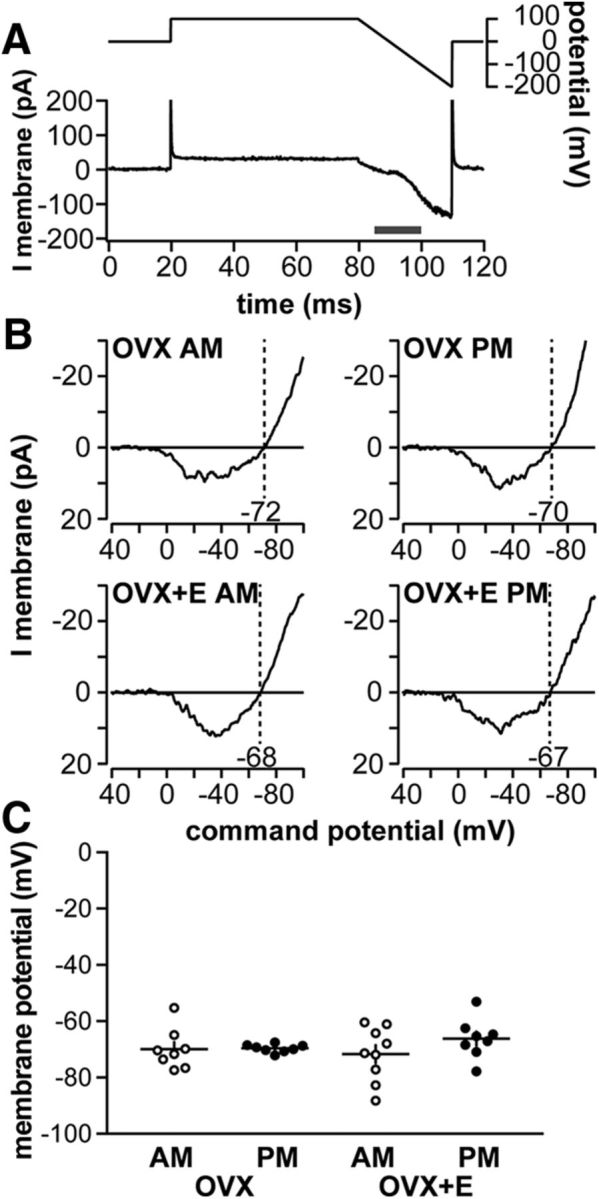
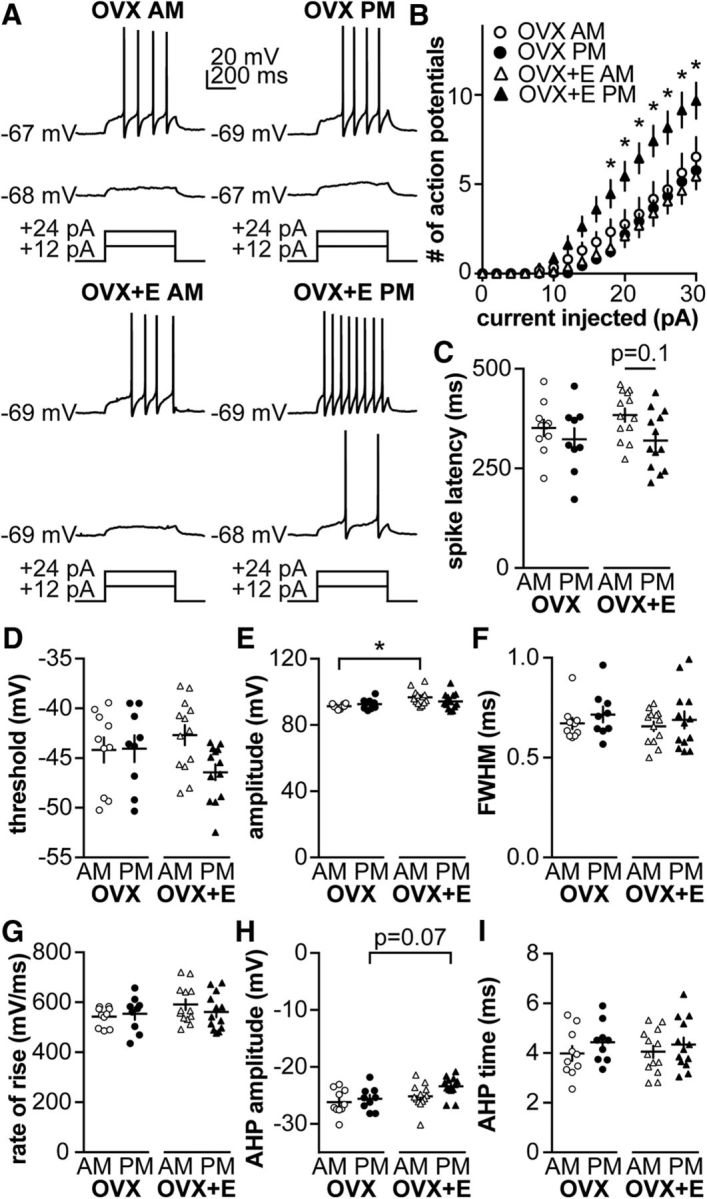
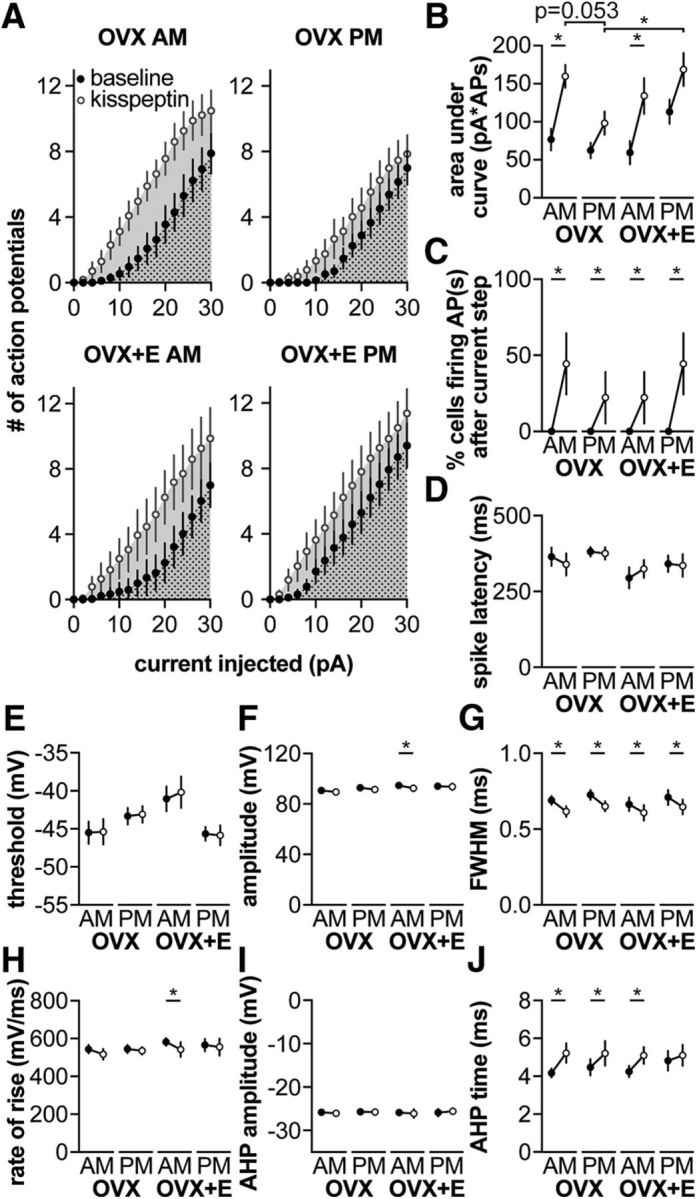
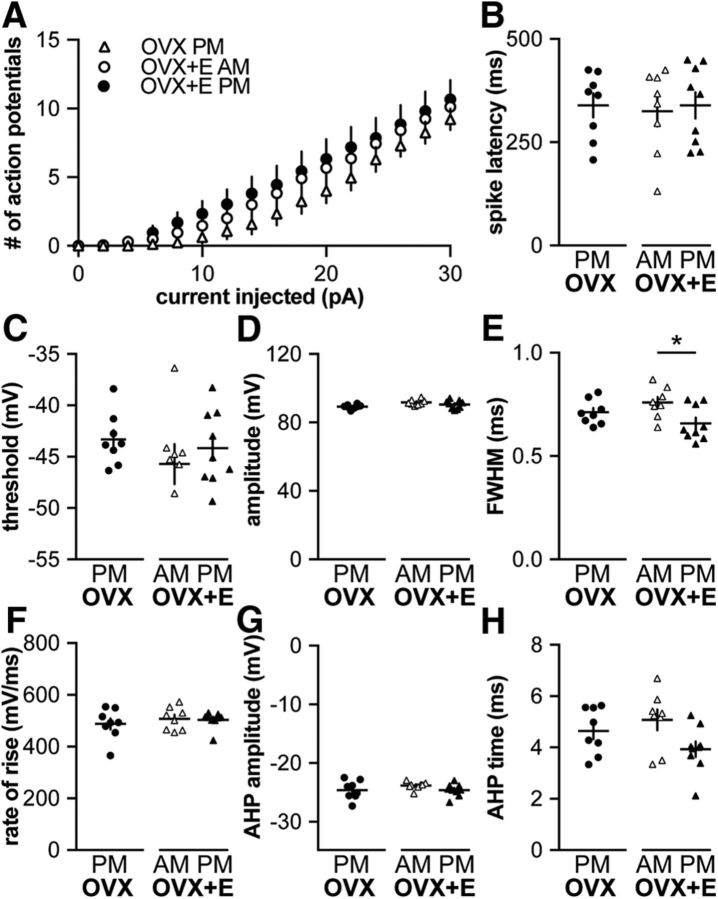
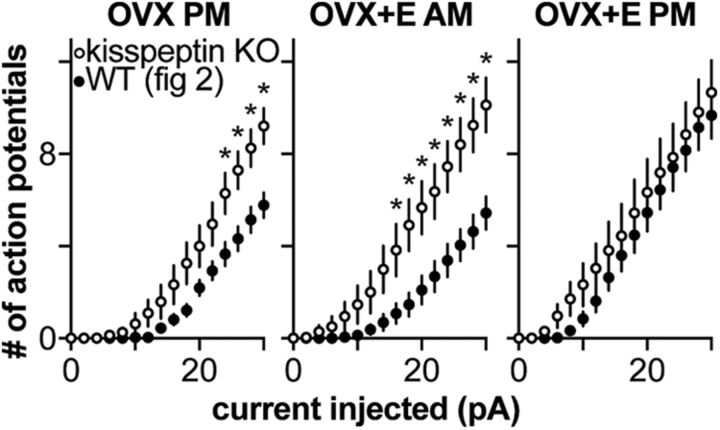
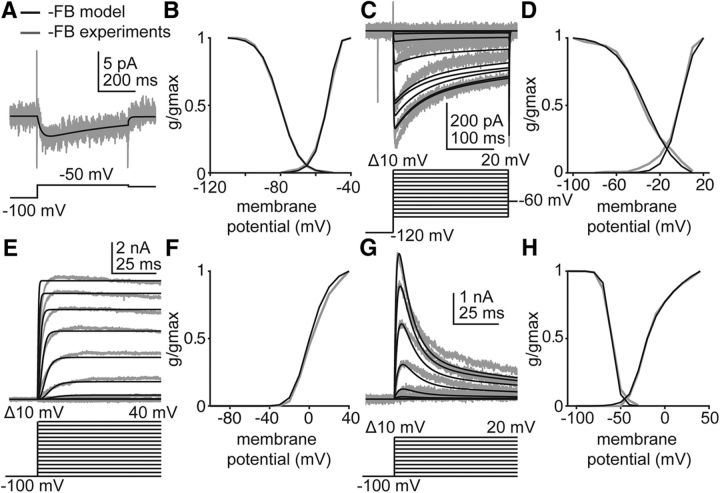
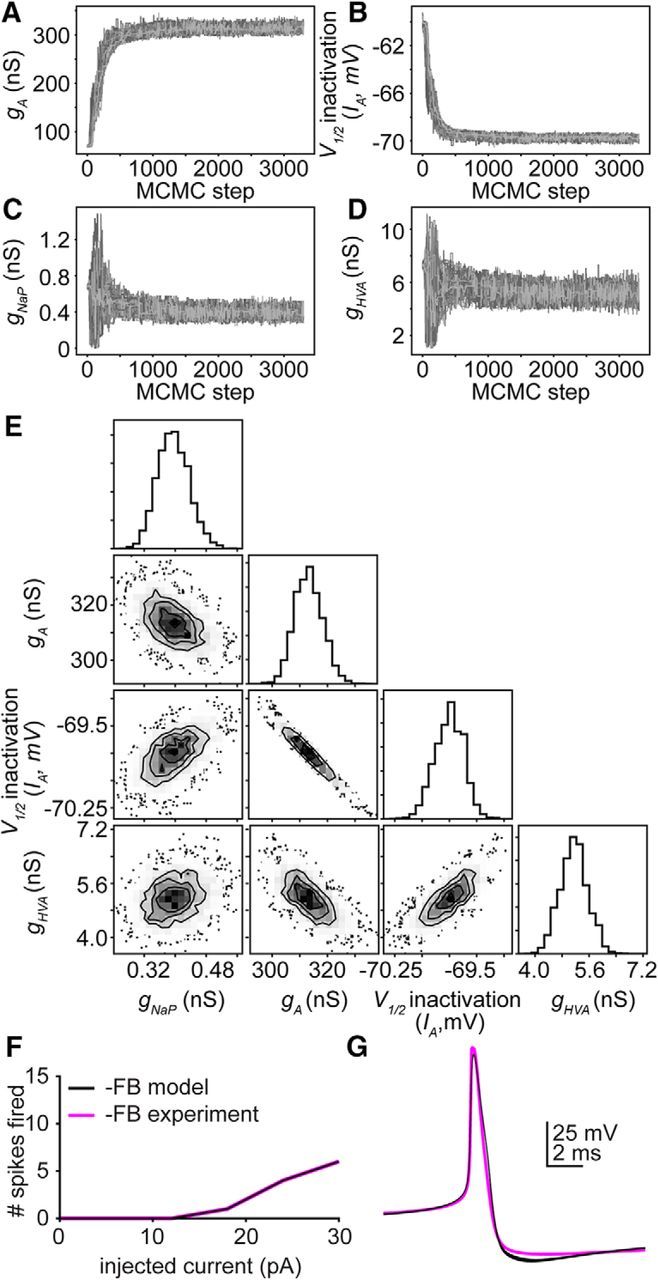
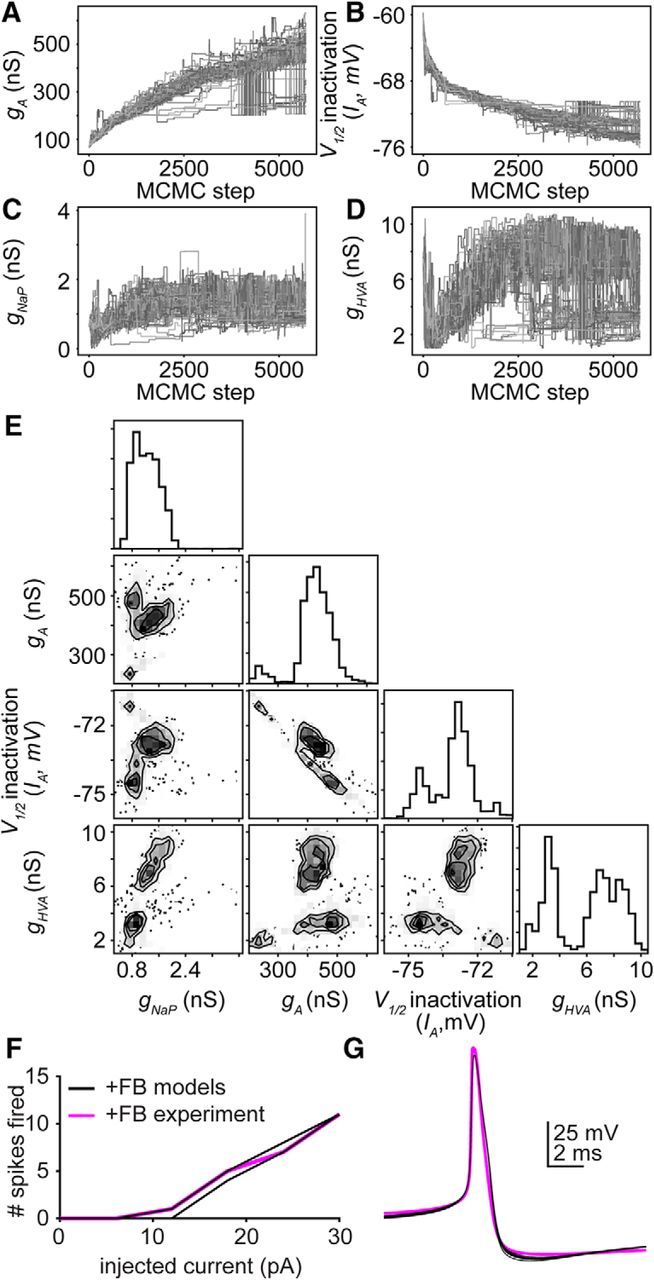
Gonadotropin-releasing hormone (GnRH) neurons produce the central output controlling fertility and are regulated by steroid feedback. A switch from estradiol negative to positive feedback initiates the GnRH surge, ultimately triggering ovulation. This occurs on a daily basis in ovariectomized, estradiol-treated (OVX+E) mice; GnRH neurons are suppressed in the morning and activated in the afternoon. To test the hypotheses that estradiol and time of day signals alter GnRH neuron responsiveness to stimuli, GFP-identified GnRH neurons in brain slices from OVX+E or OVX female mice were recorded during the morning or afternoon. No differences were observed in baseline membrane potential. Current-clamp revealed GnRH neurons fired more action potentials in response to current injection during positive feedback relative to all other groups, which were not different from each other despite reports of differing ionic conductances. Kisspeptin increased GnRH neuron response in cells from OVX and OVX+E mice in the morning but not afternoon. Paradoxically, excitability in kisspeptin knock-out mice was similar to the maximum observed in control mice but was unchanged by time of day or estradiol. A mathematical model applying a Markov Chain Monte Carlo method to estimate probability distributions for estradiol- and time of day-dependent parameters was used to predict intrinsic properties underlying excitability changes. A single identifiable distribution of solutions accounted for similar GnRH neuron excitability in all groups other than positive feedback despite different underlying conductance properties; this was attributable to interdependence of voltage-gated potassium channel properties. In contrast, redundant solutions may explain positive feedback, perhaps indicative of the importance of this state for species survival.SIGNIFICANCE STATEMENT Infertility affects 15%-20% of couples; failure to ovulate is a common cause. Understanding how the brain controls ovulation is critical for new developments in both infertility treatment and contraception. Gonadotropin-releasing hormone (GnRH) neurons are the final common pathway for central neural control of ovulation. We studied how estradiol feedback regulates GnRH excitability, a key determinant of neural firing rate using laboratory and computational approaches. GnRH excitability is upregulated during positive feedback, perhaps driving increased neural firing rate at this time. Kisspeptin increased GnRH excitability and was essential for estradiol regulation of excitability. Modeling predicts that multiple combinations of changes to GnRH intrinsic conductances can produce the firing response in positive feedback, suggesting the brain has many ways to induce ovulation.

Keywords: GnRH; Markov Chain Monte Carlo; computational; estradiol; feedback; kisspeptin.


Figures

Figure 1.
Figure 1.
Baseline membrane potential of GnRH neurons is not modulated by time of day or estradiol. A, OCVm recording methodology. Top, Voltage protocol. Bottom, Resulting membrane current. B, Representative leak-subtracted OCVm traces from OVX AM, OVX PM, OVX+E AM, and OVX+E PM neurons. C, No difference in baseline membrane potential (individual values and mean ± SEM, two-way ANOVA/Bonferroni) was observed among experimental groups.
Figure 2.
Figure 2.
GnRH neuron excitability is increased during positive feedback. A, Representative traces from neurons in each group during 500 ms current injections of 12 and 24 pA (injection protocol below). B, Mean ± SEM spikes elicited for each current injection step. C–I, Individual values and mean ± SEM. C, Latency to first spike. D, Action potential threshold. E, Action potential amplitude. F, FWHM. G, Action potential rate of rise. H, AHP amplitude. I, AHP time. *p < 0.05 versus OVX+E PM, three-way repeated-measures ANOVA/Bonferroni test in B (estradiol: F(1,41) = 3.5, p = 0.07; time of day: F(1,41) = 3.7, p = 0.06; current: F(15,615) = 154, p < 0.001; current × estradiol: F(15,615) = 2.7, p = 0.1; current × time of day: F(15,615) = 4.2 p < 0.05, estradiol × time of day: F(1,41) = 8.9 p < 0.01, current × estradiol × time of day: F(15,615) = 6.7 p < 0.1) or two-way ANOVA/Bonferroni in C–I.
Figure 3.
Figure 3.
Kisspeptin increases GnRH neuron excitability in a time of day–dependent manner. A, Mean ± 75th percentile CI for spikes elicited during 500 ms current injection (0–30 pA, 2 pA steps) before (black symbols) and during (white symbols) kisspeptin treatment. Dotted area was used to calculate AUC for baseline measurements. Dotted area + solid area was used to calculate AUC for kisspeptin treatment. B–J, Mean ± 75th percentile CI before and during kisspeptin treatment. B, AUC. C, Percentage of cells firing within 1.5 s after termination of the current step. D, Spike latency. E, Threshold. F, Action potential amplitude. G, FWHM. H, Rate of rise. I, AHP amplitude. J, AHP time. When error bars are not visible, they are contained within the symbol. Lines connect means before and during kisspeptin. *p < 0.05, baseline versus kisspeptin (three-way, repeated-measures ANOVA/Bonferroni, or χ2) (C).
Figure 4.
Figure 4.
GnRH neuron excitability is independent of time of day and estradiol feedback in kisspeptin KO mice. A, Mean ± SEM number of spikes elicited during 500 ms current injection (0–30 pA, 2 pA steps). B–H, Individual values and mean ± SEM. B, Latency to first spike. C, Action potential threshold. D, Action potential amplitude. E, FWHM. F, Action potential rate of rise. G, AHP amplitude. H, AHP time. *p < 0.05, two-way repeated-measures ANOVA/Bonferroni test (A; group: F(2,22) = 0.9; current: F(15,330) = 128.4, p < 0.001; group × current: F(30,330) = 0.6), one-way ANOVA/Bonferroni (B; F(2,22) = 0.06; C; F(2,22) = 0.7; D; F(2,22) = 3.2, p = 0.06; E; F(2,22) = 4.0, p < 0.05; G; F(2,22) = 1.15; H; F(2,22) = 2.93, p = 0.07) or Kruskal–Wallis/Dunn's (F; F(2,22) = 2.93, p = 0.07).
Figure 5.
Figure 5.
GnRH neuron excitability in kisspeptin KO mice is similar to GnRH excitability during positive feedback in wild-type mice. Mean ± SEM number of spikes elicited during 500 ms current injection (0–30 pA, 2 pA steps) from kisspeptin KO mice (Fig. 4, white circles) and in control mice (Fig. 2, black circles). *p < 0.05, three-way repeated-measures ANOVA/Bonferroni (group: F(2,54) = 167.2, p < 0.001; kisspeptin KO: F(1,54) = 10.2, p < 0.01, current: F(15,810) = 273.5, p < 0.001; group × kisspeptin KO: F(2,54) = 0.4; group × current: F(30,810) = 4.1, p < 0.001; kisspeptin KO × current: F(15,810) = 7.9, p < 0.001; kisspeptin KO × group × current: F(30,810) = 2.2, p < 0.001).
Figure 6.
Figure 6.
The GnRH neuron model reproduces IA, IK, IHVA, and ILVA isolated in voltage-clamp experiments performed during negative feedback. Empirical data (gray) and model-simulated current (black) used in Hodgkin-Huxley modeling. Voltage protocols are located beneath the current responses in A, C, E, and G. Only those voltage steps used to estimate parameters for the simulated data are shown. A, ILVA in response to a depolarizing voltage step in OVXE+ AM mice. Empirical data from Sun et al. (2010). B, Simulated and empirical ILVA activation and inactivation curves from OVX+E mice during negative feedback. Empirical data from Zhang et al. (2009). C, Simulated and empirical IHVA in response to depolarizing voltage steps (below current response) during negative feedback. Empirical data from Sun et al. (2010). D, Simulated and empirical IHVA activation and inactivation curves determined from voltage-clamp experiments. Empirical data from Sun et al. (2010). E, Simulated and empirical IK in response to depolarizing voltage steps during negative feedback. F, Simulated and empirical activation curves for IK during negative feedback, determined from activation protocol in E. G, Simulated and empirical IA during depolarizing voltage steps during negative feedback. H, Simulated and empirical activation and inactivation curves for IA during negative feedback. Values from these fits populate Table 1, gvc.
Figure 7.
Figure 7.
A hyperpolarizing shift in V1/2 inactivation of IA can oppose an increase in maximum IA channel number to prevent changes in excitability. A–D, Convergence plots for parameters: A, gA. B, V1/2 inactivation of IA. C, gNaP. D, gHVA. Each line indicates the value of a single walker (of 100) over 3300 iterations. E, Far right panel in each row, individual probability distributions for the parameters gHVA, V1/2 inactivation of IA, gA, and gHVA for the simulation in F, G. Two-dimensional probability distributions in the other panels determine whether parameter values vary independently (gNaP and gHVA) or dependently (gA and V1/2 inactivation of IA) of one another. F, Ten simulated (black) parameter sets selected along the interdependent distribution for g and V1/2 inactivation, and a representative empirical GnRH neuron (magenta) responses to 500 ms current injections during negative feedback (0–30 pA, 6 pA steps). G, Ten simulated and empirical action potential waveforms during negative feedback.
Figure 8.
Figure 8.
Multiple parameter sets can reproduce increased excitability during positive feedback. A–D, Convergence plots for parameters. A, gA. B, V1/2 inactivation of IA. C, gNaP. D, gHVA. Each line indicates the value of a single walker (of 100) over 5700 iterations. E, Far right panel in each row, individual probability distributions for the parameters gHVA, V1/2 inactivation of IA, gA, and gHVA for the simulation in F, G. Two-dimensional probability distributions in the other panels determine whether parameter values vary independently or dependently on one another. F, Ten simulated (black, randomselected from parameter sets in A–D) and a representative empirical GnRH neuron (magenta) response to 500 ms current step injections during positive feedback (0–30 pA, 6 pA steps). G, Ten simulated and empirical action potential waveforms during positive feedback.
Figure 9.
Figure 9.
Persistent sodium currents can induce spiking after termination of a current step. A, Spikes can be initiated after the current step in cells from an OVX+EAM mouse (black) and model (gray). B, Individual currents during model membrane response in A, IA (top gray), IKca (top black), INaF (bottom gray), and INaP (bottom black). Currents for INaF and IA reach >1 nA during an action potential and have been truncated to more clearly observe ionic currents active after termination of the current step.

References

    1. Abramowitz M, Stegun IA (1964) Handbook of mathematical functions with formulas, graphs, and mathematical tables. Washington, DC: U.S. Government Printing Office.
    1. Barry PH. (1994) JPCalc, a software package for calculating liquid junction potential corrections in patch-clamp, intracellular, epithelial and bilayer measurements and for correcting junction potential measurements. J Neurosci Methods 51:107–116. 10.1016/0165-0270(94)90031-0 - DOI - PubMed
    1. Chan YM, Broder-Fingert S, Wong KM, Seminara SB (2009) Kisspeptin/Gpr54-independent gonadotrophin-releasing hormone activity in Kiss1 and Gpr54 mutant mice. J Neuroendocrinol 21:1015–1023. 10.1111/j.1365-2826.2009.01926.x - DOI - PMC - PubMed
    1. Christian CA, Moenter SM (2007) Estradiol induces diurnal shifts in GABA transmission to gonadotropin-releasing hormone neurons to provide a neural signal for ovulation. J Neurosci 27:1913–1921. 10.1523/JNEUROSCI.4738-06.2007 - DOI - PMC - PubMed
    1. Christian CA, Moenter SM (2010) The neurobiology of preovulatory and estradiol-induced gonadotropin-releasing hormone surges. Endocr Rev 31:544–577. 10.1210/er.2009-0023 - DOI - PMC - PubMed

Publication types

LinkOut - more resources