. 2018 Jan 31;38(5):1202-1217.
doi: 10.1523/JNEUROSCI.1111-17.2017. Epub 2017 Dec 20.

Attention Shifts Recruit the Monkey Default Mode Network

Affiliations

Attention Shifts Recruit the Monkey Default Mode Network

John T Arsenault et al. J Neurosci. .

Abstract

A unifying function associated with the default mode network (DMN), which is more active during rest than under active task conditions, has been difficult to define. The DMN is activated during monitoring the external world for unexpected events, as a sentinel, and when humans are engaged in high-level internally focused tasks. The existence of DMN correlates in other species, such as mice, challenge the idea that internally focused, high-level cognitive operations, such as introspection, autobiographical memory retrieval, planning the future, and predicting someone else's thoughts, are evolutionarily preserved defining properties of the DMN. A recent human study demonstrated that demanding cognitive shifts could recruit the DMN, yet it is unknown whether this holds for nonhuman species. Therefore, we tested whether large changes in cognitive context would recruit DMN regions in female and male nonhuman primates. Such changes were measured as displacements of spatial attentional weights based on internal rules of relevance (spatial shifts) compared with maintaining attentional weights at the same location (stay events). Using fMRI in macaques, we detected that a cortical network, activated during shifts, largely overlapped with the DMN. Moreover, fMRI time courses sampled from independently defined DMN foci showed significant shift selectivity during the demanding attention task. Finally, functional clustering based on independent resting state data revealed that DMN and shift regions clustered conjointly, whereas regions activated during the stay events clustered apart. We therefore propose that cognitive shifting in primates generally recruits DMN regions. This might explain a breakdown of the DMN in many neurological diseases characterized by declined cognitive flexibility.SIGNIFICANCE STATEMENT Activation of the human default mode network (DMN) can be measured with fMRI when subjects shift thoughts between high-level internally directed cognitive states, when thinking about the self, the perspective of others, when imagining future and past events, and during mind wandering. Furthermore, the DMN is activated as a sentinel, monitoring the environment for unexpected events. Arguably, these cognitive processes have in common fast and substantial changes in cognitive context. As DMN activity has also been reported in nonhuman species, we tested whether shifts in spatial attention activated the monkey DMN. Core monkey DMN and shift-selective regions shared several functional properties, indicating that cognitive shifting, in general, might constitute one of the evolutionarily preserved functions of the DMN.

Keywords: DMN; attention; cognition; fMRI; monkey.


Figures

Figure 1.
Figure 1.
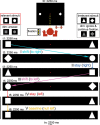
Stimuli and task used to measure covert spatial attention shifts. Top, Schematic of display viewed by the monkey. One of the two stimulus pairs (each consisting of a relevant and an irrelevant shape) was presented at any given time while the monkey fixated within a 2 × 3 degree fixation window. Top left, Dimming of the relevant shapes had to be indicated by a manual response to receive a juice reward. Top right, Dimming of the irrelevant shapes had to be ignored. Each pair was replaced, with no temporal gap, by the succeeding pair after 2250 ms, resulting in a shift (I, III), stay (II, IV), or null (V, null left) event. The monkey's attention was locked to the relevant stimulus (square or circle) and shifted (or stayed) with it during consecutive stimulus displays.
Figure 2.
Figure 2.
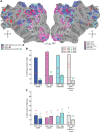
Shift and contralateral modulation of attention compared with the monkey DMN. Inflated (bottom, medial-parietal and lateral view) and flattened (top) surfaces of the F99 monkey brain showing data of the mixed-effects group analysis (3 monkeys), for shifting (hot color, with scalebar) and contralateral attention (green transparent color), both compared with the probabilistic monkey DMN (blue) (Mantini et al., 2011). Task-related data are shown at uncorrected level (MFX) but are present at corrected level (FWE, p < 0.05) in the FFX. Numbers indicate percent overlap of voxels activated for shifting (red box), and contralateral attention (green box), with the DMN (LH and RH). Retinotopic outlines (white, 0.25°–12.25° eccentricity) are from Janssens et al. (2014). D, Dorsal; A, anterior; V, ventral; P, posterior. Sulci: i.p., Intraparietal; c, central; st, superior temporal. PP, Posterior parietal; apcs, anterior principal sulcus; PITd/v, posterior inferotemporal dorsal/ventral.
Figure 3.
Figure 3.
Raw time courses of shift, stay, and DMN ROIs. A, F, Coronal sections with activations of the group (n = 3) for shift versus stay (A, same as hot color in Fig. 2), and stay left versus stay right (F, hot color same as green in RH in Fig. 2) are shown in F99 space. Data are from the group mixed-effects analyses (n = 3). B–E, Raw time courses of these example shift (B, C) and stay (D, E) ROIs. G–J, Average time courses are plotted for all shift (G), stay (I, J), and DMN ROIs (H). All ROIs are listed in Table 1. Figure represents percent MR signal change of each condition against a sustained attention baseline (B, D) compared with a moving average baseline (C, E, G–J), at the respective local maxima (2 mm sphere). Dotted lines indicate event onset. Raw time courses are extracted from an equal number of runs across animals (n = 3, FFX). Error bars indicate the SEM across trials. H, Shifts were significantly different from stay events (F(1,11) = 112.8). *p < 0.0001 (repeated-measures ANOVA). Shifts (shift, stay) × (left/right), summarized by the bar plot inset representing data values at 4 s, and the respective SEs across ROIs. Shift left and shift right were also significantly different from the null events/baseline (p < 0.005, paired t test).
Figure 4.
Figure 4.
Task-related shift network compared with currently existing definitions of the DMN. A, (1) DMNt (dark blue): meta-analysis of task-related deactivations (Mantini et al., 2011), corresponding to the original definition used in human (Raichle et al., 2001); (2) DMNic (purple): ICA (IC is spatially best correlating with 1); (3) DMNseed (light blue): defined by seeding in PCC node (area 31/23) indicated on the flat map (dotted circle). DMNvis is not shown on the figure to prevent overcrowding. Numbered circles represent the location of ROIs (local maxima), of each DMN in the corresponding color, that entered the cross-correlation analysis in Figure 6 (also listed in Table 1). For labels and flat map, same conventions as in Figure 2. B, Percent overlap of shift-selective (contrast 3) and stay-selective (contrast 1 and 2) voxels, with each version of the DMN and (C) percent overlap of the DMN with the shift- and stay-selective voxels for the group (bars, N = 3) and individual monkeys (red represents shift activations; green represents stay activations). Same conventions as in Figure 2 (for each contrast), and A (for colors). Rightmost plot represents task-related deactivations in the stimulus localizer data of the same animals contrasting the fixation-only condition versus visual stimulation (DMN Fixation vs Visual). Volume sections of the different DMNs are displayed in Figure 5. Dashed lines indicate the chance level overlap, as determined by randomly shuffling of voxels (1000×) across the gray matter surface. *p < 0.001.
Figure 5.
Figure 5.
Transverse volume sections of four DMN definitions as displayed in Figure 4A. A, DMNt, as defined by Mantini et al. (2011) in a meta-analysis of task-related deactivations across 15 experiments (at threshold 8 of 15 experiments). B, C, DMNs obtained from the resting state scans across the 3 animals (awake while fixating). B, DMNic, defined by ICA at threshold z = 1 (Hutchison et al., 2011). C, DMNseed, defined by seeding in medial PCC node (border of area 23/31, seed position indicated on slice 0 with dotted circle) (Vincent et al., 2007; Hutchison et al., 2011), FFX, thresholded at FWE (p = 0.05). D, DMN fixation versus visual obtained from an independent stimulus localizer dataset, FFX across all sessions of the 3 monkeys, thresholded at FWE (p = 0.05), contrasting fixation with visual stimulation (same stimuli and eccentricity as shown during selective attention task). fMRI data analysis.
Figure 6.
Figure 6.
ROI cross-correlation analyses between nodes of task-related shift and stay networks (Caspari et al., 2015) and core nodes of the DMN. Significant correlation between DMN and posterior shift ROIs. Nodes were defined as 2 mm radius spheres around local maxima of each ROI (Table 1). Correlation values are indicated with color code (red represents high correlation; blue represents anticorrelation), representing the average correlation across all sessions of all animals. Significances are computed from a MFX across sessions (n = 6, 2 per animal, at p < 0.001). Black squares in the matrix have the same stereotactic coordinate; hence, no value was calculated. **p < 0.001. 3p < 0.0001. 4p < 0.00001. 5FWE (p = 0.05). Same conventions as in Figures 2–4. L, Left; R, right; PO, parieto-occipital.
Figure 7.
Figure 7.
Clustering across stay, shift, and DMN ROIs. Dendrogram represents the unsupervised clustering of all the ROIs from the correlation matrix in Figure 6 based on their functional correlation values, using the average linkage algorithm (Everitt et al., 2001; Mantini et al., 2011). Clusters with a linkage distance >0.5 are colored according to whether they include stay (green), or shift (red) seeds, or a mixture of shift and DMN seeds (purple).

References

    1. Abou-Elseoud A, Starck T, Remes J, Nikkinen J, Tervonen O, Kiviniemi V (2010) The effect of model order selection in group PICA. Hum Brain Mapp 31:1207–1216. 10.1002/hbm.20929 - DOI - PMC - PubMed
    1. Andrews-Hanna JR, Reidler JS, Sepulcre J, Poulin R, Buckner RL (2010) Functional-anatomic fractionation of the brain's default network. Neuron 65:550–562. 10.1016/j.neuron.2010.02.005 - DOI - PMC - PubMed
    1. Anticevic A, Repovs G, Shulman GL, Barch DM (2010) When less is more: TPJ and default network deactivation during encoding predicts working memory performance. Neuroimage 49:2638–2648. 10.1016/j.neuroimage.2009.11.008 - DOI - PMC - PubMed
    1. Arsenault JT, Nelissen K, Jarraya B, Vanduffel W (2013) Dopaminergic reward signals selectively decrease fMRI activity in primate visual cortex. Neuron 77:1174–1186. 10.1016/j.neuron.2013.01.008 - DOI - PMC - PubMed
    1. Berger HJ, Aerts FH, van Spaendonck KP, Cools AR, Teunisse JP (2003) Central coherence and cognitive shifting in relation to social improvement in high-functioning young adults with autism. J Clin Exp Neuropsychol 25:502–511. 10.1076/jcen.25.4.502.13870 - DOI - PubMed

Publication types

LinkOut - more resources