. 2017 Dec 21;2(24):e92854.
doi: 10.1172/jci.insight.92854.

Nrf2/antioxidant pathway mediates β cell self-repair after damage by high-fat diet-induced oxidative stress

Affiliations

Nrf2/antioxidant pathway mediates β cell self-repair after damage by high-fat diet-induced oxidative stress

Tsehay Abebe et al. JCI Insight. .

Abstract

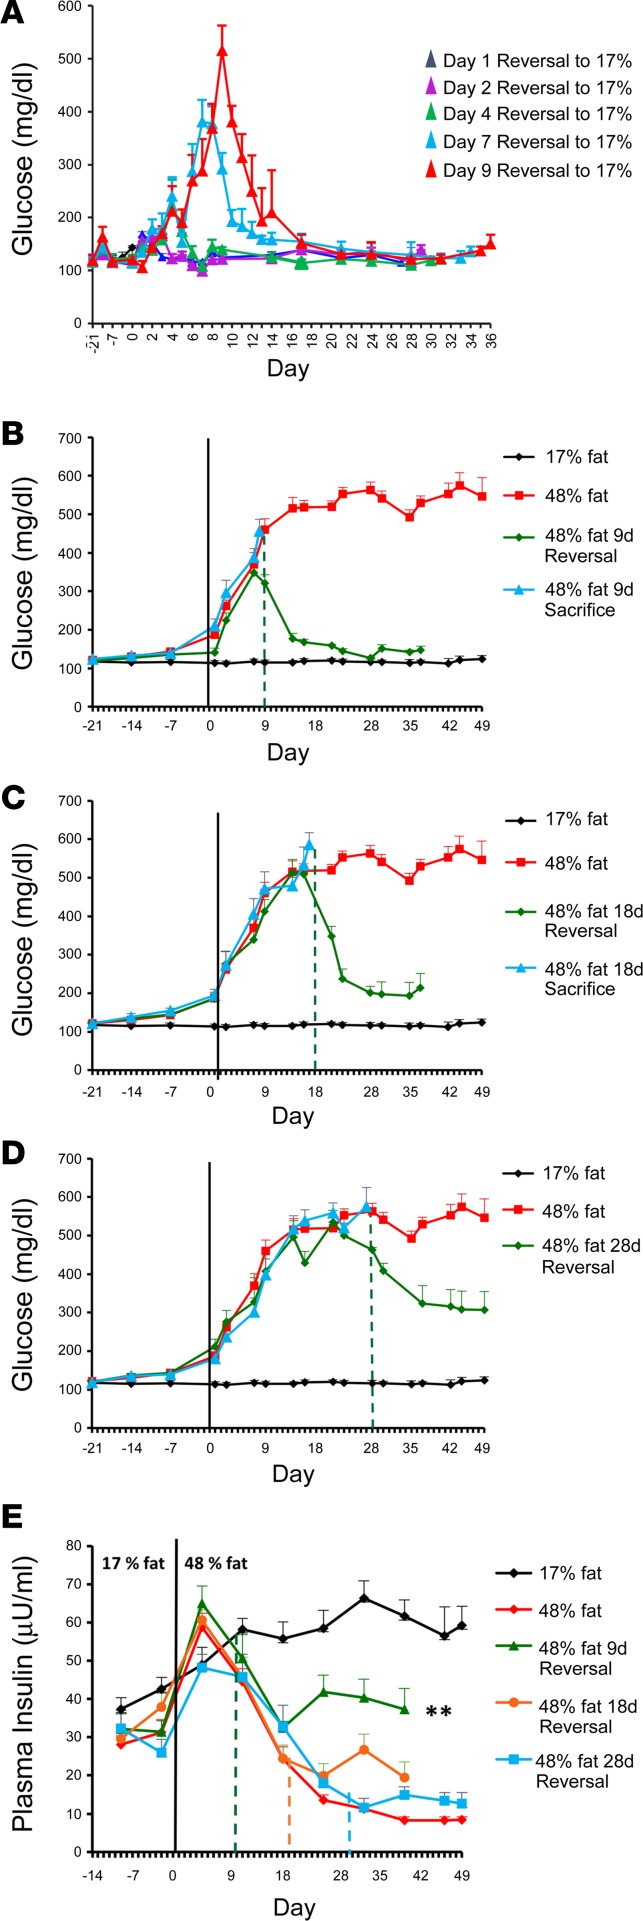
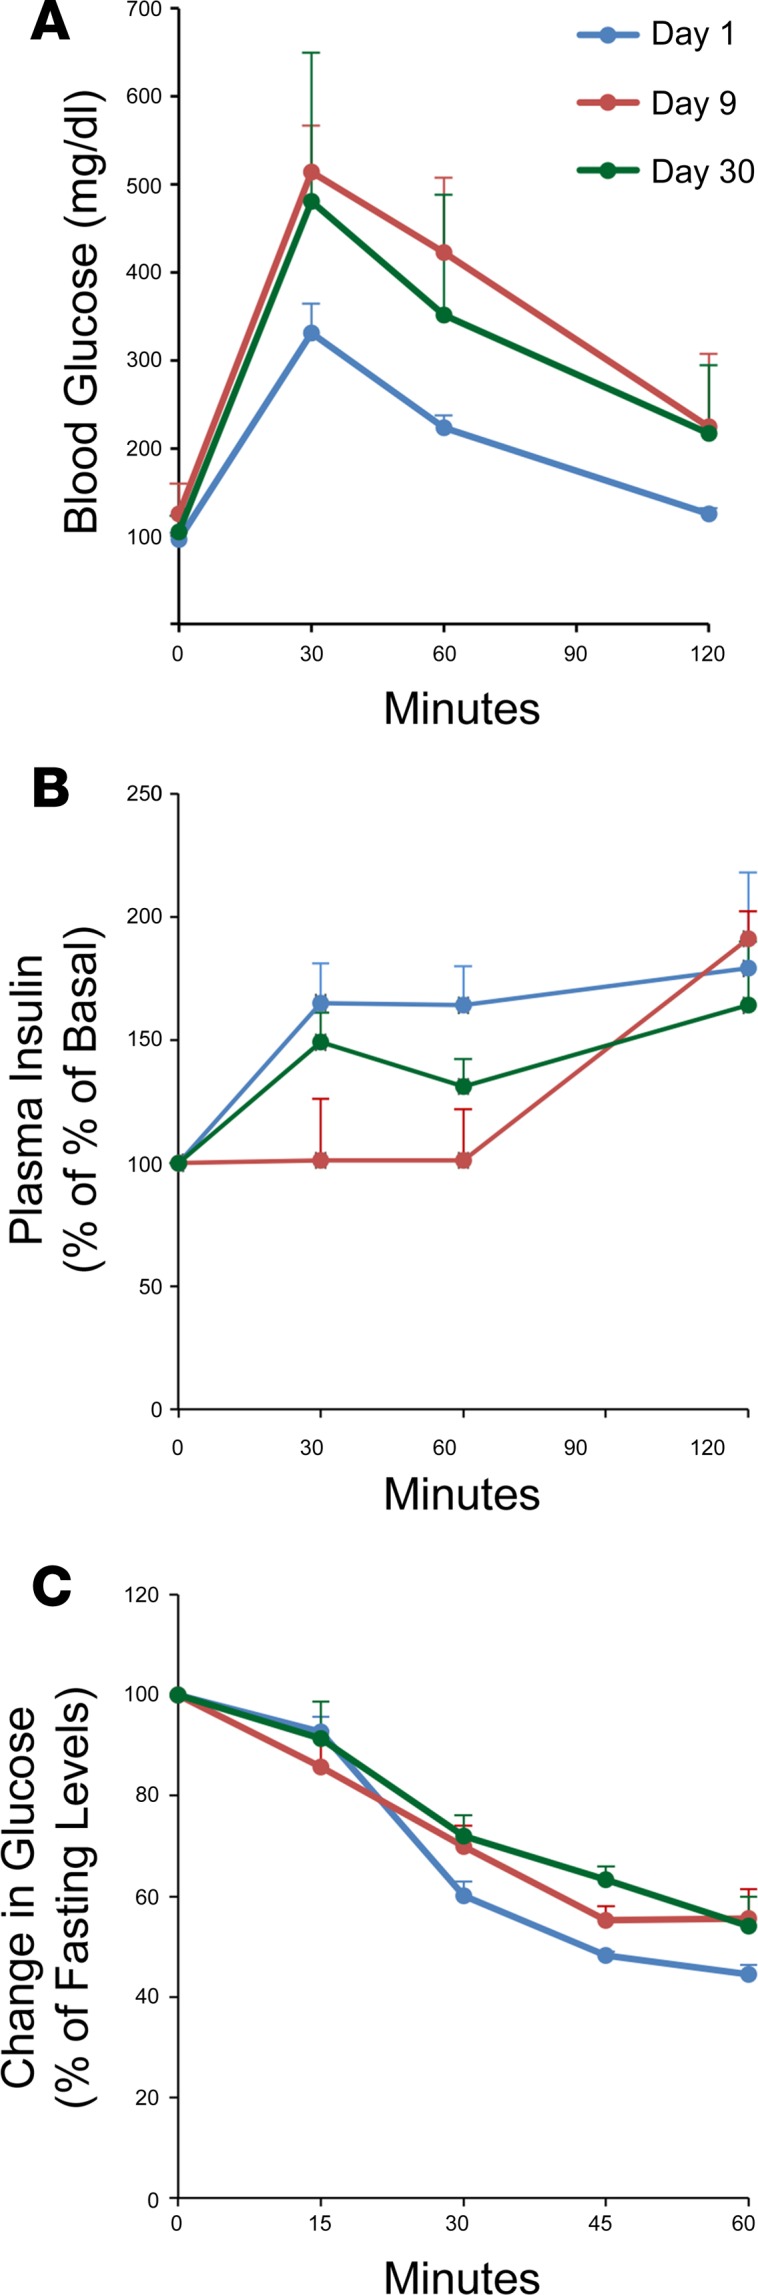
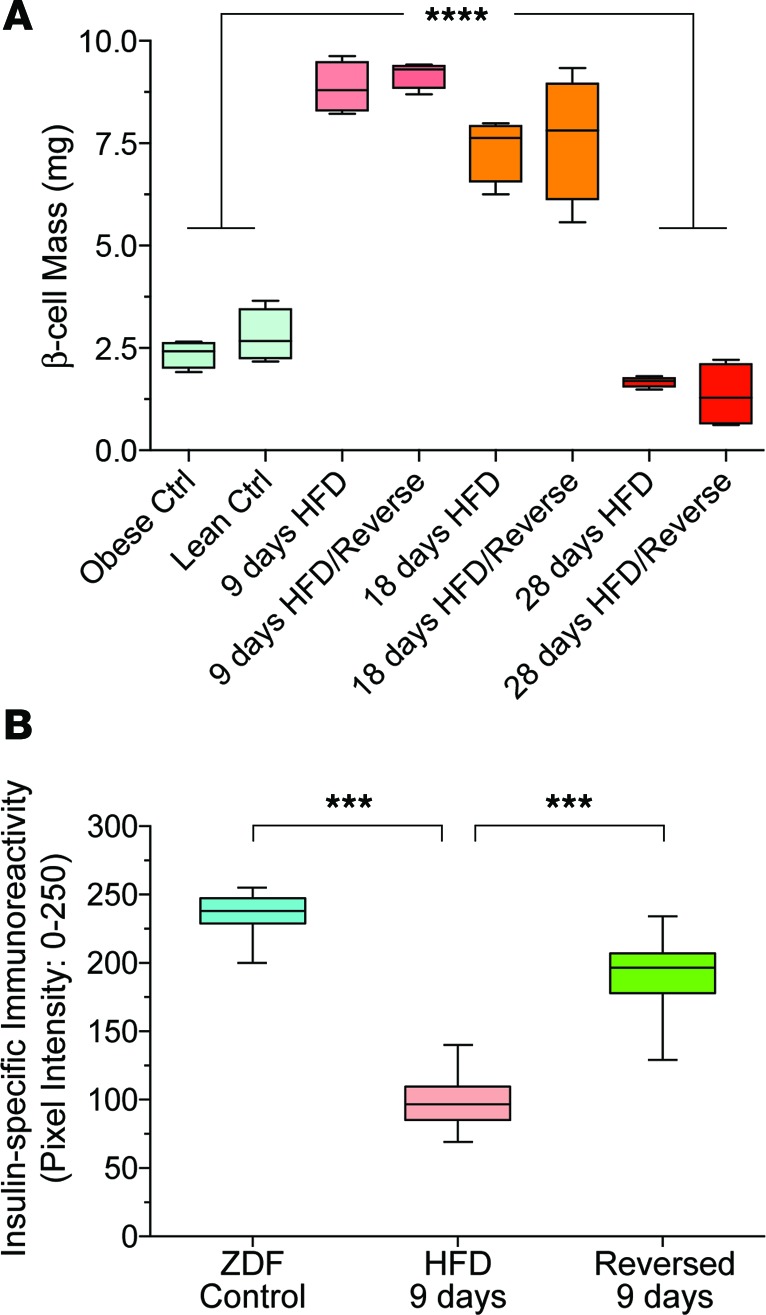
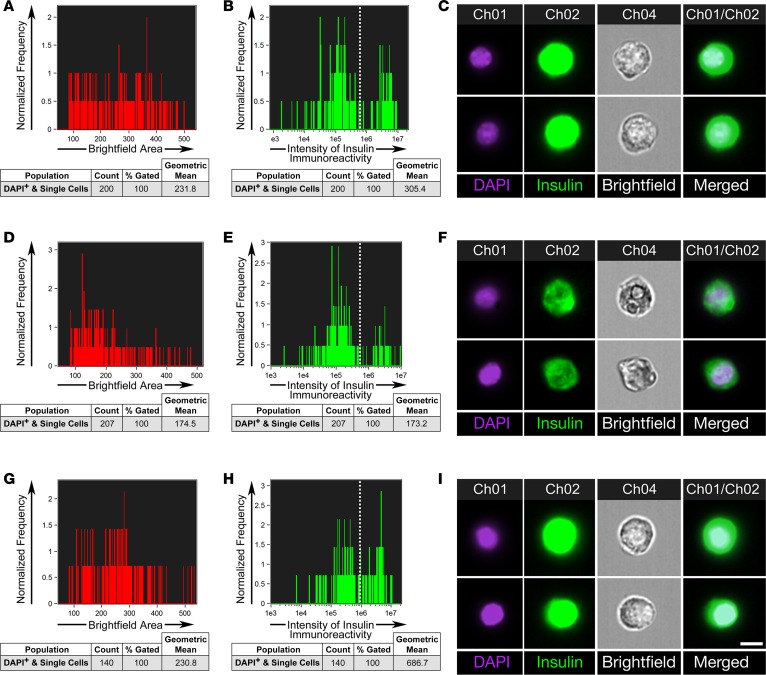
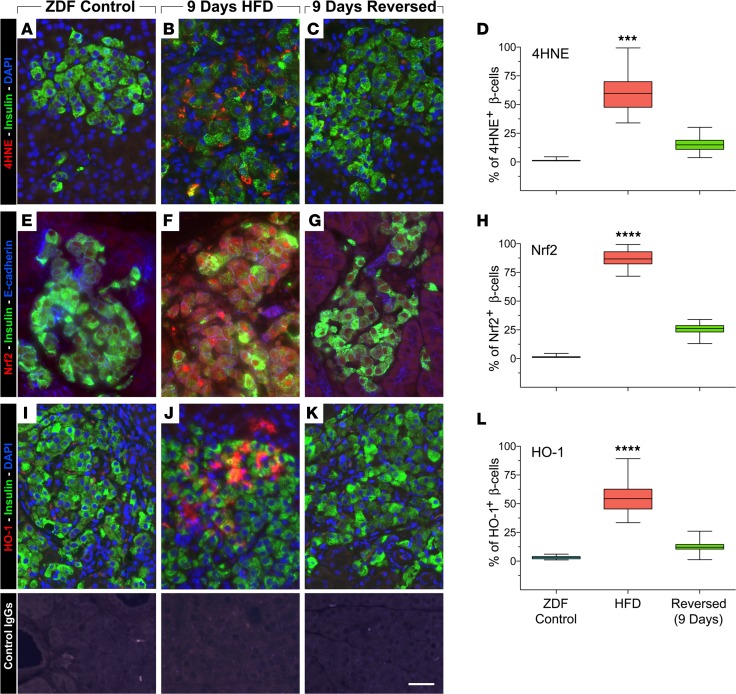
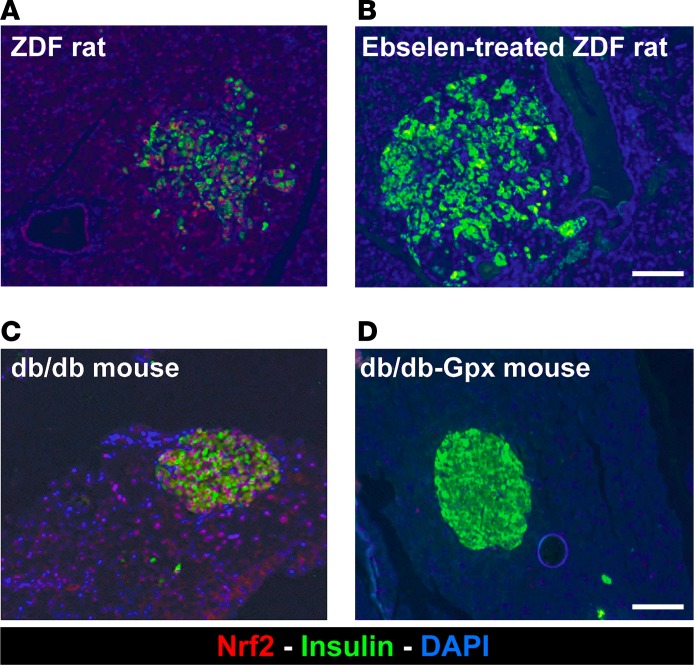
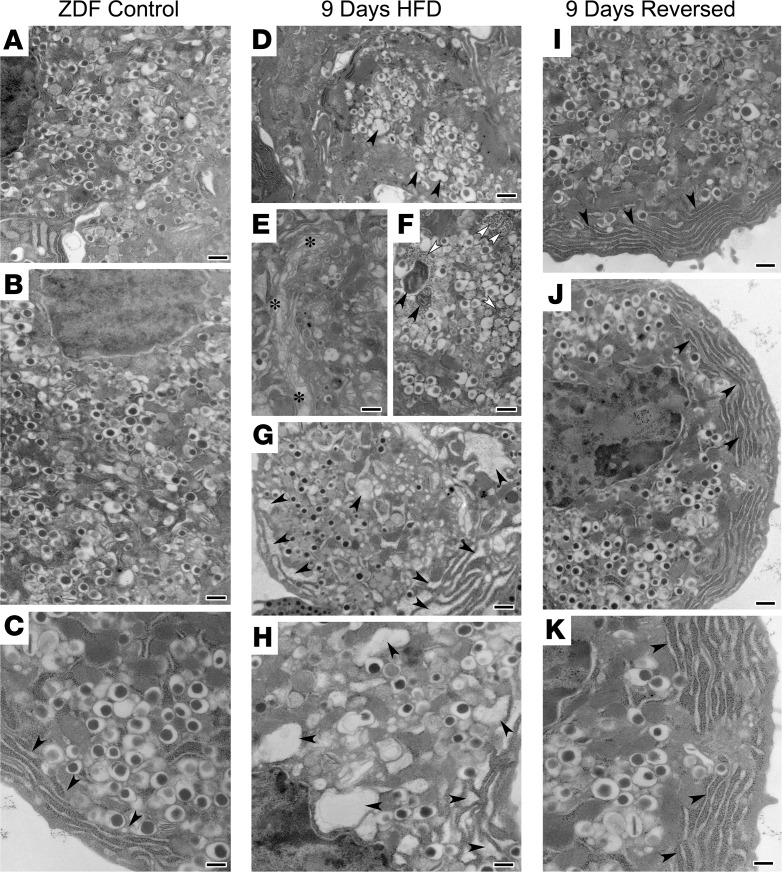
Many theories have been advanced to better understand why β cell function and structure relentlessly deteriorate during the course of type 2 diabetes (T2D). These theories include inflammation, apoptosis, replication, neogenesis, autophagy, differentiation, dedifferentiation, and decreased levels of insulin gene regulatory proteins. However, none of these have considered the possibility that endogenous self-repair of existing β cells may be an important factor. To examine this hypothesis, we conducted studies with female Zucker diabetic fatty rats fed a high-fat diet (HFD) for 1, 2, 4, 7, 9, 18, or 28 days, followed by a return to regular chow for 2-3 weeks. Repair was defined as reversal of elevated blood glucose and of inappropriately low blood insulin levels caused by a HFD, as well as reversal of structural damage visualized by imaging studies. We observed evidence of functional β cell damage after a 9-day exposure to a HFD and then repair after 2-3 weeks of being returned to normal chow (blood glucose [BG] = 348 ± 30 vs. 126 ± 3; mg/dl; days 9 vs. 23 day, P < 0.01). After 18- and 28-day exposure to a HFD, damage was more severe and repair was less evident. Insulin levels progressively diminished with 9-day exposure to a HFD; after returning to a regular diet, insulin levels rebounded toward, but did not reach, normal values. Increase in β cell mass was 4-fold after 9 days and 3-fold after 18 days, and there was no increase after 28 days of a HFD. Increases in β cell mass during a HFD were not different when comparing values before and after a return to regular diet within the 9-, 18-, or 28-day studies. No changes were observed in apoptosis or β cell replication. Formation of intracellular markers of oxidative stress, intranuclear translocation of Nrf2, and formation of intracellular antioxidant proteins indicated the participation of HFD/oxidative stress induction of the Nrf2/antioxidant pathway. Flow cytometry-based assessment of β cell volume, morphology, and insulin-specific immunoreactivity, as well as ultrastructural analysis by transmission electron microscopy, revealed that short-term exposure to a HFD produced significant changes in β cell morphology and function that are reversible after returning to regular chow. These results suggest that a possible mechanism mediating the ability of β cells to self-repair after a short-term exposure to a HFD is the activation of the Nrf2/antioxidant pathway.

Keywords: Beta cells; Cell stress; Insulin; Metabolism.


Conflict of interest statement

Conflict of interest: The authors have declared that no conflict of interest exists.

Figures

Figure 1
Figure 1. Induction of hyperglycemia by a high-fat (48%) diet followed by spontaneous return to toward normoglycemia after switching to regular (17% fat) diets.
(A–D) The durations of exposure to high-fat diets were 1, 2, 4, 7, 9, 18, and 28 days prior to a return to regular diets. The degrees of hyperglycemia were progressively worse and the returns toward normoglycemia were progressively slower as the length of exposure to high-fat diets was increased. All glucose levels were obtained under nonfasting conditions. (E) Insulin levels at the end of the studies were lowest in the ZDF rats fed 45% fat diet exclusively and highest in the animals fed 17% fat diets exclusively. Insulin levels in the 3 groups of animals fed high-fat diets for variable time periods followed by a return to regular diets had intermediate plasma insulin levels. The highest insulin levels during the return to regular diets were in animals with the shortest exposure (9 days) to the high-fat diets, while longer exposures to high-fat diet (18 and 28 days) were associated with increasingly lower insulin levels after return to low-fat diets. However, even in the 9-day reversal study, insulin levels failed to reach the levels observed in the control animals fed 17% fat standard chow diets. Two-tailed Student t tests with Bonferroni correction for multiple comparison testing; **P < 0.01.
Figure 2
Figure 2. Glucose tolerance and insulin tolerance test results.
Blue line indicates controls on regular chow; green line indicates high-fat diet (HFD) for 9 days; orange line indicates HFD for 9 days and then reversal to regular chow for 21 more days. (A and B) Glucose tolerance test (i.p., 120 minutes). (A) Glucose tolerance (i.p.) in both 9-day HFD groups (green and orange lines) deteriorated despite reversal of 1 HFD group to regular chow on day 9 through day 30. (B) Insulin levels during IPGTT were not different, although the HFD group that was reversed from HFD had a delay in developing insulin increments. (C) Insulin tolerance test (60 minutes). Glucose fell to similar levels during ITT on baseline regular diet and on a HFD, despite reversal of 1 HFD group to regular chow on day 9 through day 30. Consequently, no differences in insulin sensitivity were observed.
Figure 3
Figure 3. β Cell mass.
(A) The group receiving HFD for 9 days developed a significantly greater β cell mass compared with controls fed 17% fat standard chow. However, with longer exposure to the HFD, there were progressively smaller increases in β cell mass after 18- and 28-day HFD. Return to regular diets did not alter β cell mass in any of the 3 groups whose HFDs were reversed to regular chow diets. Reverse indicates reversal to regular diet after 9, 18, or 28 days of high-fat diet. (B) Quantitative determination of pixel intensity for insulin-specific immunofluorescent signal measured in pancreatic sections from ZDF controls, HFD 9 days, and Reversed 9 days animals. Morphometric measurements were performed on 57, 64, and 73 sections per animal group, respectively. Two-way ANOVA, ***P < 0.005; ****P < 0.0001.
Figure 4
Figure 4. ImageStream flowcytometric analysis of β cells.
Islet cells from control ZDF (A–C), HFD (D–F), and reversed ZDF animals (G–I), analyzed for their brightfield area versus DNA (DAPI) content (A, D, and G), insulin-specific immunoreactivity (B, E, and H), morphological appearance (C, F, and I). Notable differences include slight reduction in β cell size (D) and a reduced insulin-specific immunoreactivity in HFD animals (E). These alterations were not observed in the diet-reversed animal group (G and H). Representative of n = 2 separate determinations, with islets isolated from 2 animals per experimental group. Scale bar: 7 μm.
Figure 5
Figure 5. Markers of oxidative stress.
(A) Pancreatic sections were double labeled for insulin (green fluorescence) and 4-HNE (red fluorescence). ZDF rats after 9 days of high-fat diet showed intense cytoplasmic staining for 4-HNE in β cells (B). This was reduced 2 weeks after a return to regular diets (C). Percentage of 4-HNE+ β cells in each animal group (D). Immunostaining for Nrf2 (red fluorescence) revealed substantial immunoreactivity both in the cytoplasm and the nucleus of β cells in ZDF rats fed high fat diets for 9 days (F), when compared with ZDF controls (E). In contrast, 2 weeks after return to regular diets, the immunoreactivity for Nrf2 was dramatically reduced (G). Percentage of 4-Nrf2+ β cells in each animal group (H). Similarly, pancreatic sections stained for HO-1 (red fluorescence) showed increased cytoplasmic and nuclear localization of HO-1 in β cells (green fluorescence), which — after 9 days of HFD — was greatly diminished 2 weeks after return to regular diet (K). Percentage of HO-1+ β cells in each animal group (L). Specificity of detected immunoreactivities was validated by incubation of tissue sections with control IgGs from each species (lower panels). Scale bar: 25 μm. (D, H, and L) One-way ANOVA, ***P < 0.005, ****P < 0.0001.
Figure 6
Figure 6. Nrf2 staining in 2 additional diabetic animal models.
Pancreatic sections from hyperglycemic male ZDF rats showed substantial immunostaining for Nrf2 (A, red fluorescence), in β cells (green fluorescence), whereas ZDF rats fed with the antioxidant Ebselen along with the high-fat diet for 6 weeks did not stain for Nrf2 (B). (C) Hyperglycemic WT db/db mice fed a high-fat diet showed increased immunoreactivity for Nrf2 in β cells, whereas db/db mice with β cell–specific overexpression of GPx-1 fed a high-fat diet showed no detectable staining for Nrf2 (D). Scale bars: 50 μm.
Figure 7
Figure 7. Ultrastructural analysis of β cells by transmission electron microscopy (TEM).
Examples of β cells from control ZDF (A–C), HFD (D–H), and diet-reversed ZDF animals (I–K). β Cells in control ZDF rats exhibit normal-looking distribution of secretory granules with the classical electron-dense crystallized insulin cores and normal rough endoplasmic reticulum (RER) (C, arrowheads). Marked alterations can be noted in β cells from animals fed with HFD, including dysmorphic secretory vesicles (D, arrowheads), disorganized Golgi apparatus (E, asterisks), numerous autophagic bodies (F, black arrowheads), increased cytosolic free ribosomes (F, white arrowheads), and substantial enlarged ER cisternae (G and H, arrowheads). These alterations were not found in β cells from diet-reversed animals, which exhibited normalized insulin granule distribution and well-organized ER (I–K, arrowheads). TEM analysis was performed on islets isolated from each experimental group (n = 2 animals per group). Images acquired from at least n = 20 nonconsecutive ultrathin sections per experimental group. Representative of n = 3 separate determinations. Scale bars: 300 nm (A, B, D–G, I, and J) and 70 nm (C, H, K).

References

    1. Imai Y, et al. Interaction between cytokines and inflammatory cells in islet dysfunction, insulin resistance and vascular disease. Diabetes Obes Metab. 2013;15 Suppl 3:117–129. - PMC - PubMed
    1. Santin I, Eizirik DL. Candidate genes for type 1 diabetes modulate pancreatic islet inflammation and β-cell apoptosis. Diabetes Obes Metab. 2013;15 Suppl 3:71–81. - PubMed
    1. Donath MY. Targeting inflammation in the treatment of type 2 diabetes. Diabetes Obes Metab. 2013;15 Suppl 3:193–196. - PubMed
    1. Khadija S, Veluthakal R, Sidarala V, Kowluru A. Glucotoxic and diabetic conditions induce caspase 6-mediated degradation of nuclear lamin A in human islets, rodent islets and INS-1 832/13 cells. Apoptosis. 2014;19(12):1691–1701. doi: 10.1007/s10495-014-1038-4. - DOI - PMC - PubMed
    1. Cnop M, Welsh N, Jonas JC, Jörns A, Lenzen S, Eizirik DL. Mechanisms of pancreatic beta-cell death in type 1 and type 2 diabetes: many differences, few similarities. Diabetes. 2005;54 Suppl 2:S97–107. - PubMed

Publication types

MeSH terms