. 2017 Dec 20;8(1):2210.
doi: 10.1038/s41467-017-02373-8.

Polarized actin and VE-cadherin dynamics regulate junctional remodelling and cell migration during sprouting angiogenesis

Affiliations

Polarized actin and VE-cadherin dynamics regulate junctional remodelling and cell migration during sprouting angiogenesis

Jiahui Cao et al. Nat Commun. .

Abstract

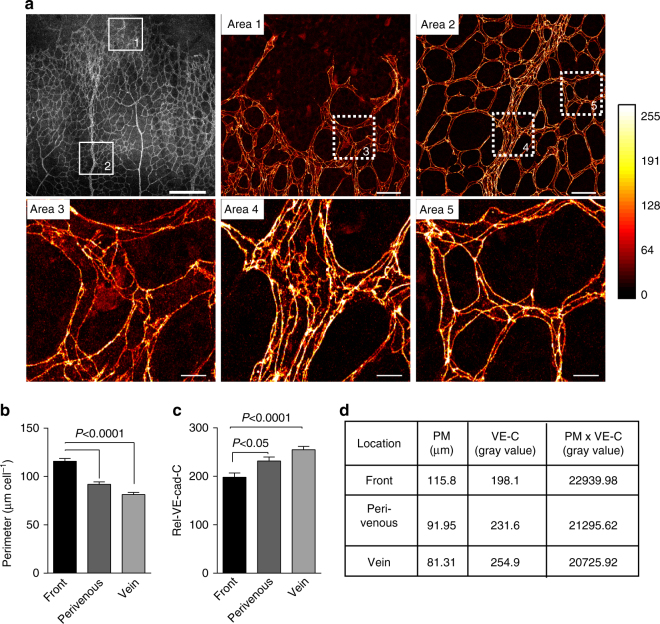
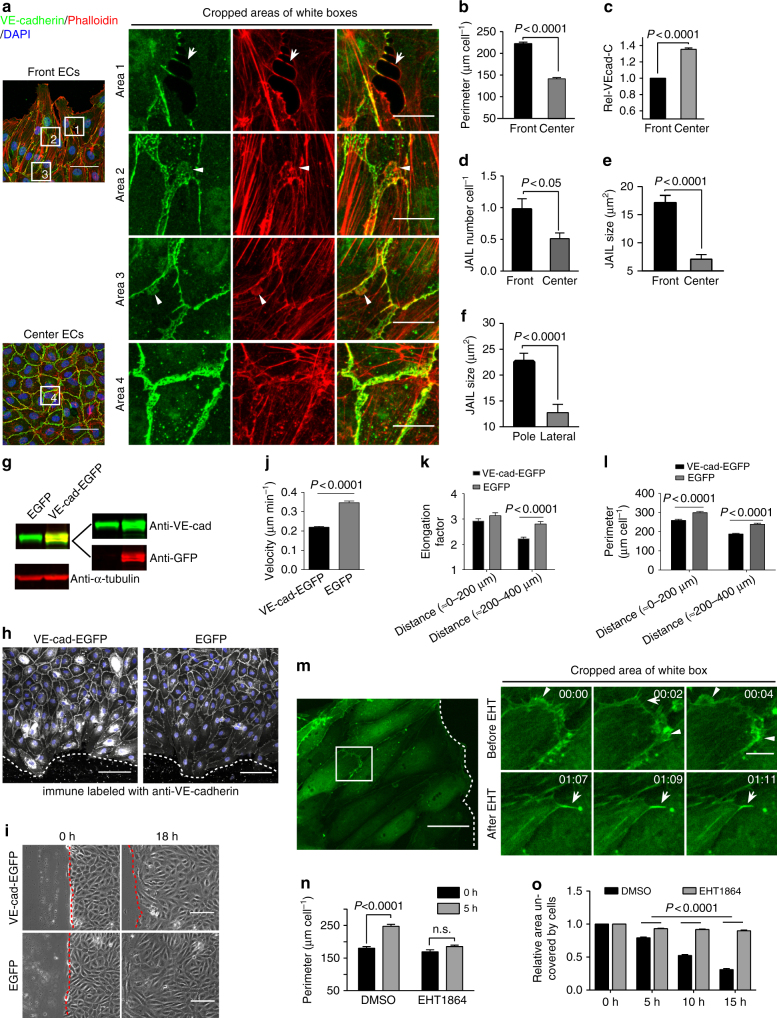
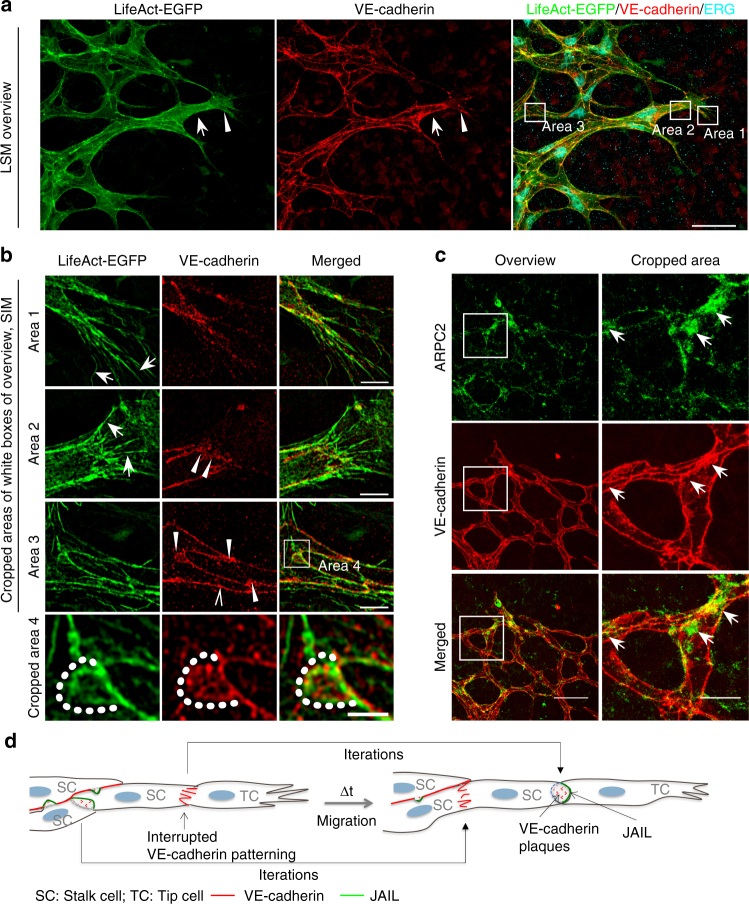
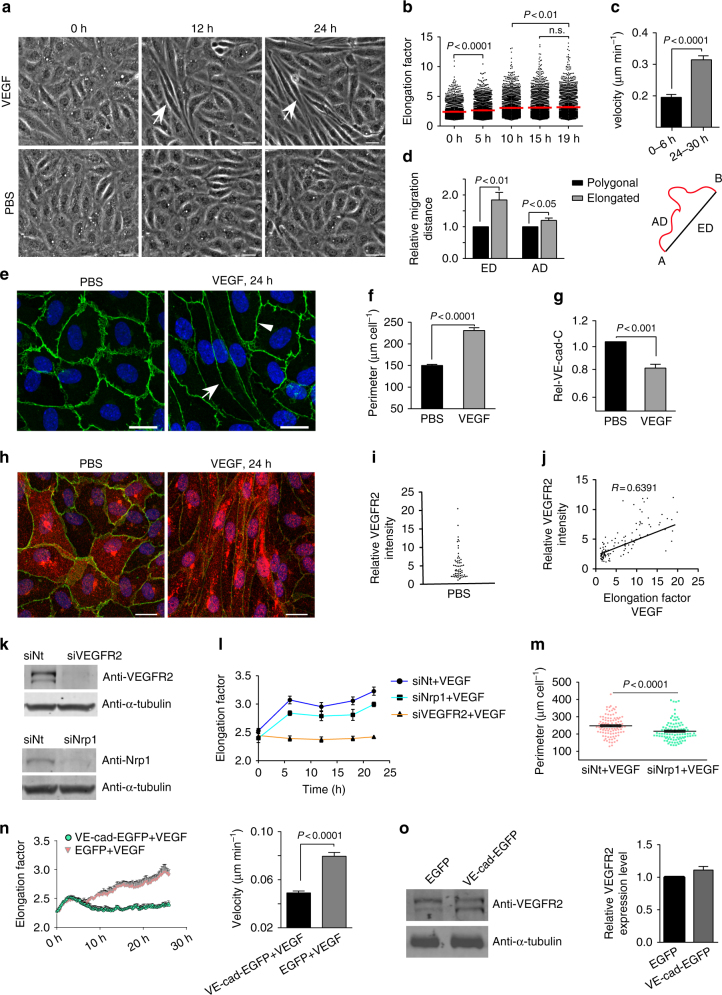
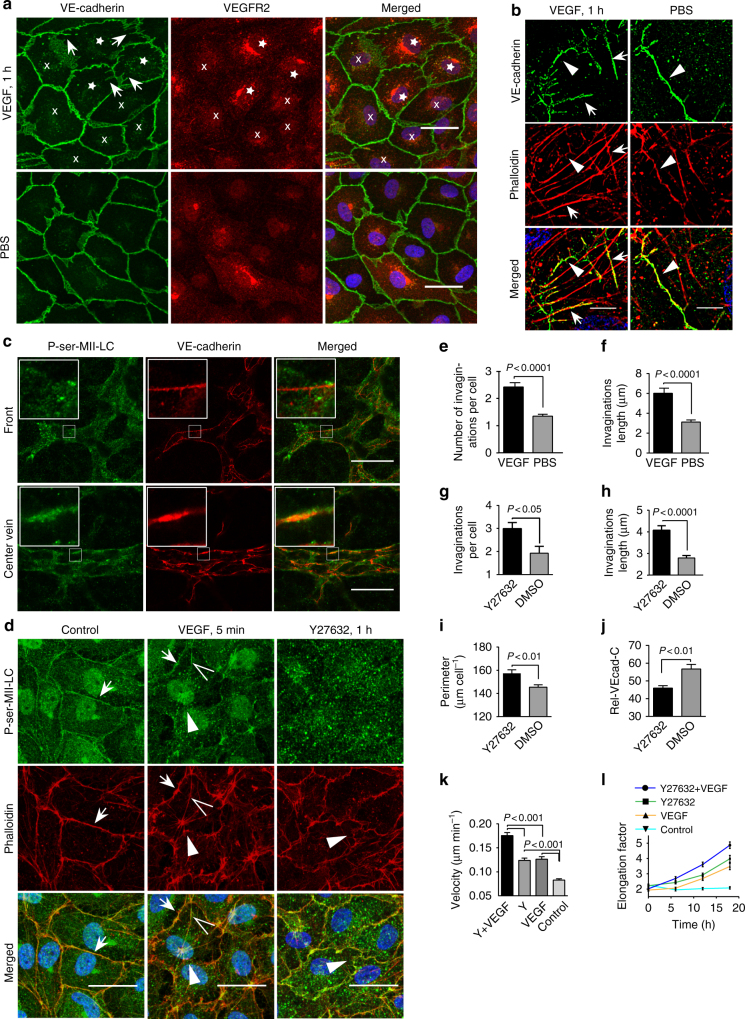
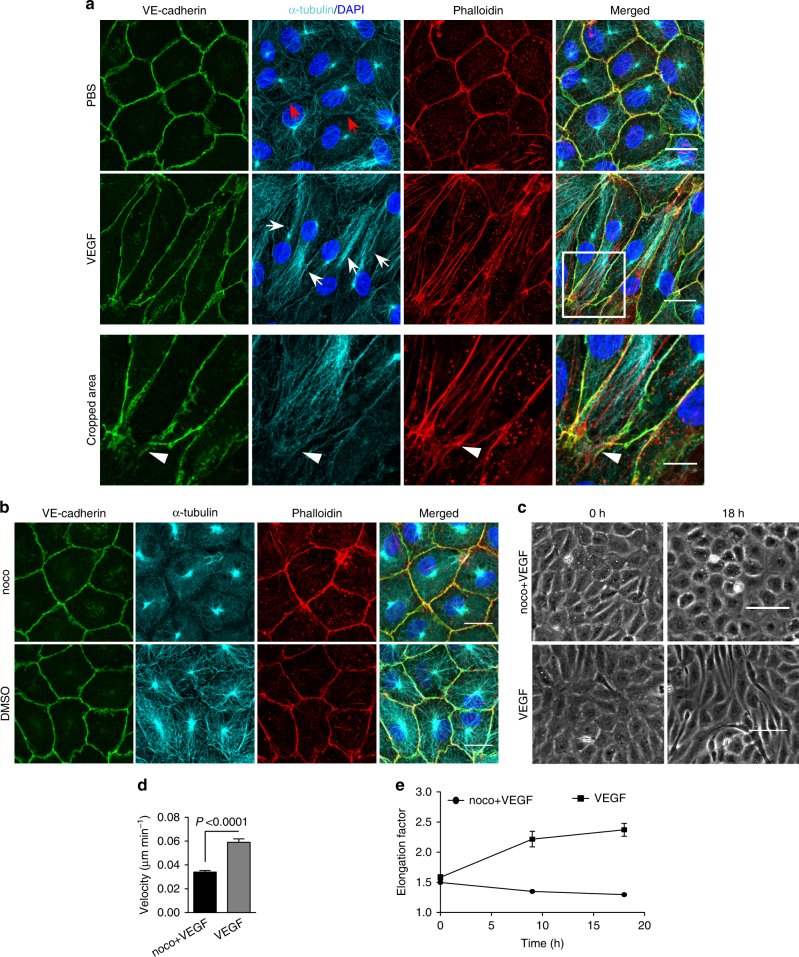
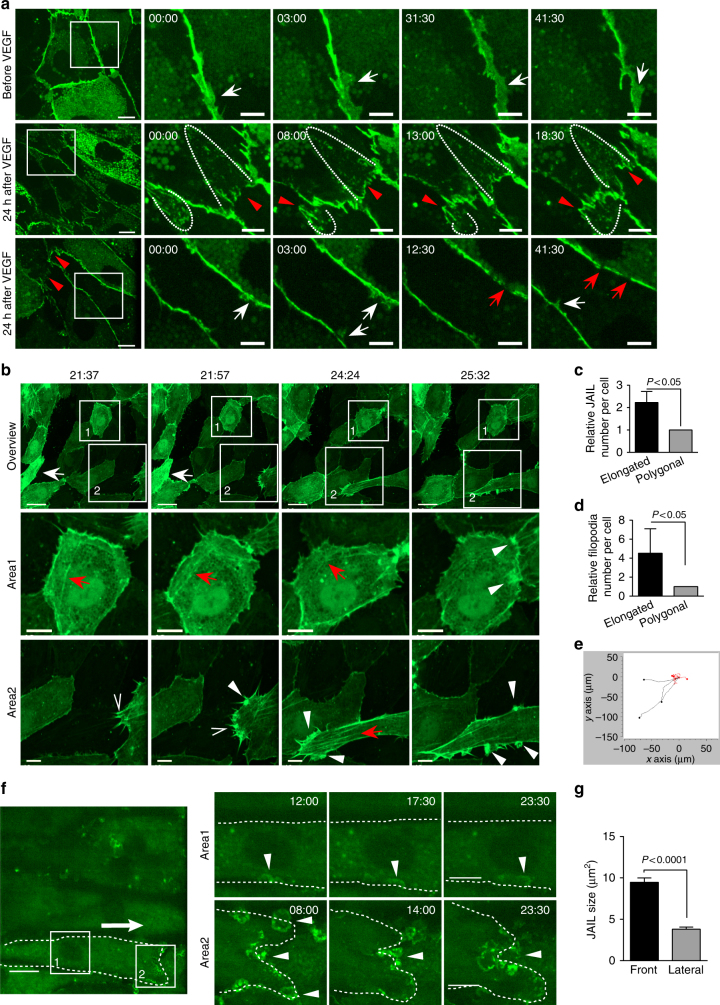
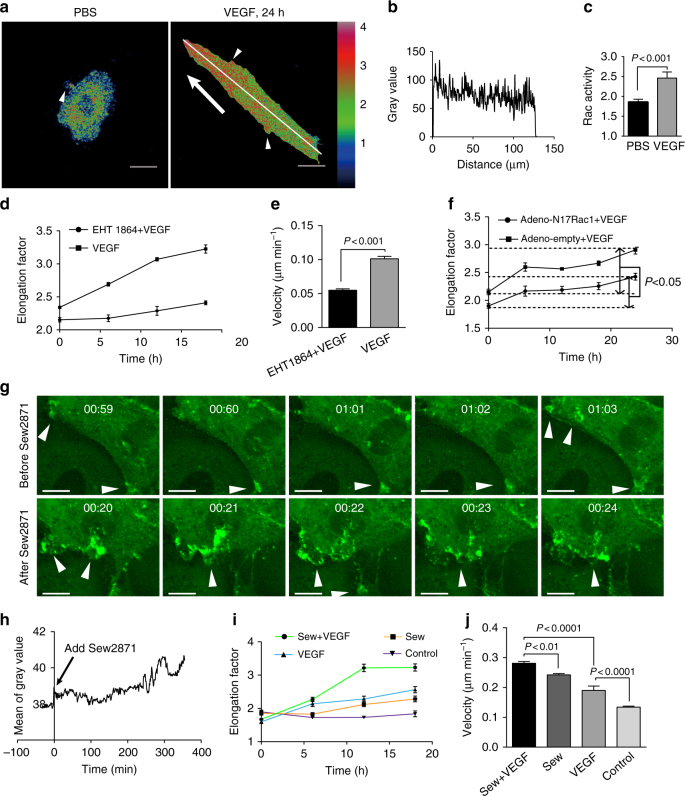
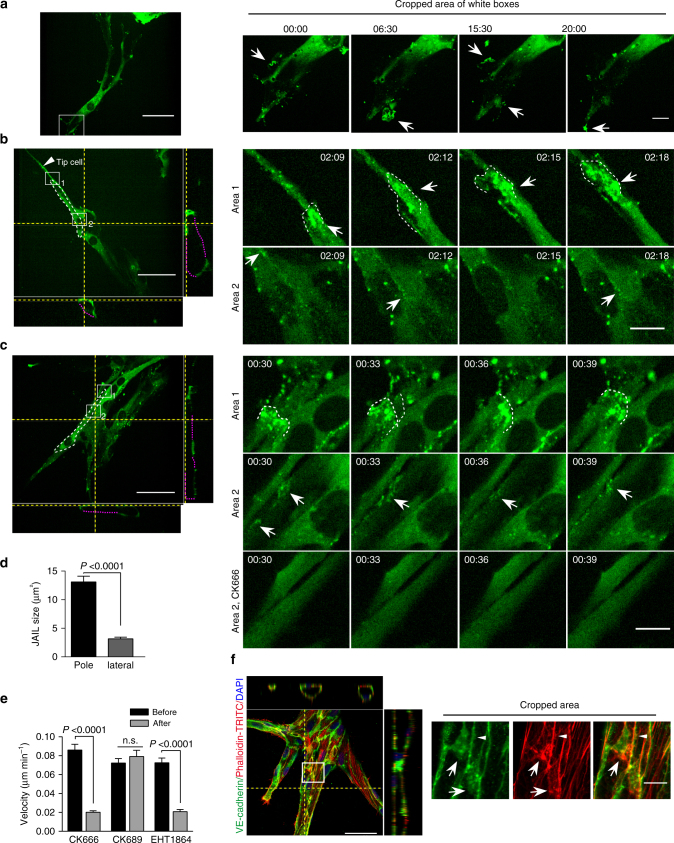
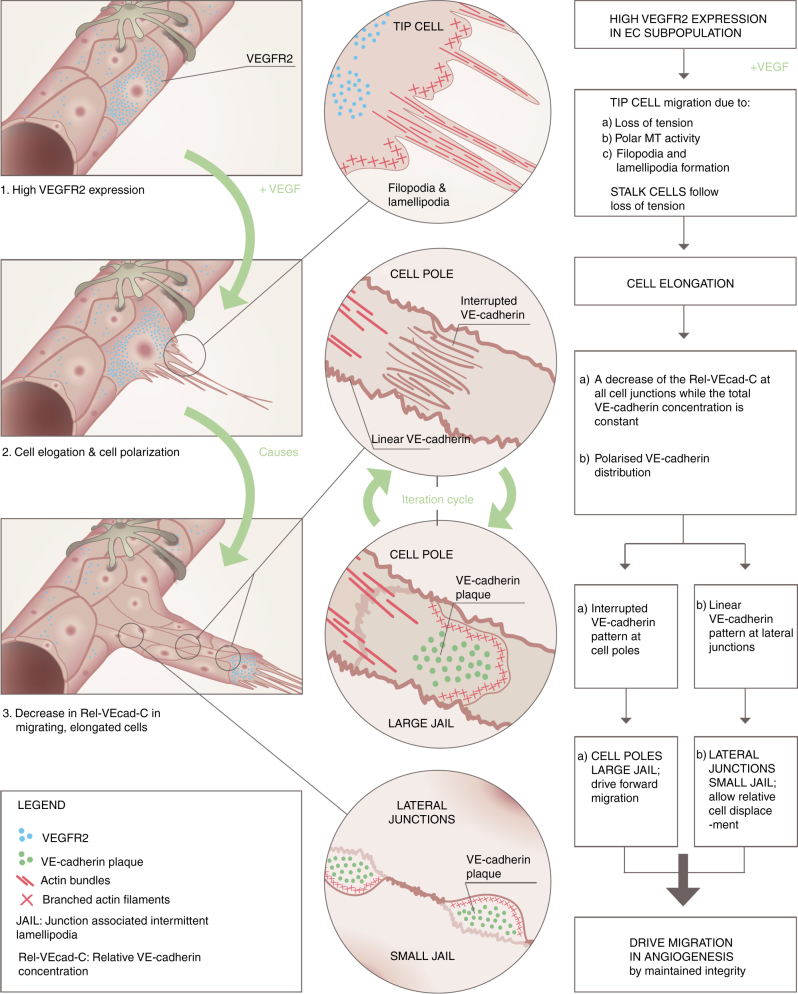
VEGFR-2/Notch signalling regulates angiogenesis in part by driving the remodelling of endothelial cell junctions and by inducing cell migration. Here, we show that VEGF-induced polarized cell elongation increases cell perimeter and decreases the relative VE-cadherin concentration at junctions, triggering polarized formation of actin-driven junction-associated intermittent lamellipodia (JAIL) under control of the WASP/WAVE/ARP2/3 complex. JAIL allow formation of new VE-cadherin adhesion sites that are critical for cell migration and monolayer integrity. Whereas at the leading edge of the cell, large JAIL drive cell migration with supportive contraction, lateral junctions show small JAIL that allow relative cell movement. VEGFR-2 activation initiates cell elongation through dephosphorylation of junctional myosin light chain II, which leads to a local loss of tension to induce JAIL-mediated junctional remodelling. These events require both microtubules and polarized Rac activity. Together, we propose a model where polarized JAIL formation drives directed cell migration and junctional remodelling during sprouting angiogenesis.


Conflict of interest statement

The authors declare no competing financial interests.

Figures

Fig. 1
Fig. 1
Migrating front ECs in developing retinas demonstrate an increased perimeter and a reduced Rel-VEcad-C. a Representative heat-map images of VE-cadherin-labelled ECs in front and centre areas of whole-mounted P6 mouse retinas. Area 1 and Area 2 (scale bar: 40 µm), depicted as indicated, display higher magnifications of the angiogenic front and centre vein area, respectively. Area 3 to Area 5 (scale bar: 20 µm) correspond to the dotted white boxes in Area 1 and 2, respectively. b, c Quantification of cell perimeter and Rel-VEcad-C in angiogenic front, perivenous plexus in the centre, and vein ECs. Three independent experiments with n cells (n = 88, 101, and 106) were used for cell perimeter quantification and (n = 54, 58, and 75) for Rel-VEcad-C. d Estimation of the total VE-cadherin amount in ECs was performed by multiplying the mean cell perimeter by the mean Rel-VEcad-C. One-way ANOVA was used to analyse the significance difference. Error bars represent ± SEM. PM perimeter, VE-C Rel-VEcad-C
Fig. 2
Fig. 2
JAIL formation and cell migration are blocked by Rac inhibition and VE-cadherin overexpression in scratch assay. af HUVECs were scratched, allowed to grow for 5 h, and labelled for VE-cadherin and Phalloidin-TRITC. a Overviews of the migrating front (left upper) and centre area (left lower). (Area 1) interrupted VE-cadherin that co-localise with filopodia-like actin filaments (arrows). (Area 2) Large JAIL (arrowheads) at cell pole. (Area 3) small JAIL (arrowheads) at lateral junctions. (Area 4) Polygonal cells in the centre area. Scale bars represent 60 µm and 15 µm in the overview and cropped images respectively. b, c Comparison of cell perimeter and Rel-VEcad-C in front and centre ECs. Quantification of (d) JAIL number and (e) JAIL size in front (n = 115 cells) and centre cells (n = 186 cells). f JAIL size at cell poles and lateral junctions in front ECs (n = 115 cells). P value was determined by unpaired student’s t test. g Western blot demonstrates VE-cadherin-EGFP overexpression by a factor of about 4 using VE-cadherin (green) and EGFP (red) antibodies. h VE-cadherin was immune labelled in VE-cadherin-EGFP-overexpressing and EGFP-expressing cells; nuclei were stained blue with DAPI. Scale bar: 100 µm. i Representative images of VE-cadherin-EGFP-overexpressing and EGFP-expressing cells in a scratch assay. Red dotted lines indicate wound margins. Scale bar: 150 µm. j Quantification of migration velocity 18.5 h after the scratch (n = 83 and 85 cells, respectively, unpaired student’s t test). k, l Quantification of elongation factor and cell perimeter using CBT based on immunofluorescence images [n = 176 and 205 cells for VE-cadherin-EGFP-transfected HUVECs, and n = 139 and 165 cells for EGFP-expressing HUVECs at distance (≈ 0–200) and (≈ 200–400) in the scratch area, two-way ANOVA]. m Time-lapse series of HUVECs expressing LifeAct-EGFP after scratching. (Left) Overview image (scale bar: 50 µm) indicates the scratch front (dotted line) and the white box represents the cropped area. JAIL formation (arrowheads) in the same cells was blocked by EHT1864, while filopodia still developed (arrows). Time scale: hh:mm, scale bar: 10 µm. Live-cell imaging-based analyses of (n) cell perimeter (front to 200 µm, n = 50 cells) and (o) wound closure (n = 3) (two-way ANOVA). Representative results from three independent experiments were shown. Error bars represent ± SEM. VE-cad-EGFP VE-cadherin-EGFP
Fig. 3
Fig. 3
Polarized distribution of VE-cadherin and actin in sprouting ECs in developing mice retinas. a Laser scanning microscopy (LSM) showing an overview of the front area of a whole-mounted P6 transgenic mouse retina expressing LifeAct-EGFP additionally immune stained with anti-VE-cadherin and anti-ERG antibodies; nuclei were stained with anti-ERG. Tip cell (arrowheads) and adjacent stalk cell (arrows) are indicated. Scale bar: 40 µm. b High-resolution SIM of selected areas 1–3, as indicated in the right panel of a. Shown is one z-plane. (Area 1) a characteristic tip cell with large actin-based filopodia and a cytosolic spotted VE-cadherin pattern. (Area 2) A tip cell/stalk cell junction at the cell pole of elongated cells identifies terminating actin filaments (arrow) and an interrupted VE-cadherin pattern (arrowhead). (Area 3) a stalk cell/stalk cell connection. VE-cadherin plaques are indicated at the cell poles (arrowheads) and a linear VE-cadherin pattern (empty arrowhead) at lateral junctions; parallel actin filaments are also visible. Scale bar: 5 µm. (Area 4) The cropped area depicts an actin-positive JAIL (dotted line, LifeAct-EGFP) with VE-cadherin plaques (dotted line, VE-cadherin staining). Scale bar: 2 µm. c P7 rat retina immune labelled with ARPC2 and VE-cadherin show increased ARPC2 at the cell poles (arrows). Scale bars in the left panels and right panels represent 50 and 15 µm, respectively. d Scheme illustrates the iterative dynamics of VE-cadherin interruption and JAIL formation leading to VE-cadherin plaques in sprouting ECs. The VE-cadherin dynamics was particularly pronounced at the cell poles, while the lateral junctions showed moderate dynamics
Fig. 4
Fig. 4
VEGFR2 and VE-cadherin expression control VEGF-induced EC elongation and migration. Confluent HUVECs were treated with 50 ng ml−1 VEGF or PBS. a Time-lapse images show cell elongation (arrows) in a subpopulation of HUVECs (Scale bar: 30 µm). b PhaCoB Cell Tracker analysis of cell elongation 5 h after VEGF (n = 3070 cells, one-way ANOVA). c VEGF-dependent cell velocity in the first 6 h (n = 71 cells) and after 24 h (n = 77 cells). d Elongated cells displayed increased 'Euclidean distance' (ED) and 'Accumulated distance' (AD) comparison to polygonal cells in the same VEGF-treated culture (n = 30 cells from t = 24–30 h, two-way ANOVA). e Anti-VE-cadherin-labelled HUVEC cultures. Rel-VEcad-C was decreased in a subpopulation of elongated cells (arrow) but not in polygonal cells (arrowhead) (scale bar: 20 µm). Quantification of (f) cell perimeter and (g) Rel-VEcad-C based on immunofluorescent labelling using the CBT. h HUVECs were stained with VE-cadherin (green) and VEGFR2 (red) (scale bar: 20 µm). i Quantitative distribution of the relative VEGFR2 intensity under PBS (n = 59 cells). j Correlation of relative VEGFR2 intensity with elongation factor in VEGF-treated HUVEC; n = 146 cells; R = correlation coefficient. k Western blot demonstrates downregulation of VEGFR2 and Nrp1 by the respective siRNAs but not non-targeting siRNA (siNt). l VEGFR2 downregulation totally blocked VEGF-induced cell elongation as determined by PhaCoB Cell Tracker, whereas Nrp1 downregulation had only a minor effect (n ≈ 3500/time point), compare Supplementary Movie 6. m A small but statistically significant decrease in the perimeter in Nrp1-downregulated cells quantified based on VE-cadherin-labelling using CBT (n = 100 cells). n (left) VE-cadherin-EGFP overexpression blocked the VEGF-induced elongation as analysed by PhaCoB Cell Tracker (n ≈ 1100 cells/time point). (right) Determination migration velocity of VE-cadherin-EGFP (n = 100 cells) and EGFP (n = 101 cells) overexpressing HUVEC in the presence of VEGF for 24 h. Compare supplementary movie 7. o (left) Western blot of VEGFR2 expression after VE-cadherin-EGFP overexpression. (right) Quantification of VEGFR2 expression in VE-cadherin overexpressing cells (n = 3). α-tubulin served as an internal loading control. Unpaired student’s t test was used to analyse the significance difference for experiment c, f, g, m, n, o. Error bars represent ± SEM. Representative results from three independent experiments are shown
Fig. 5
Fig. 5
VEGF-induced shape change is accompanied by dephosphorylation of myosin II light chain at the junction. a LSM of VE-cadherin and VEGFR2 in HUVECs treated with 50 ng ml−1 VEGF or PBS. VEGF-induced invaginations (arrows) were mostly found in cells with high VEGFR2 intensity (stars) but not in less VEGFR2-expressing cells (crosses). b SIM of VE-cadherin- and Phalloidin-TRITC-labelled HUVECs after VEGF demonstrates that VE-cadherin invaginations largely co-localise with actin filaments (arrows). VE-cadherin and actin at cell junctions (arrowheads). c LSM of phospho (ser19)-myosin II light chain (P-ser-MII-LC) and VE-cadherin in P6 mice retina. P-ser-MII-LC was largely seen in the junction of centre vein but not in front ECs. d HUVECs treated with 50 ng ml−1 VEGF and 10 µM Y27632, respectively, were immune labelled with P-ser-MII-LC and Phalloidin-TRITC. VEGF induced a partial loss of P-ser-MII-LC at junctions accompanied by a partial loss of JAAF (arrowhead) and wave-like junction remodelling. Stress fibres (open arrowheads) were P-ser-MII-LC positive. Arrows indicates intact JAAF. Y27632 treatment caused a total loss of P-ser-MII-LC and also induced wave-like junction remodelling. Quantification of e number (n = 411 VE-cadherin invagination for 305 cells for PBS, 815 VE-cadherin invaginations for 338 cells for VEGF) and f length of VE-cadherin invaginations in VEGF- (n = 98 VE-cadherin invaginations) and PBS-treated (n = 92 VE-cadherin invagination) cells. Quantification of (g) VE-cadherin-positive invaginations (n = 422 and 280 VE-cadherin invaginations for 143 Y27632 and DMSO treated cells respectively), (h) invagination length (n = 227 and 232 VE-cadherin invaginations for Y27632 and DMSO separately), (i) cell perimeter, and j Rel-VEcad-C in Y27632-treated cells for 1 h or DMSO based on VE-cadherin immune labelling (n = 143 cells); (compare Supplementary Fig. 5b). Unpaired student’s t test was used for (ej). k, l HUVECs pre-treated with 10 µM Y27632 for 1 h were applied with VEGF for another 18 h. Quantification of (k) migration velocity (n = 100 cells) and (i) elongation factor (87, 97, 87 and 87 cells were used for Y27632+VEGF, Y27632, VEGF, and control, respectively) using Fiji (compare Supplementary Fig. 5c); one-way ANOVA. Y = Y27632. Error bars indicate ± SEM. Scale bars represent 30 µm in a, c, d and 5 µm in b
Fig. 6
Fig. 6
Microtubules (MT) are indispensable for VEGF-induced cell elongation. a Confluent HUVECs immune labelled for VE-cadherin, α-tubulin and Phalloidin-TRITC after VEGF treatment for 24 h or PBS for control, as indicated. Nuclei are stained blue with DAPI. LSM demonstrates MT in control cells evenly distributed throughout the cells, while a few MT are aligned in parallel with JAAF (red arrows). VEGF-induced elongated cells display MT running parallel to the longitudinal cell axis together with stress fibres, and MT are enriched at the leading edge (white arrows; for dynamics compare supplementary Movie 10) (Scale bar: 20 µm). The cropped area displays an interrupted VE-cadherin pattern, MT enrichment, and stress fibres at the cell poles (arrowheads; for dynamics compare Supplementary Movies 10 and 11) (scale bar: 10 µm). b Confluent HUVEC cultures treated with 50 ng ml−1 nocodazole for 4 h and subsequently labelled with VE-cadherin antibody and with Phallodin-TRITC for actin filaments. MT depolymerisation had less effect on the JAAF and VE-cadherin distribution (Scale bar: 20 µm). ce Confluent HUVECs pre-treated with 50 ng ml−1 nocodazole for 30 min and then treated with VEGF for another 18 h. c Phase-contrast microscopy revealed that nocodazole inhibited VEGF-induced cell elongation (scale bar: 80 µm). Quantification of (d) cell velocity and (e) cell elongation using Fiji software (100 cells were analysed at t = 0, 100 cells at t = 9 h, 81 cells at t = 18 h for nocodazole+VEGF treatment; and 100 cells were analysed at each time point for VEGF treatment, unpaired student’s t test). noco: nocodazole. Representative results from three independent experiments are shown. Error bars indicate ± SEM
Fig. 7
Fig. 7
Junction dynamics upon VEGF treatment in confluent HUVECs. HUVECs expressing (a) VE-cadherin-EGFP (be) LifeAct-EGFP or (fg) EGFP-p20, respectively, were treated with 50 ng ml−1 VEGF. a (upper) Controls display regular VE-cadherin-EGFP dynamics with VE-cadherin plaques (white arrows) due to JAIL formation. (middle) After VEGF treatment, elongated cells exhibit a polar distribution with an interrupted VE-cadherin pattern at cell poles (red arrowheads) followed by transient formation of new large VE-cadherin plaques (dotted lines). (lower) Lateral junctions display linear VE-cadherin pattern with appearance of small VE-cadherin plaques (white arrows). Small VE-cadherin interruptions (red arrows) appear transiently. Time scale: mm:ss; scale bars indicate 10 and 5 µm in the overview and cropped images. b LifeAct-EGFP dynamics after VEGF. (upper) The overview images demonstrate both polygonal cells and elongated cells (white arrows) (scale bar: 30 µm). (Area 1) Polygonal cells display constitutive junction remodelling that includes the transient appearance of small stress fibres (red arrows) and small JAIL (white arrowheads) without significant cell elongation. (Area 2) A progressively moving elongated cell exhibits many filopodia (empty arrowheads) that appear on the sides of large JAIL (white arrowheads). Note: stress fibres (red arrows) preferentially emerge at the leading edge of the cells. Time scale: hh:mm; scale bar: 10 µm. c, d JAIL and filopodia number in polygonal and elongated cells in VEGF-treated culture. e Track plots illustrate migration path of elongated cells (black line) and polygonal cells (red line). f Small JAIL formation at the lateral junctions (cropped area 1, arrowheads) and large JAIL development at the cell poles (cropped area 2, arrowheads) in VEGF-induced elongated ECs expressing EGFP-p20. The dotted line indicates the cell border; arrow indicates the direction of cell movement. Time scale, mm:ss; scale bar represent 20 and 10 µm in overview and cropped images. g JAIL size at the cell poles and the lateral sides of elongated cells induced by VEGF. 157 JAIL at the cell pole and 152 JAIL at the lateral junctions from three independent experiments were analysed over a period of time (30 min). Unpaired student’s t test was used for statistics analysis and error bars indicate ± SEM
Fig. 8
Fig. 8
Polarized Rac activity is required for VEGF-induced cell elongation and migration. a–c Confluent HUVECs expressing FRET sensor Raichu-Rac1 were treated with VEGF for 24 h. a Representative images showing different levels of Rac1 activity within control cells and VEGF-induced elongated cells. Control cells displayed less and randomised Rac1 activity (arrowhead; compare Supplementary Movie 13). Polarized, higher Rac1 activity is observed at the leading front (arrow indicates migration direction; compare Supplementary Movie 13). Small foci of elevated Rac activities are observed at the lateral side (arrowheads); scale bars: 20 µm. b Plot of fluorescence intensity along the line is indicated. c Quantification of overall Rac1 activity as defined by the ratio of YFP/CFP in PBS- or VEGF-treated cells (n = 74 and 87 cells were analysed from 4 independent experiments for PBS and VEGF, respectively (unpaired student’s t test)). d, e Confluent HUVECs pre-treated with EHT1864 for 30 min were treated with VEGF for additional 19 h. Quantification of (d) elongation factor and (e) migration velocity after EHT1864 + VEGF (n = 100 cells) and VEGF (n = 101 cells) treatment for the time period of 19 h (unpaired student’s t test). f Confluent HUVEC cultures expressing adeno-N17Rac1 display decreased VEGF-induced cell elongation as determined by PhaCoB Cell Tracker (n ≈ 1000cells/time point). gh Sew2871 application upregulated VEGF-induced cell elongation and migration ability. g Time-lapse recordings of confluent HUVECs expressing EGFP-p20 treated with 10 µM Sew2871. Sew2871 largely increased JAIL formation (arrowheads). Time scale: hh:mm; scale bars: 10 µm. h Quantification of overall EGFP-p20 intensity upon Sew2871 application. i, j Confluent HUVEC cultures were pre-treated with 10 µM Sew2871 for 1 h before 50 ng ml−1 VEGF was applied. i Quantification of elongation factor over time, as indicated (data are based on the analyses of 173, 162, 164, 173 cells for t = 0, 6, 12 and 18 h, respectively). j Comparison of migration velocity after Sew2871+VEGF, Sew2871, VEGF and control treatments, respectively, for 16 h (data are based on analyses of 103, 102, 99 and 100 cells for each group). One-way ANOVA was used to analyse significance difference for i, j. Representative results from three independent experiments are shown. Error bars represent ± SEM
Fig. 9
Fig. 9
Polarized JAIL dynamics during sprouting angiogenesis in fibrin angiogenesis assay using EGFP-p20 expressing HUVECs. ac SDM based time-lapse recordings (TLR) of different cell junctions during sprouting angiogenesis. In the overview of b, c, f, Yellow dotted lines indicate the z-projection level. Purple dotted line completes the lumen-forming sprouts since not all cell expressed the fluorescence-tagged protein and white dotted line outlines the cell junctions. a Overview of tip cell sprouts. (cropped area) EGFP-p20-positive plaques identified transient lamellipodia and filopodia at the tip cell front (arrows). b Overview and Z-projection of tip cell/stalk cell junctions. (cropped area) TLR of large JAIL that development at the cell poles (white dotted lines, area 1) and faint and small JAIL appearing at the lateral junction (arrows, area 2). c JAIL formation between stalk cell/stalk cell junctions. (cropped area 1) TLR demonstrate large JAIL formation at the cell pole (dotted line). (cropped area 2, middle panel) Small JAIL developed at lateral junction (arrows). (cropped area 2, lower panel) ARP2/3 complex inhibitor CK666 applied to the same cells blocked JAIL formation. d Quantification of JAIL size in the migrating pole and lateral side of the sprouting ECs. Sixty-four JAIL at the leading cell pole and 45 JAIL at the lateral junctions from 3 movies over a period of 30 min were analysed, unpaired student’s t test. e Inhibition of cell migration ability after ARP2/3 complex inhibitor (CK666) and inactive control inhibitor (CK689) and Rac inhibitor EHT1864. Quantification is based on phase-contrast time-lapse recordings for the time period up to 6 h; n = 67, 70, 82 cells before and 69, 70, 85 cells after CK666, CK689, or EHT1864 treatment, respectively. Cells were pooled from two independent experiments; two-way ANOVA. f Overview and Z-projections of vessel sprouts in fibrin angiogenesis assays 5 days after seeding; cells were fixed and labelled with Phalloidin-TRITC and VE-cadherin. (cropped areas) JAIL are indicated at cell poles by the appearance of large VE-cadherin plaques (arrows) that co-localise with the actin network (arrows), whereas small VE-cadherin plaques appear at lateral junctions (arrowhead). Error bars represent ± SEM; scale bars indicate 50 and 10 µm in the overview and cropped areas, respectively
Fig. 10
Fig. 10
The scheme illustrates the proposed model of the molecular mechanisms driving cell migration in angiogenesis

References

    1. Gerhardt H, et al. VEGF guides angiogenic sprouting utilizing endothelial tip cell filopodia. J. Cell. Biol. 2003;161:1163–1177. doi: 10.1083/jcb.200302047. - DOI - PMC - PubMed
    1. Jakobsson L, et al. Endothelial cells dynamically compete for the tip cell position during angiogenic sprouting. Nat. Cell. Biol. 2010;12:943–953. doi: 10.1038/ncb2103. - DOI - PubMed
    1. Gaengel K, et al. The sphingosine-1-phosphate receptor S1PR1 restricts sprouting angiogenesis by regulating the interplay between VE-cadherin and VEGFR2. Dev. Cell. 2012;23:587–599. doi: 10.1016/j.devcel.2012.08.005. - DOI - PubMed
    1. Bentley K, et al. The role of differential VE-cadherin dynamics in cell rearrangement during angiogenesis. Nat. Cell Biol. 2014;16:309–321. doi: 10.1038/ncb2926. - DOI - PubMed
    1. Yamamoto H, et al. Integrin beta1 controls VE-cadherin localization and blood vessel stability. Nat. Commun. 2015;6:6429. doi: 10.1038/ncomms7429. - DOI - PubMed

Publication types

MeSH terms

Substances