. 2017 Dec 20;7(1):17888.
doi: 10.1038/s41598-017-17982-y.

Evaluation of serum MMP-9 as predictive biomarker for antisense therapy in Duchenne

Affiliations

Evaluation of serum MMP-9 as predictive biomarker for antisense therapy in Duchenne

A Lourbakos et al. Sci Rep. .

Abstract

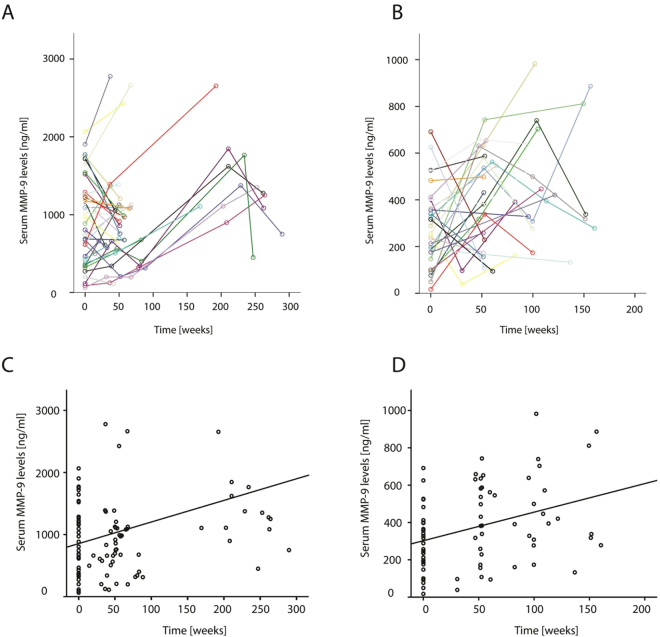
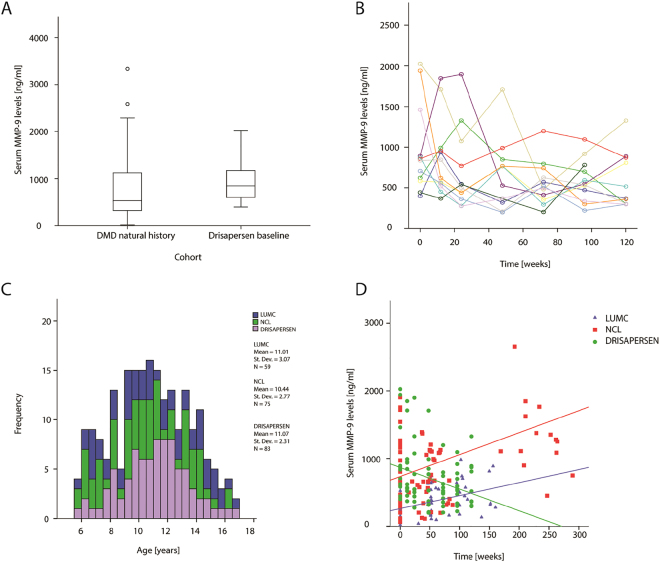
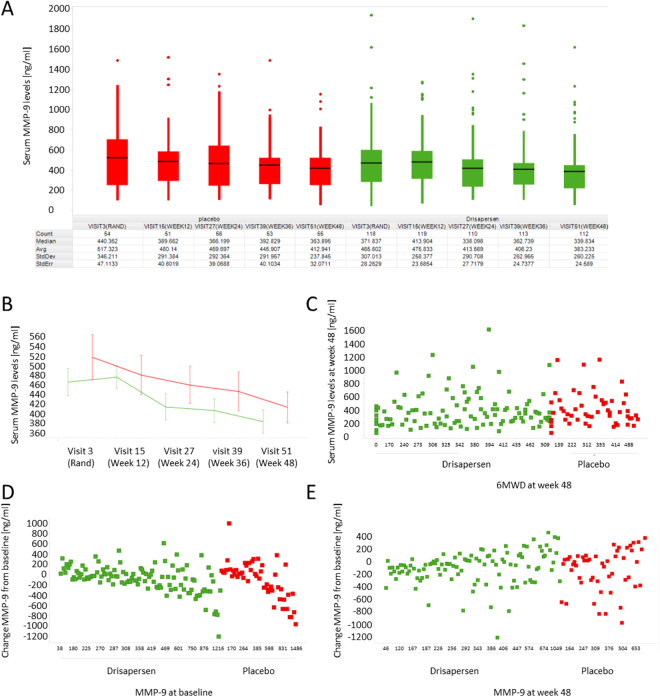
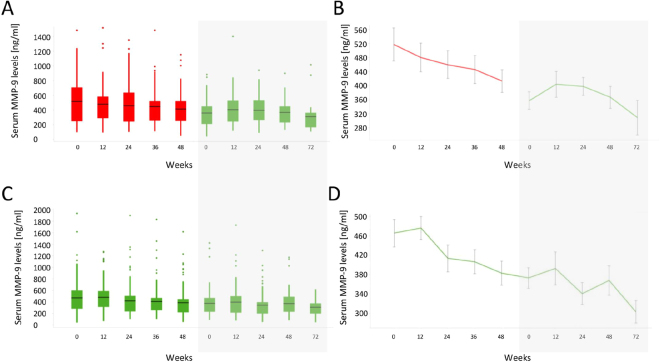
Duchenne Muscular Dystrophy (DMD) is a severe muscle disorder caused by lack of dystrophin. Predictive biomarkers able to anticipate response to the therapeutic treatments aiming at dystrophin re-expression are lacking. The objective of this study is to investigate Matrix Metalloproteinase-9 (MMP-9) as predictive biomarker for Duchenne. Two natural history cohorts were studied including 168 longitudinal samples belonging to 66 patients. We further studied 1536 samples obtained from 3 independent clinical trials with drisapersen, an antisense oligonucleotide targeting exon 51: an open label study including 12 patients; a phase 3 randomized, double blind, placebo controlled study involving 186 patients; an open label extension study performed after the phase 3. Analysis of natural history cohorts showed elevated MMP-9 levels in patients and a significant increase over time in longitudinal samples. MMP-9 decreased in parallel to clinical stabilization in the 12 patients involved in the open label study. The phase 3 study and subsequent extension study clarified that the decrease in MMP-9 levels was not predictive of treatment response. These data do not support the inclusion of serum MMP-9 as predictive biomarker for DMD patients.


Conflict of interest statement

LUMC has patents on exon skipping of some of which A.A.R. and P.A.C.t.H. are co-inventors. Upon sublicensing some of these patents to Biomarin, A.A.R. and P.A.C.t.H. have received a share of royalty payments from LUMC. J.J.G.M.V. and E.H.N. report to be involved in clinical trials for Duchenne muscular dystrophy for GSK, Biomarin and Santhera. LUMC receives research funding from the Association française contre les myopathies, the EU, ZonMW, NOW, Prinses Beatrix Spierfonds, PPMD and DPP-NL. A.L., K.K., R.J.B., G.C. and S.d.K. report being employed by Biomarin. F.M. reports having served on scientific advisory boards for Acceleron Pharma, Genzyme, AVI BioPharma, Debiopharma Group, GSK, Biomarin, Servier and Santhera Pharmaceutical. F.M. serves on the editorial board of Neuromuscular Disorders and Neuropediatrics; receives research support from the European Union, the MRC, the Wellcome Trust, the Association Française Contre les Myopathies (AFM), the Muscular Dystrophy Campaign, the GOSH Biomedical Research Centre and the Muscular Dystrophy Association USA, is receiving funding for trials from GSK and the British Heart Foundation and has received funding for trials from AVI BioPharma, Trophos and PTC.

Figures

Figure 1
Figure 1
MMP-9 serum levels are elevated in DMD. (A) Dot plot showing the distribution of MMP-9 serum levels in 32 healthy controls and 172 DMD patients. Samples of DMD patients represent the baseline of the phase 3 DMD114044 study. (B) ROC curve showing the potential of MMP-9 serum levels to discriminate between DMD patients and healthy (age-matched) controls.
Figure 2
Figure 2
Serum MMP-9 levels increase over time in DMD patients’ serum samples. (A,B) Scatter plots showing serum MMP-9 concentration (y-axis) with follow-up time (x-axis) in individual DMD patients from NCL (A) and LUMC (B). Colors represents specific patients and color matched lines connect longitudinal measurements. (C,D) Scatter plots representing the same data as in panels A and B. In these 2 panels the line represents the time effect as estimated by the fixed effects of the linear mixed model. The increase of MMP-9 levels over time is significant (p < 10−7 for NCL and p < 10−2 for LUMC).
Figure 3
Figure 3
Serum MMP-9 levels in patients participating to the dose escalating study (NCT01910649) and open label extension study with drisapersen (study 114673). (A) Box plots show comparable serum MMP-9 concentration in DMD natural history cohorts (patients belonging to the 3 natural history cohorts pooled together) and the baseline visit of DMD patients treated with drisapersen. (B) Scatter plot representing serum MMP-9 concentration (y-axis) with follow-up time (x-axis) in 12 DMD patients treated with drisapersen. MMP-9 levels significantly decrease over time (p < 10−3). (C) Histogram showing the age distribution of the 3 longitudinal cohorts. Mean, standard deviation and counts are reported for each cohort. (D) Scatter plots showing the increase of MMP-9 levels over time in the 2 natural history cohorts and the decrease of MMP-9 in the drisapersen treated cohort. All longitudinal samples in the same age range are included in this graph. Each dot represents a longitudinal measurement. Colors are specific for cohorts. Lines represent follow-up time as estimated by the fixed effects of the simplified linear mixed model only including follow-up time.
Figure 4
Figure 4
Relationship between MMP-9, CK, age and 6MWD at baseline in the phase 3 study (NCT01254019 - DMD114044). (A,C,E) Scatter plots showing the relationship between MMP-9 serum levels with age, 6MWD and the combination of age and 6MWD data. (B,D,F) Scatter plots showing the relationship between CK activity levels with age, 6MWD and the combination of age and 6MWD data. In panels E and F, color represents age windows as shown by the legend at the bottom-right and 6MWD are plotted for each age bin.
Figure 5
Figure 5
Effects of drisapersen on MMP-9 in the phase 3 trial (NCT01254019 - DMD114044). (A) Box-plot showing the MMP-9 levels at each visit for both placebo (red) and drisapersen (green) arms. For each visit the number of samples, MMP-9 median, average, standard deviation and standard error are given in table. (B) Line plot showing the progression of MMP-9 during the 48 weeks of the trial. The red line indicated patients on placebo, while the green line represents patients on drisapersen. (C) Scatter plot showing the lack of association between MMP-9 data and 6MWD at week 48. (D,E) Scatter plots showing the change in MMP-9 levels at week 48 (y-axis) compared to MMP-9 levels at baseline (D) and at week 48 (x-axis).
Figure 6
Figure 6
MMP-9 levels in the open label extension study DMD114349. (A,C) Box plots showing the concentration of MMP-9 in serum during the blinded phase (white background) and during the open label extension (grey background) for both placebo (A) and treatment (C) arms. (B,D) Line plots showing the mean MMP-9 serum concentration during the blinded phase and open label extension phase for both placebo (B) and treatment (D) arms. Data are presented as mean MMP-9 and error bars depict the standard error of the mean.

References

    1. Ellis JA, Vroom E, Muntoni F. 195th ENMC International Workshop: Newborn screening for Duchenne muscular dystrophy 14–16th December, 2012, Naarden, The Netherlands. Neuromuscul. Disord. 2013;23:682–689. doi: 10.1016/j.nmd.2013.05.008. - DOI - PubMed
    1. Helderman-van den Enden, A. T. J. M. et al. An urgent need for a change in policy revealed by a study on prenatal testing for Duchenne muscular dystrophy. Eur. J. Hum. Genet. 1–6 10.1038/ejhg.2012.101 (2012). - PMC - PubMed
    1. van den Bergen JC, et al. Clinical characterisation of Becker muscular dystrophy patients predicts favourable outcome in exon-skipping therapy. J. Neurol. Neurosurg. Psychiatry. 2014;85:92–8. doi: 10.1136/jnnp-2012-304729. - DOI - PubMed
    1. Henricson EK, et al. Thecooperative international neuromuscular research group Duchenne natural history study: glucocorticoid treatment preserves clinically meaningful functional milestones and reduces rate of disease progression as measured by manual muscle testing and othe. Muscle Nerve. 2013;48:55–67. doi: 10.1002/mus.23808. - DOI - PMC - PubMed
    1. Aartsma-Rus A. Therapeutic antisense-induced exon skipping in cultured muscle cells from six different DMD patients. Hum. Mol. Genet. 2003;12:907–914. doi: 10.1093/hmg/ddg100. - DOI - PubMed

Publication types

LinkOut - more resources