. 2017 Dec 20;8(1):2205.
doi: 10.1038/s41467-017-02348-9.

Inter-annual and decadal changes in teleconnections drive continental-scale synchronization of tree reproduction

Affiliations

Inter-annual and decadal changes in teleconnections drive continental-scale synchronization of tree reproduction

Davide Ascoli et al. Nat Commun. .

Abstract

Climate teleconnections drive highly variable and synchronous seed production (masting) over large scales. Disentangling the effect of high-frequency (inter-annual variation) from low-frequency (decadal trends) components of climate oscillations will improve our understanding of masting as an ecosystem process. Using century-long observations on masting (the MASTREE database) and data on the Northern Atlantic Oscillation (NAO), we show that in the last 60 years both high-frequency summer and spring NAO, and low-frequency winter NAO components are highly correlated to continent-wide masting in European beech and Norway spruce. Relationships are weaker (non-stationary) in the early twentieth century. This finding improves our understanding on how climate variation affects large-scale synchronization of tree masting. Moreover, it supports the connection between proximate and ultimate causes of masting: indeed, large-scale features of atmospheric circulation coherently drive cues and resources for masting, as well as its evolutionary drivers, such as pollination efficiency, abundance of seed dispersers, and natural disturbance regimes.


Conflict of interest statement

The authors declare no competing financial interests.

Figures

Fig. 1
Fig. 1
Observed and predicted values of the masting indexes. Observed (blue line) and predicted (orange line) yearly values of M_index (scaled from 0 to 1) calculated for Central and Northern Europe for beech (first row, 1950–2015) and spruce (second row, 1959–2014). Predicted values estimated according to the final model in Table 2. Gray bars are the model residuals
Fig. 2
Fig. 2
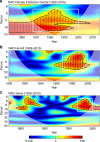
Wavelet coherence between the standardized beech M_index and winter-NAO indices. Wavelet coherence between the standardized beech M_index and winter-NAO indices. Winter-NAO indices used: Climate Prediction Centre-NOAA a, Hurrell b and Jones et al. c. X-axes: years of analysis. Y-axes: frequency domain of the NAO-masting relationship in years. Note that the x- and y-axes vary between plots. Arrows pointing up-right show in-phase behavior and y leading x, i.e., NAO leading M_index. Black contour designates frequencies of significant coherence (p < 0.1, two-sided test); the white cone of influence shows the data space immune from distortion by edge effects. The white squares show the period of strong coherence between 1960 and 2000
Fig. 3
Fig. 3
Leave one out cross-validation. Observed and predicted values of beech (left) and spruce (right) M_index from the LOOCV of the final model. The dashed line represents the perfect match between observed and predicted values. Years with the largest disparity are labeled individually
Fig. 4
Fig. 4
NAO and related weather patterns in temperature and precipitation. Correlation between NAO and temperature anomalies (first row), and between NAO and precipitation anomalies (second row) for the seasons winter, spring, summer (columns from left to right). Regions with significant correlations are denoted by black dots. Monthly precipitation and temperature have been obtained from the CRU database (version TS4.00). We aggregated these time series into seasonal time-series and the NAO indices according to our experiment design: winter (December–January–February–March, DJFM), spring (April–May, AM), and summer (June–July–August–September, JJAS). The period between 1950 and 2015 was considered for the correlation analysis. Figure created using ggplot2 package for R

References

    1. Ashton PS, Givnish TJ, Appanah S. Staggered flowering in the Dipterocarpaceae: new insights into floral induction and the evolution of mast fruiting in the seasonal tropics. Am. Nat. 1988;132:44–66. doi: 10.1086/284837. - DOI
    1. Schauber EM, et al. Masting by eighteen New Zealand plant species: the role of temperature as a synchronizing cue. Ecology. 2002;83:1214–1225. doi: 10.1890/0012-9658(2002)083[1214:MBENZP]2.0.CO;2. - DOI
    1. Vacchiano G, et al. Spatial patterns and broad-scale weather cues of beech mast seeding in Europe. New Phytol. 2017;215:595–608. doi: 10.1111/nph.14600. - DOI - PubMed
    1. Crone EE, Rapp JM. Resource depletion, pollen coupling, and the ecology of mast seeding. Ann. N. Y. Acad. Sci. 2014;1322:21–34. doi: 10.1111/nyas.12465. - DOI - PubMed
    1. Pearse IS, Koenig WD, Kelly D. Mechanisms of mast seeding: resources, weather, cues, and selection. New Phytol. 2016;212:546–562. doi: 10.1111/nph.14114. - DOI - PubMed