. 2017 Dec 20;8(1):2214.
doi: 10.1038/s41467-017-02363-w.

Whole proteome analysis of human tankyrase knockout cells reveals targets of tankyrase-mediated degradation

Affiliations

Whole proteome analysis of human tankyrase knockout cells reveals targets of tankyrase-mediated degradation

Amit Bhardwaj et al. Nat Commun. .

Abstract

Tankyrase 1 and 2 are poly(ADP-ribose) polymerases that function in pathways critical to cancer cell growth. Tankyrase-mediated PARylation marks protein targets for proteasomal degradation. Here, we generate human knockout cell lines to examine cell function and interrogate the proteome. We show that either tankyrase 1 or 2 is sufficient to maintain telomere length, but both are required to resolve telomere cohesion and maintain mitotic spindle integrity. Quantitative analysis of the proteome of tankyrase double knockout cells using isobaric tandem mass tags reveals targets of degradation, including antagonists of the Wnt/β-catenin signaling pathway (NKD1, NKD2, and HectD1) and three (Notch 1, 2, and 3) of the four Notch receptors. We show that tankyrases are required for Notch2 to exit the plasma membrane and enter the nucleus to activate transcription. Considering that Notch signaling is commonly activated in cancer, tankyrase inhibitors may have therapeutic potential in targeting this pathway.


Conflict of interest statement

The authors declare no competing financial interests.

Figures

Fig. 1
Fig. 1
Generation and functional analysis of human tankyrase knockout cell lines. a Immunoblot analysis of whole cell lysates from HEK293T knockout (KO) cell lines generated by CRISPR-Cas9 stained with antibody that detects tankyrases 1 and 2. b FISH analysis of mitotic HEK293T WT, 1KO, 2KO, or DKO mitotic cells with a 16p telo probe (green). HEK293T cells are trisomic for chromosome 16. DNA was stained with DAPI. Scale bar, 5 μm. c Quantification of the frequency of mitotic cells with cohered telomeres. Average of two independent experiments (n = 80 cells) ± SEM. *p ≤ 0.05, **p ≤ 0.01, students unpaired t-test. d Analysis of telomere restriction fragments isolated from HEK293T WT or TNKS DKO cells isolated from an early (E) time immediately following the CRISPR-Cas9 screen and at a late (L) time point following passaging for ~2 months, fractionated on agarose gel, denatured, and hybridized with a 32P-[CCCATT]3 probe. EtBr stain of total DNA is below. e Analysis of telomere restriction fragments isolated from HEK293T WT, 1KO, 2KO, or DKO cells isolated from population doubling (PD) 6, 45, or 90, fractionated on agarose gel, denatured and hybridized with a 32P-[CCCATT]3 probe. f Graphical representation of the mean telomere length determined using Telometric (Fox Chase Cancer Center). g Immunofluorescence analysis of HEK293T WT, 1KO, 2KO, or DKO cells following fixation with 2% paraformaldehyde and stained with β-tubulin antibody (green) and DAPI (blue). Scale bar, 5 μm. h Quantification of the frequency of cells with defective mitotic spindles. Average of two independent experiments (n = 66–71mitotic cells each) ± SEM. *p ≤ 0.05, **p ≤ 0.01, Student’s unpaired t-test
Fig. 2
Fig. 2
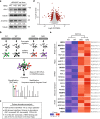
Quantitative proteomic analysis of TNKS DKO cells. a Immunoblot of HEK293T TNKS KO cell lines demonstrating stabilization of Axin1 and reduction of β-catenin in TNKS KO cell lines. Protein levels of Axin and β-catenin in total cell lysates from KO cell lines relative to tubulin and normalized to WT cells are indicated below the blot. b Experimental strategy for analyzing protein abundance in TNKS DKO vs. WT cells using TMT labeling. c Results of protein abundance analysis. d Volcano plot indicating the 608 proteins showing a significant change in abundance (see Supplementary Data 1). e Heat map indicating 23 of the 74 proteins that are stabilized in TNKS DKO cells with a tankyrase binding site indicated on the right; additional sites (if present) are noted in Supplementary Data 2. Note, Axin1 has a non-canonical site, RxxVxGxE. Gene names in bold were selected for further analysis
Fig. 3
Fig. 3
Validation of candidates from the proteomic screen. a Immunoblot analysis of HEK293T WT, TNKS DKO, or WT plus tankyrase inhibitor (Ti8 or Ti15) with the indicated antibodies. Protein levels of Notch2 in DKO and WT + Ti15 relative to tubulin and normalized to WT cells are indicated below the blot. b Immunoblot analysis of HEK293T WT or TNKS DKO cells with the indicated antibodies. c Plot of the abundance of the indicated proteins in TNKS DKO relative to WT cells. Average of two or more independent experiments ± SEM. *p ≤ 0.05, **p ≤ 0.01, Student’s unpaired t-test. d Immunoblot analysis of HepG2 cells treated with tankyrase inhibitor (Ti8 or XAV939) with the indicated antibodies. e Immunoblot analysis of HEK293T WT or DKO cells without (–) or with (+) tankyrase inhibitor Ti8 with the indicated antibodies. Protein levels of Notch2 or AMOT in WT + Ti8 relative to tubulin and normalized to WT cells and of Notch2 or AMOT in DKO + Ti8 relative to tubulin and normalized to DKO cells are indicated below the blot
Fig. 4
Fig. 4
Rescue and immunoprecipitation analysis of candidates for the proteomic screen. a Reintroduction of tankyrases into DKO cells induces loss of candidate proteins. Immunoblot analysis of HEK293T DKO cells stably expressing a vector control or Flag-TNKS1 and Flag-TNKS2 (T1T2) with the indicated antibodies. b Coimmunoprecipitation of candidate proteins with tankyrase. Immunoblot analysis of HEK293T cells immunoprecipitated with control or TNKS IgG, stained with amido black (left panel) and probed with the indicated antibodies (middle and right panels)
Fig. 5
Fig. 5
NKD1 and NKD2 are targets of tankyrase. a Schematic diagram of NKD1/2 showing the N-terminal myristoylation site. The shaded box indicates the conserved EFX (EF-hand containing) domain that binds DVL. Alignment of the tankyrase-binding site in human NKD1 and NKD2. Identical amino acids are in black. b Immunoblot analysis showing NKD2 is stabilized in RNF146 siRNA-treated HEK293T cells. c, d Endogenous tankyrase and GFP-NKD2 coimmunoprecipitate, dependent on the NKD2 tankyrase-binding site. Immunoblot analysis of HEK293T cells transfected with GFP, GFP-NKD2 WT, or GFP-NKD2 Mut, immunoprecipitated with c tankyrase or d GFP antibodies, and probed with the indicated antibodies. e Immunoblot analysis showing that NKD1 is stabilized upon treatment of HepG2 cells with tankyrase inhibitor Ti8. f Immunoblot analysis showing that HA-NKD1 coimmunoprecitates with tankyrase. Immunoblot of HEK293T cells transfected with HA-NKD1, immunoprecipitated with control or TNKS IgG, and probed with the indicated antibodies
Fig. 6
Fig. 6
Notch is a target of tankyrase. a Schematic diagram of Notch1/2. Shaded box; RAM (RPBJ association molecule) domain that binds RPBJ (recombining binding protein suppressor of hairless). PM plasma membrane. Alignment of tankyrase-binding sites; identical amino acids in black. The acidic residue at the 8th position of the tankyrase-binding motif indicates an 8-amino-acid motif. b Immunoblot analysis showing Notch2 is stabilized in RNF146 siRNA-treated HEK293T cells. c Endogenous tankyrase and Flag-Notch2 coimmunoprecipitate. Immunoblot analysis of HEK293T cells transfected with Flag-Notch2 and immunoprecipitated with tankyrase IgG. d Endogenous tankyrase and Flag-Notch2 coimmunoprecipitate, dependent on the Notch2 tankyrase-binding site. Immunoblot analysis of HEK293T cells transfected with vector, Flag-Notch2 WT, or Flag-Notch2 Mut and immunoprecipitated with anti-tankyrase IgG. e Notch2 is a target for ADP-ribosylation by tankyrase 1. Flag-Notch2 or Myc-TRF1 immunoprecipitates from HEK293T cells were incubated with 32P-NAD+ and recombinant tankyrase 1, fractionated by SDS-PAGE and visualized by Coomassie blue (left panel; asterisks indicate FlagNotch2 and MycTRF1) and autoradiography (right panel). f Notch2 is increased at the plasma membrane in TNKS DKO cells. Immunofluorescence analysis of formaldehyde-fixed HEK293T WT, TNKS DKO, or TNKS DKO expressing tankyrase 1 and 2 (T1T2) cells stained with anti-Notch2 antibodies (green). DNA was stained with DAPI (blue). Scale bar, 5 μm. g Notch2 is increased at the plasma membrane in HeLa cells treated with inhibitors to tankyrase (Ti8) or γ-secretase (DAPT). Immunofluorescence analysis was performed as described in f. h, i Expression of the Notch target gene Nestin is reduced in h TNKS DKO cells and in i inhibitor-treated HEK293T cells. mRNA levels were quantified using qRT-PCR. Average of two to four independent experiments (with three technical replicates each) ± SD. *p ≤ 0.05, **p ≤ 0.01, Student's unpaired t-test. jl Notch2 stability is regulated by TNKS1, not TNKS2. j Immunofluorescence analysis of TNKS1 and TNKS2 DKO cells was performed as in f. k Immunoblot analysis of HEK293T WT and TNKS KO cells lines. l graphical representation of the abundance in TNKS KO cells relative to WT. Average of two independent experiments ± SEM. *p ≤ 0.05, Student's unpaired t-test

References

    1. Hsiao SJ, Smith S. Tankyrase function at telomeres, spindle poles, and beyond. Biochimie. 2008;90:83–92. doi: 10.1016/j.biochi.2007.07.012. - DOI - PubMed
    1. Lehtio L, Chi NW, Krauss S. Tankyrases as drug targets. FEBS J. 2013;280:3576–3593. doi: 10.1111/febs.12320. - DOI - PubMed
    1. Gupte R, Liu Z, Kraus WL. PARPs and ADP-ribosylation: recent advances linking molecular functions to biological outcomes. Genes Dev. 2017;31:101–126. doi: 10.1101/gad.291518.116. - DOI - PMC - PubMed
    1. Smith S. The world according to PARP. Trends Biochem. Sci. 2001;26:174–179. doi: 10.1016/S0968-0004(00)01780-1. - DOI - PubMed
    1. De Vos M, Schreiber V, Dantzer F. The diverse roles and clinical relevance of PARPs in DNA damage repair: current state of the art. Biochem. Pharmacol. 2012;84:137–146. doi: 10.1016/j.bcp.2012.03.018. - DOI - PubMed

Publication types