. 2017 Dec 20;7(1):17887.
doi: 10.1038/s41598-017-18196-y.

Deciphering the emergence, genetic diversity and evolution of classical swine fever virus

Affiliations

Deciphering the emergence, genetic diversity and evolution of classical swine fever virus

Liliam Rios et al. Sci Rep. .

Abstract

Classical swine fever (CSF) is one of the most important infectious diseases causing significant economic losses. Its causal agent, CSF virus (CSFV), is a member of the Pestivirus genus included into the Flaviviridae family. Previous molecular epidemiology studies have revealed the CSFV diversity is divided into three main genotypes and different subgenotypes. However, the classification system for CSFV has not yet been harmonized internationally. Similarly, the phylogeny and evolutionary dynamics of CSFV remain unclear. The current study provides novel and significant insights into the origin, diversification and evolutionary process of CSFV. In addition, the best phylogenetic marker for CSFV capable of reproducing the same phylogenetic and evolutionary information as the complete viral genome is characterized. Also, a reliable cut-off to accurately classify CSFV at genotype and subgenotype levels is established. Based on the time for the most recent common ancestor (tMRCA) reconstruction and cophylogenetic analysis, it was determined that CSFV emerged around 225 years ago when the Tunisian Sheep Virus jumped from its natural host to swine. CSFV emergence was followed by a genetic expansion in three main lineages, driven by the action of positive selection pressure and functional divergence, as main natural forces.


Conflict of interest statement

The authors declare that they have no competing interests.

Figures

Figure 1
Figure 1
Evaluation of homoplasious signal and phylogenetic noise of different molecular markers for CSFV. The markers proposed for the clasification of CSFV and the complete genome were denoted: (AC) 5′UTR, (DF) E2 (190 nt), (GI) NS4B, (JL) E2 (1119 nt), (MO) 5′UTR-E2, (PR) respresent the complete genome used as gold standard. (A,D,G,J,M and P) plot representation of the number of transitions and transversions versus the genetic distance calculated with the best fitted model obtained by jmodeltest; (B,E,H,K,N and Q) likelihood mapping of CSFV sequences, the dots inside the triangles represent the posterior probabilities of the possible unrooted topologies for each quartet. Numbers indicate the percentage of dots in the centre of the triangle corresponding to phylogenetic noise; (C,F,I,L,O and R) results obtained from the Xia’s-test and the statistical support for each sequence group is also shown.
Figure 2
Figure 2
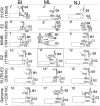
Phylogenetic tree topology comparison. Topologies obtained from the different markers included in the current study (5′UTR, E2 (190 nt), NS4B, E2 (1119 nt), 5′UTR-E2) and the complete CSFV genome by Bayesian Inference (BI), maximum likelihood (ML) and Neighbour Joining (NJ) analyzes are shown. The three main linages found for CSFV were denoted (CSFV-genotype 1 (G1), CSFV-genotype 2 (G2) and CSFV-genotype 3 (G3)). The number for each phylogenetic tree corresponds with the number in the topology comparison Table obtained from Kishino and Hasegawa test (K–H) and the Shimodaira–Hasegawa test (S–H) (Supplementary Table S1). The best phylogenetic tree estimated by K-H and S-H as well as by statistical support for the internal nodes was bounded by continuous lines. The internal node where the divergence of the CSFV-G2 was statistically supported is denoted with a black arrow. The phylogenetic trees with statistically significant difference with the best selected topology were highlighted by asterisks.
Figure 3
Figure 3
Frequency distribution of pairwise distance and clustering pattern for all lineages of CSFV using E2 gene sequences. (A) PASC results: the cut-off values for specie (63–80%), genotype (80–86%) and subgenotype (86–91%) differentiation were denoted, besides, a simplified tree deduced from the comparison of E2 gene sequences belonging to all lineages of CSFV and the Pestivirus Aydin/04-TR used as outgroup is shown. All the subgenotypes obtained were also denoted; (B) The SDT interface: a colour-coded pairwise identity matrix generated from all the 113 E2 gene sequences of CSFV included in the current study. Each coloured cell represents a percentage of identity score between two sequences (one indicated horizontally to the left and the other vertically at the bottom). A coloured key indicates the correspondence between pairwise identities and the colours displayed in the matrix. Pairwise identity frequency distribution plot is also shown. The horizontal axis indicates percentage pairwise. The cut-off values for genotype and subgenotype differentiation were also denoted.
Figure 4
Figure 4
Comparative phylogenetic analyses and population dynamics of classical swine fever virus. Maximum clade credibility (MCC) tree constructed using BEAST program. For simplication, the main linages branches were collapsed. The branches belonging to the three main lineages of CSFV were highlighted in green for CSFV-genotype 1, in blue CSFV-genotype 2 and in red for CSFV-genotype 3. The most probable year for the MRCA within each lineage and the 95% highest probability density (HPD) were also denoted. The relative genetic diversity was estimated for each genotype (green: CSFV-genotype 1, blue: CSFV-genotype 2 and red: CSFV-genotype 3) by Bayesian skyline Plot using an exponential, uncorrelated clock model. The x-axis is in units of year, and the y-axis represents the logarithmic scale of Neτ (where Ne is the effective population size and τ is the generation time).
Figure 5
Figure 5
Cartoon and surface of the predicted model of E2 protein of CSFV. (A) Sequence alignment of the template (BVDV1 E2) with E2 proteins from three-representative sequences of the three genotypes of Classical Swine Fever virus (CSFV). The location of structural domains DA, DB, DC and DD on the amino acid sequence were colored in blue, green, yellow and red respectively, keeping the same pattern of the 3D representation. Likewise, the antigenic regions A/D and B/C were also denoted. (B) Folding of E2: structural domains were represented on monomer A starting from the N terminus colored in blue (DA), purple (DB), yellow (DC) and red (DD). Positions of the antigenic regions B/C (gold) and A/D (ruby red) were located on monomer B. The linear epitopes LFDGTNP (green) and TAVSPTTLR (cyan) were also represented.
Figure 6
Figure 6
Mapping of positively selected sites on three dimensional structure of the E2 protein of CSFV. In all cases the surfaces for the antigenic domains B/C, A/D and the half C-terminal were represented in gold, ruby-red and gray respectively, the ribbon for the antigenic motives 64RYLASLHKKALPT76 and 82LLFD85 on the antigenic domain B/C were highlighted in red and pink respectively. (A) Positive selected sites identified by the site models M2a and M8 vs M1 and M7 respectively, for all 113 E2 gene sequences included in the study. All the sites were denoted in the ribbon structure and highlighted in pink on the protein surface. (BI) Positive selected sites identified by the branches-site models (A1 vs A) for the three subgenotypes of CSFV under the influence of positive selection action. (B) and (C) CSFV-subgenotype 1.4, (DF) CSFV-subgenotype 2.2 and (GI) CSFV-subgenotype 2.3; the ribbon for the CSFV subgenotype 1.4 was represented in green and for the CSFV-subgenotype 1.2 was represented in blue. The sites detected under positive selection pressure by the branches-site model were denoted on the ribbon structure and colored on the surface (CSFV-subgenotype 1.4: green and CSFV-subgenotype 2.1 and 2.3: blue).
Figure 7
Figure 7
Mapping of functional divergence sites on the three dimensional structure of the E2 for the different subgenotypes of CSFV. Functional divergent selected sites were denoted in pink on the protein surface. The subgenotype involved in the funcional divergence type I were represented. The cluster was collapsed for simplification purposes. The sequence IDs belonging to each cluster involved in functional divergence episode were also denoted.
Figure 8
Figure 8
Virus-host evolutionary association in the Pestivirus genus. (A) Contributions of individual host-parasite links to the Procrustean fit: Jacknifed squared residuals (bars) and upper 95% confidence intervals (error bars) resulting from applying PACo to patristic. Asterisks identify links significantly supported. The median squared residual value is shown (dashed line). (B) Tanglegram indicating the associations between each pestivirus and its reservoir host. The numbers at the nodes indicate the divergence time for that node, as estimated using the BEAST softaware packge. Red lines represent host-parasite associations observed which were significantly supported by PACo and blue lines the unsupported links. Parasite (BDV1: border diseases virus 1, BDV2: border diseases virus 2, BDV3: border diseases virus 3, TSV: tunisian sheep virus, PPB: pestivirus bungowannah, PBT: pestivirus Burdur/05-TR, BVDV1: bovine viral diarrhea virus 1, BVDV2: bovine viral diarrhea virus 2, PG: pestivirus giraffe, Prong: pronghorn antelope pestivirus, CSFV: classical swine fever virus, Aydin: aydin pestivirus); host (Ovia: Ovis aries, Bibi: Bison bison, Ranta: Rangifer tarandus, Suss: Sus scrofa, Cahi: Capra hircus, Bost: Bos Taurus, Capc: Capreolus capreolus, Cere: Cervus elaphus, Girc: Giraffa Camelopardalis, Anta: Antilocapra americana).

References

    1. Moennig V. The control of classical swine fever in wild boar. Frontiers in microbiology. 2015;6:1211. doi: 10.3389/fmicb.2015.01211. - DOI - PMC - PubMed
    1. Moennig V, Becher P, Beer M. Classical swine fever. Developments in biologicals. 2013;135:167–174. - PubMed
    1. Edwards S, et al. Classical swine fever: the global situation. Veterinary microbiology. 2000;73:103–119. doi: 10.1016/S0378-1135(00)00138-3. - DOI - PubMed
    1. Beer M, Goller KV, Staubach C, Blome S. Genetic variability and distribution of Classical swine fever virus. Animal health research reviews/Conference of Research Workers in Animal Diseases. 2015;16:33–39. doi: 10.1017/S1466252315000109. - DOI - PubMed
    1. Postel A, Moennig V, Becher P. Classical swine fever in Europe–the current situation. Berliner und Munchener tierarztliche Wochenschrift. 2013;126:468–475. - PubMed

LinkOut - more resources