. 2018 Mar;32(3):850-854.
doi: 10.1038/leu.2017.325. Epub 2017 Nov 16.

Genotoxic stresses promote clonal expansion of hematopoietic stem cells expressing mutant p53

Affiliations

Genotoxic stresses promote clonal expansion of hematopoietic stem cells expressing mutant p53

S Chen et al. Leukemia. 2018 Mar.
No abstract available


Conflict of interest statement

CONFLICT OF INTEREST

The authors declared that no conflict interest exists.

Figures
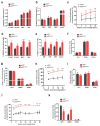
Figure 1
Figure 1
Mutant p53 enhances the repopulating potential of bone marrow cells. (a) The frequency of LT-HSCs, ST-HSCs, MPPs, and LSKs in the BM of young p53+/+ and p53R248W/+ mice. n=10 mice per genotype. (b) The frequency of CMPs, MEPs, GMPs, and LinKit+ cells in the bone marrow of young p53+/+ and p53R248W/+ mice. n=10 mice per genotype. (c) Percentage of donor-derived (CD45.2+) cells in the peripheral blood of primary recipient mice post-transplantation, measured at 4-week intervals. **p<0.01, ***p<0.001, n=7 mice per group. (d) The frequency of donor-derived LT-HSCs, ST-HSCs, MPPs, and LSKs in the bone marrow of primary recipient mice 16 weeks following transplantation. *p<0.05, ***p<0.001, n = 7 mice per group. (e) The frequency of donor-derived MEPs, CMPs, GMPs, and myeloid progenitors (LinKit+) in the bone marrow of primary recipient mice 16 weeks following transplantation. *p<0.05, **p<0.01, n = 7 mice per group. (f) The percentage of donor-derived myeloid cells (Gr1+), B cells (B220+), and T cells (CD3e+) in the peripheral blood of primary recipient mice 16 weeks following transplantation. n=7 mice per group. (g) The percentage of donor-derived myeloid cells, B cells, and T cells in the bone marrow of primary recipient mice 16 weeks following transplantation. n = 7 mice per group. (h) The percentage of donor-derived cells in the peripheral blood of secondary recipient mice. ***p<0.001, n=7 mice per group. (i) The percentage of donor-derived myeloid cells, B cells, and T cells in the peripheral blood of secondary recipient mice 16 weeks following transplantation. n=7 mice per group. (j) The percentage of donor-derived cells in the peripheral blood of secondary recipients 48 weeks after transplantation. ***p<0.001, n=7 mice per group. (k) The percentage of donor-derived myeloid cells, B cells, and T cells in the peripheral blood of secondary recipient mice 48 weeks after transplantation. *p<0.05, **p<0.01, n=7 mice per group.
Figure 2
Figure 2
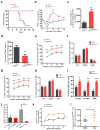
Chemotherapy treatment promotes clonal expansion of HSCs expressing mutant p53. (a) Kaplan-Meier survival curve of p53+/+ and p53R248W/+ mice following weekly 5-FU treatment. 5-FU was administered intraperitoneally weekly (the initial dose was 125 mg/kg, with subsequent doses of 90 mg/kg) for 3 weeks and the survival rates of 5-FU treated mice were measured. Results were analyzed with a log-rank nonparametric test and expressed as Kaplan-Meier survival curves (***p<0.001, n = 10 mice per group). (b) Hematopoietic recovery of p53+/+ and p53R248W/+ mice following a single dose of 5-FU treatment (200 mg/kg intraperitoneally). WBC counts are shown at each point after 5-FU administration as a percentage of the initial values for each group of mice. Mean ± SEM values are shown (*p<0.05, **p<0.01, ***p<0.001, n = 5 mice per group for each time point). (c) Absolute number of HSCs (LinSca1+CD48CD150+ cells) in the bone marrow of p53+/+ and p53R248W/+ mice seven days after a single dose of 5-FU treatment (200 mg/kg intraperitoneally). Mean ± SEM values are shown (**p<0.01, n = 5 mice per group). (d) The percentage of early apoptotic (AnnexinV+DAPI) HSCs (LinSca1+CD48CD150+ cells) in the bone marrow of p53+/+ and p53R248W/+ mice seven days after a single dose of 5-FU treatment (200 mg/kg intraperitoneally). Mean ± SEM values are shown (**p<0.01, n = 5 mice per group). (e) The percentage of donor-derived cells in the peripheral blood of primary recipient mice reconstituted with bone marrow cells from 5-FU treated p53+/+ and p53R248W/+ mice. Mean ± SEM values are shown (***p<0.001, n = 7–8 mice per group). (f) The percentage of donor-derived myeloid cells (Gr1+), B cells (B220+), and T cells (CD3e+) in the peripheral blood of secondary recipient mice 16-weeks after transplantation. Mean ± SEM values are shown (n.s, p>0.05, n = 7–8 mice per group). (g) The percentage of donor-derived cells in the peripheral blood of secondary recipient mice. Mean ± SEM values are shown (***p<0.001, n = 7–8 mice per group). (h) The percentage of donor-derived myeloid cells, B cells, and T cells in the peripheral blood of secondary recipient mice 16-weeks after transplantation. Mean ± SEM values are shown (n.s, p>0.05, n = 7–8 mice per group). (i) The chimerism of donor-derived LT-HSCs, ST-HSCs, and MPPs in the bone marrow of secondary recipient mice at 16 weeks following transplantation. Mean ± SEM values are shown (*p<0.05, **p<0.01, ***p<0.001, n = 7–8 mice per group). (j) The mRNA levels of p53 target gene p21 in hematopoietic stem and progenitor cells isolated from p53+/+ and p53R248W/+ mice treated with DMSO or 5-FU were determined by quantitative real-time PCR analysis. **p<0.01, n = 3. (K) Mutant p53 promotes clonal expansion of HSCs following chemotherapy treatment. The percentage of p53R248W/+ cells (CD45.2+) in the peripheral blood of recipient mice following ENU or DMSO treatment was determined by flow cytometry analysis at monthly intervals. Mean ± SEM values are shown (***p<0.001, n = 7 mice per group). (l) The frequency of p53R248W/+ LSK cells (CD45.2+) in the bone marrow of recipient mice at 16 weeks following ENU or DMSO treatment. Mean ± SEM values are shown (*p<0.05, n = 7 mice per group).

References

    1. Sperling AS, Gibson CJ, Ebert BL. The genetics of myelodysplastic syndrome: from clonal haematopoiesis to secondary leukaemia. Nat Rev Cancer. 2017;17:5–19. - PMC - PubMed
    1. Adams PD, Jasper H, Rudolph KL. Aging-Induced Stem Cell Mutations as Drivers for Disease and Cancer. Cell Stem Cell. 2015;16:601–12. - PMC - PubMed
    1. Jaiswal S, Fontanillas P, Flannick J, Manning A, Grauman PV, Mar BG, et al. Age-related clonal hematopoiesis associated with adverse outcomes. N Engl J Med. 2014;371:2488–98. - PMC - PubMed
    1. Genovese G, Kähler AK, Handsaker RE, Lindberg J, Rose SA, Bakhoum SF, et al. Clonal hematopoiesis and blood-cancer risk inferred from blood DNA sequence. N Engl J Med. 2014;371:2477–87. - PMC - PubMed
    1. Xie M, Lu C, Wang J, McLellan MD, Johnson KJ, Wendl MC, et al. Age-related mutations associated with clonal hematopoietic expansion and malignancies. Nat Med. 2014;20:1472–8. - PMC - PubMed

Publication types

Substances