

Wastewater influences nitrogen dynamics in a coastal catchment during a prolonged drought
- PMID: 29263559
- PMCID: PMC5726386
- DOI: 10.1002/lno.10576
Wastewater influences nitrogen dynamics in a coastal catchment during a prolonged drought
Abstract
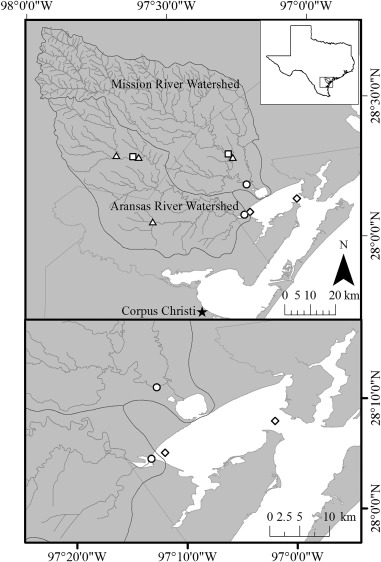
Ecosystem function measurements can enhance our understanding of nitrogen (N) delivery in coastal catchments across river and estuary ecosystems. Here, we contrast patterns of N cycling and export in two rivers, one heavily influenced by wastewater treatment plants (WWTP), in a coastal catchment of south Texas. We measured N export from both rivers to the estuary over 2 yr that encompass a severe drought, along with detailed mechanisms of N cycling in river, tidal river, and two estuary sites during prolonged drought. WWTP nutrient inputs stimulated uptake of N, but denitrification resulting in permanent N removal accounted for only a small proportion of total uptake. During drought periods, WWTP N was the primary source of exported N to the estuary, minimizing the influence of episodic storm-derived nutrients from the WWTP-influenced river to the estuary. In the site without WWTP influence, the river exported very little N during drought, so storm-derived nutrient pulses were important for delivering N loads to the estuary. Overall, N is processed from river to estuary, but sustained WWTP-N loads and periodic floods alter the timing of N delivery and N processing. Research that incorporates empirical measurements of N fluxes from river to estuary can inform management needs in the face of multiple anthropogenic stressors such as demand for freshwater and eutrophication.
Figures


References
-
- Ache, B. W. , Crossett M., Pacheco P. A., Adkins J. E., and Wiley P. C.. 2013. “The coast” is complicated: A model to consistently describe the nation's coastal population. Estuaries Coast. 38: 1–5. doi:10.1007/s12237-013-9629-9 - DOI
-
- Aguilera, R. , Marce R., and Sabater S.. 2012. Linking in‐stream nutrient flux to land use and inter‐annual hydrological variability at the watershed scale. Sci. Total Environ. 440: 72–81. doi:10.1016/j.scitotenv.2012.08.030 - DOI - PubMed
-
- Alexander, R. B. , and others. 2009. Dynamic modeling of nitrogen losses in river networks unravels the coupled effects of hydrological and biogeochemical processes. Biogeochemistry 93: 91–116. doi:10.1007/s10533-008-9274-8 - DOI
-
- An, S. , Gardner W. S., and Kana T.. 2001. Simultaneous measurement of denitrification and nitrogen fixation using isotope pairing with membrane inlet mass spectrometry analysis. Appl. Environ. Microb. 67: 1171–1178. doi:10.1128/AEM.67.3.1171-1178.2001 - DOI - PMC - PubMed
-
- Andersen, C. B. , Lewis G. P., Sargent K. A.. 2004. Influence of wastewater‐treatment effluent on concentrations and fluxes of solutes in the Bush River, South Carolina, during extreme drought conditions. Environ. Geosci. 11: 28–41. doi:10.1306/eg.10010303017 - DOI
LinkOut - more resources
Full Text Sources
Other Literature Sources