. 2017 Sep 14:2:26.
doi: 10.1038/s41541-017-0026-4. eCollection 2017.

A universal influenza virus vaccine candidate confers protection against pandemic H1N1 infection in preclinical ferret studies

Affiliations

A universal influenza virus vaccine candidate confers protection against pandemic H1N1 infection in preclinical ferret studies

Raffael Nachbagauer et al. NPJ Vaccines. .

Abstract

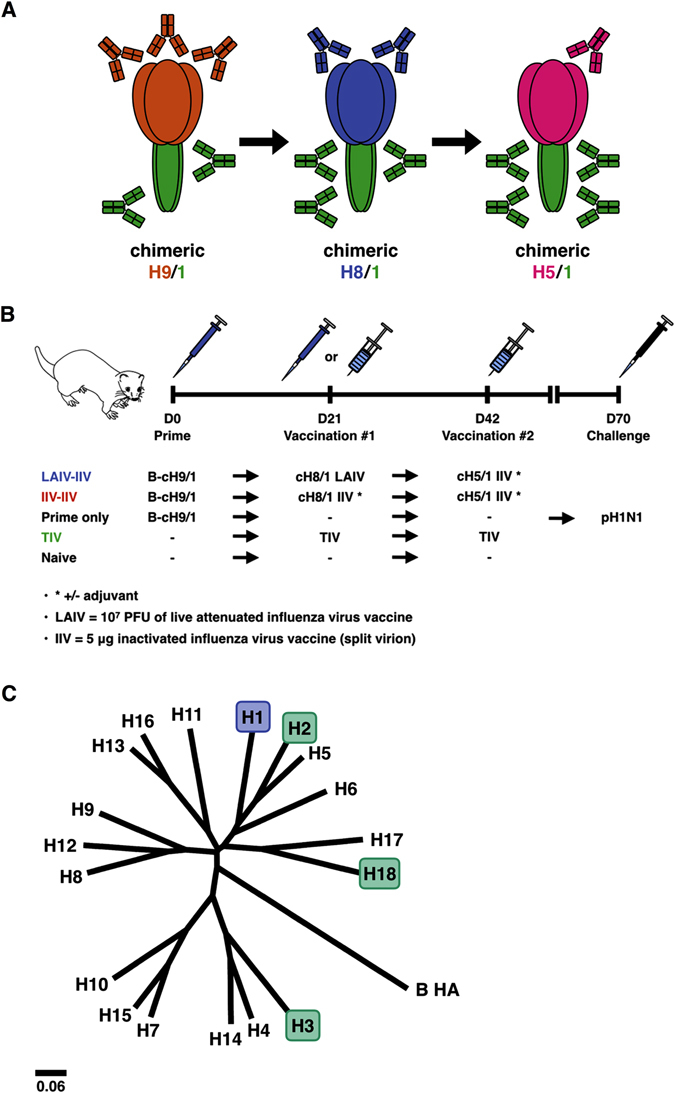
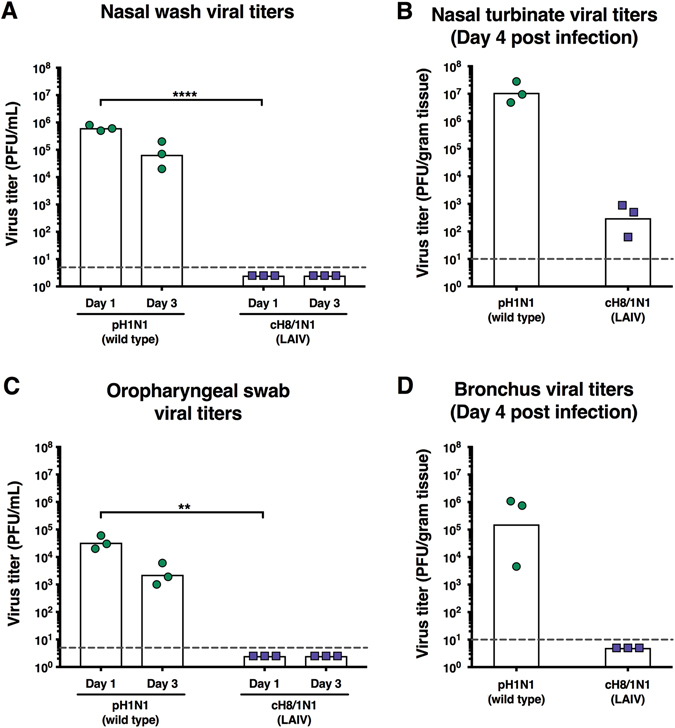
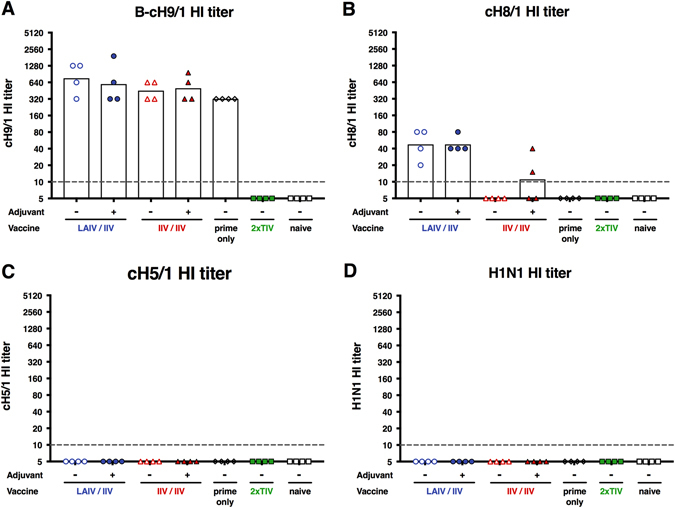
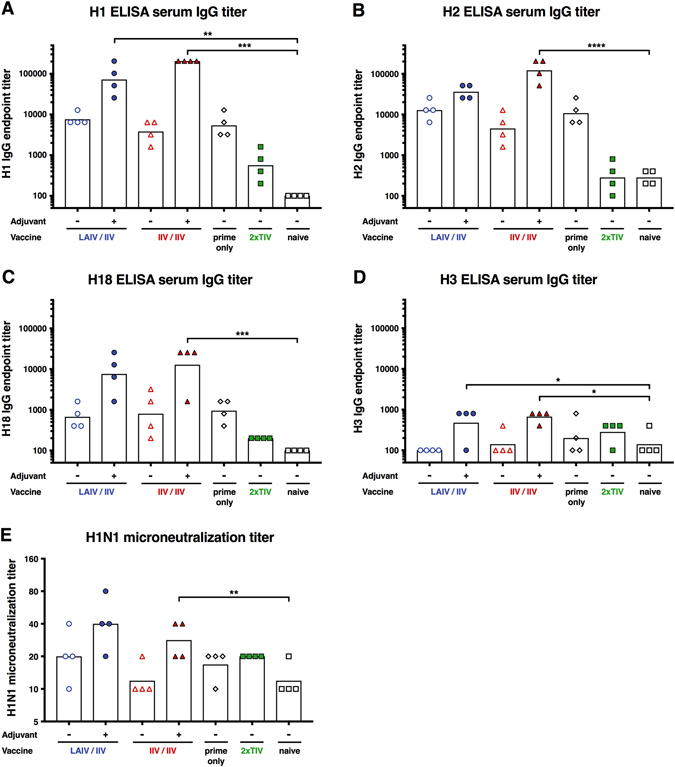
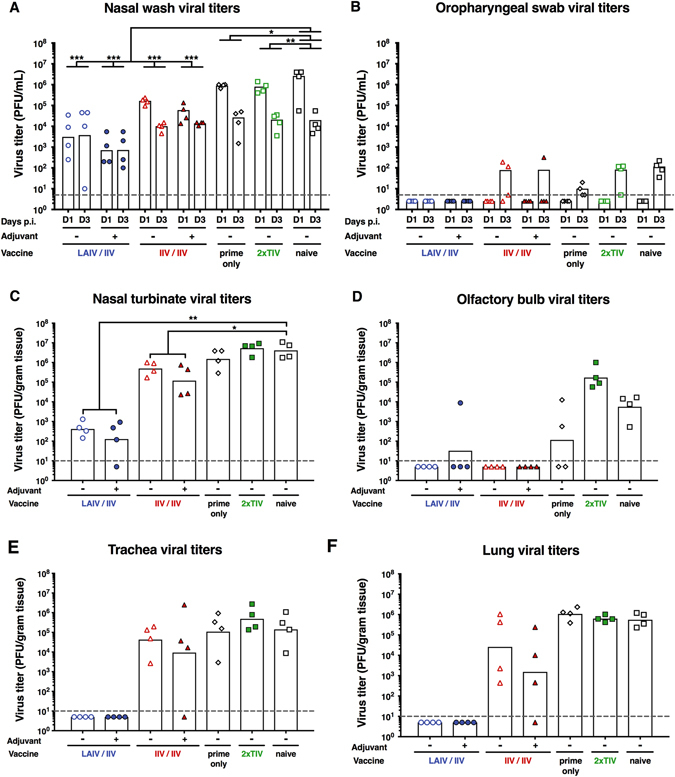
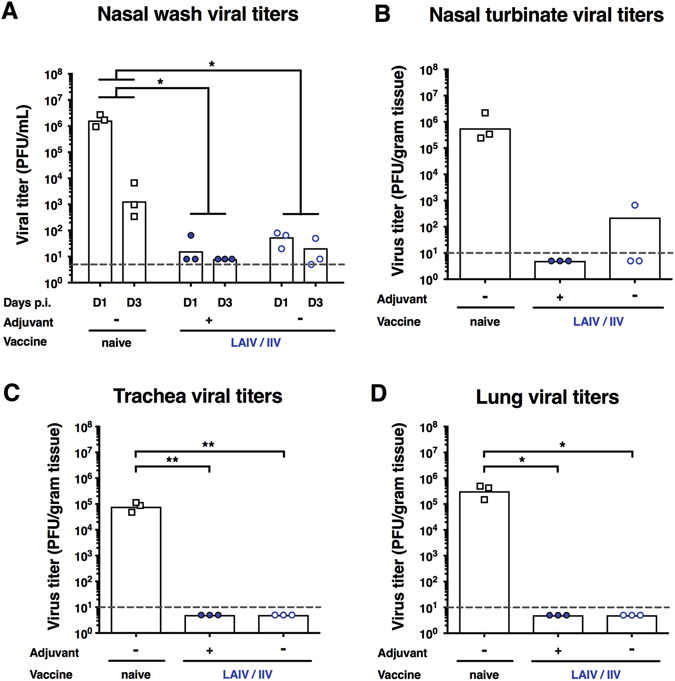
Influenza viruses evade human adaptive immune responses due to continuing antigenic changes. This makes it necessary to re-formulate and re-administer current seasonal influenza vaccines on an annual basis. Our pan-influenza vaccination approach attempts to redirect antibody responses from the variable, immuno-dominant hemagglutinin head towards the conserved-but immuno-subdominant-hemagglutinin stalk. The strategy utilizes sequential immunization with chimeric hemagglutinin-based vaccines expressing exotic head domains, and a conserved hemagglutinin stalk. We compared a live-attenuated influenza virus prime followed by an inactivated split-virus boost to two doses of split-virus vaccines and assessed the impact of adjuvant on protection against challenge with pandemic H1N1 virus in ferrets. All tested immunization regimens successfully induced broadly cross-reactive antibody responses. The combined live-attenuated/split virus vaccination conferred superior protection against pandemic H1N1 infection compared to two doses of split-virus vaccination. Our data support advancement of this chimeric hemagglutinin-based vaccine approach to clinical trials in humans.


Conflict of interest statement

The Icahn School of Medicine at Mount Sinai has filed patent applications regarding influenza virus vaccines.

Figures

Fig. 1
Fig. 1
Vaccination overview and phylogenetic tree. a Chimeric HA vaccination. By exchanging the HA head domains, but retaining the same HA stalk domain, the antibody response can be redirected towards the otherwise immuno-subdominant stalk region. Repeated exposure to cHA constructs can boost HA stalk-specific antibodies to high titers. b Vaccination strategy. Ferrets in the cHA vaccination groups were primed with an influenza B virus expressing the cH9/1 HA, followed by cH8/1 vaccination either as LAIV or IIV (with or without adjuvant) on day 21. All cHA vaccination groups received a second boost on day 42 with cH5/1 IIV vaccine (with or without adjuvant). Ferrets that either received only the cH9/1 HA prime, received a seasonal trivalent influenza virus vaccine (TIV) twice or were naïve were included as control groups. All ferrets were challenged with pH1N1 virus on day 70. c Phylogenetic tree. All vaccines contained the HA stalk domain of H1 (highlighted in blue). ELISA serology was performed against H1 (highlighted in blue) as well as H2, H18 and H3 (highlighted in green). H2 is closely related to H1 HA, while H18 is the most distantly related HA within influenza A group 1. H3 is an influenza A group 2 HA and was included to measure cross-group reactive antibody titers. The scale bar (0.06) indicates the percent difference based on amino acid sequences
Fig. 2
Fig. 2
Replication of cH8/1N1 LAIV is attenuated in ferrets. Viral titers were measured by plaque assay. Animals infected with wild type pH1N1 (n = 3) are shown as blue circles and animals infected with cH8/1N1 LAIV (n = 3) are shown as blue squares. White bars indicate the GMTs of each group. The gray dashed line indicates the limit of detection. a Nasal wash viral titers. Viral titers in nasal washes were measured on day 1 and day 3 post infection. b Nasal turbinate viral titers. Viral titers in nasal turbinates were measured on day 4 post infection. c Oropharyngeal swab viral titers. Viral titers in oropharyngeal swabs were measured on day 1 and day 3 post infection. d Bronchus viral titers. Viral titers in the left medial bronchus of the upper lobe of the lung were measured on day 4 post infection. Groups in a and c were compared with a two-way ANOVA, followed by a Sidak’s multiple comparison test. The asterisks refer to the level of significance (zeros after the decimal point of the p-value): *P  ≤ 0.05; **P  ≤ 0.01; ***P  ≤ 0.001; ****P  ≤ 0.0001
Fig. 3
Fig. 3
Hemagglutination inhibition titers. Hemagglutination inhibition titers are plotted on the y-axis. LAIV followed by IIV vaccinated animals are shown as blue circles (empty circles, without adjuvant; full circles, with adjuvant). IIV followed by IIV vaccinated animals are shown as red triangles (empty triangles, without adjuvant; full triangles, with adjuvant). Animals that received only the cH9/1 HA prime are shown as white diamonds. TIV-vaccinated animals are shown as green squares and naïve animals are shown as white squares. White bars indicate the GMTs of each group. Each point shows the titer for one animal (n = 4/group). The gray dashed line indicates the limit of detection. Titers were measured in pre-challenge sera (day 70). a B-cH9/1 hemagglutination inhibition titer. b cH8/1 hemagglutination inhibition titer. c cH5/1 hemagglutination inhibition titer. d pH1N1 hemagglutination inhibition titer
Fig. 4
Fig. 4
H1 and N1 specific antibody titers measured by ELISA. ELISA endpoint titers against cH6/1 protein are plotted on the y-axis. a H1 stalk serum IgG titers. The IgG antibody responses were measured on days 0, 21, 42, 70 and 74 (x-axis). Each point shows the mean titer and standard error of the mean for each group (n = 4/group). b H1 stalk serum IgA titers. The IgA antibody responses were measured on days 0, 21, 42, 70 and 74 (x-axis). Each point shows the mean titer and standard error of the mean for each group (n = 4/group). c H1 stalk nasal wash IgA titers. ELISA IgA titers were measured in nasal washes on day 3 post infection. Each point shows the titer for one animal (n = 4/group). White bars indicate the GMTs of each group. The gray dashed line indicates the limit of detection. d N1 serum IgG titers. The IgG antibody responses were measured on days 0, 21, 42, 70 and 74 (x-axis). Each point shows the mean titer and standard error of the mean for each group (n = 4/group). Vaccinated group means in a, b and d were compared to naïve animals with a two-way ANOVA followed by a Dunnett’s multiple comparison test (multiple time points) and a one-way ANOVA followed by a Dunnett’s multiple comparison test was used in c (single time point). The asterisks refer to the level of significance (zeros after the decimal point of the p-value): *P ≤ 0.05; **P ≤ 0.01; ***P ≤ 0.001; ****P ≤ 0.0001
Fig. 5
Fig. 5
Antibody breadth measured by ELISA and neutralization. Titers are plotted on the y-axis. LAIV followed by IIV-vaccinated animals are shown as blue circles (empty circles, without adjuvant; full circles, with adjuvant). IIV followed by IIV-vaccinated animals are shown as red triangles (empty triangles, without adjuvant; full triangles, with adjuvant). Animals that received only the cH9/1 HA prime are shown as white diamonds. TIV-vaccinated animals are shown as green squares and naïve animals are shown as white squares. White bars indicate the GMTs of each group. Each point shows the titer for one animal (n = 4/group). The gray dashed line indicates the limit of detection. Titers were measured in pre-challenge sera (day 70). a H1 ELISA IgG titer. b H2 ELISA IgG titer. c H18 ELISA IgG titer. d H3 ELISA IgG titer. e pH1N1 neutralization titer. Groups were compared to naive animals with a one-way ANOVA followed by a Dunnett’s multiple comparison test. The asterisks refer to the level of significance (zeros after the decimal point of the p-value): *P  ≤ 0.05; **P  ≤ 0.01; ***P  ≤ 0.001; ****P  ≤ 0.0001
Fig. 6
Fig. 6
Virus titers post pH1N1 (104 PFU) challenge. Viral titers were measured by plaque assay. LAIV followed by IIV-vaccinated animals are shown as blue circles (empty circles, without adjuvant; full circles, with adjuvant). IIV followed by IIV-vaccinated animals are shown as red triangles (empty triangles, without adjuvant; full triangles, with adjuvant). Animals that received only the cH9/1 HA prime are shown as white diamonds. TIV-vaccinated animals are shown as green squares and naïve animals are shown as white squares. White bars indicate the GMTs of each group. Each point shows the titer for one animal (n = 4/group). The gray dashed line indicates the limit of detection. a Nasal wash viral titers. Viral titers in nasal washes were measured on day 1 and day 3 post infection. b Oropharyngeal swab viral titers. Viral titers in oropharyngeal swabs were measured on day 1 and day 3 post infection. c Nasal turbinate viral titers. Viral titers in nasal turbinates were measured on day 4 post challenge. d Olfactory bulb viral titers. Viral titers in olfactory bulbs were measured on day 4 post challenge. e Trachea viral titers. Viral titers in the trachea were measured on day 4 post challenge. f Lung viral titers. Viral titers in the left medial bronchus of the upper lobe of the lung were measured on day 4 post challenge. Groups in a and b were compared to naïve animals with a two-way ANOVA (multiple time points), followed by a Dunnett’s multiple comparison test. Groups in c, d, e and f (single time point) were compared to naive animals with a one-way ANOVA followed by a Dunnett’s multiple comparison test. The asterisks refer to the level of significance (zeros after the decimal point of the p-value): *P  ≤ 0.05; **P  ≤ 0.01; ***P  ≤ 0.001; ****P  ≤ 0.0001
Fig. 7
Fig. 7
Virus titers post high dose pH1N1 (106 PFU) challenge. Viral titers were measured by plaque assay. Naïve animals are shown as white squares, LAIV/IIV-vaccinated animals with adjuvant are shown full blue circles and LAIV/IIV-vaccinated animals are shown empty blue circles of the x-axis. White bars indicate the GMTs of each group. The gray line indicates the limit of detection. a Nasal wash viral titers. Viral titers in nasal washes were measured on day 1 and day 3 post infection. b Nasal turbinate viral titers. Viral titers in nasal turbinates were measured on day 4 post challenge. c Trachea viral titers. Viral titers in the trachea were measured on day 4 post challenge. d Lung viral titers. Viral titers in the left medial bronchus of the upper lobe of the lung were measured on day 4 post challenge. Groups in a were compared to naïve animals with a two-way ANOVA (multiple time points), followed by a Dunnett’s multiple comparison test. Groups in b, c and d (single time point) were compared to naive animals with a one-way ANOVA followed by a Dunnett’s multiple comparison test. The asterisks refer to the level of significance (zeros after the decimal point of the p-value): *P ≤ 0.05; **P ≤ 0.01; ***P ≤ 0.001; ****P ≤ 0.0001

References

    1. WHO. Influenza (Seasonal) Fact sheet 211. http://www.who.int/mediacentre/factsheets/fs211/en/.
    1. Gerdil C. The annual production cycle for influenza vaccine. Vaccine. 2003;21:1776–1779. doi: 10.1016/S0264-410X(03)00071-9. - DOI - PubMed
    1. Tricco AC, et al. Comparing influenza vaccine efficacy against mismatched and matched strains: a systematic review and meta-analysis. BMC Med. 2013;11:153. doi: 10.1186/1741-7015-11-153. - DOI - PMC - PubMed
    1. Krammer F, Palese P. Advances in the development of influenza virus vaccines. Nat. Rev. Drug Discov. 2015;14:167–182. doi: 10.1038/nrd4529. - DOI - PubMed
    1. Ekiert DC, Wilson IA. Broadly neutralizing antibodies against influenza virus and prospects for universal therapies. Curr. Opin. Virol. 2012;2:134–141. doi: 10.1016/j.coviro.2012.02.005. - DOI - PMC - PubMed