. 2017 Sep 18;7(2):376-387.
doi: 10.11138/mltj/2017.7.2.376. eCollection 2017 Apr-Jun.

Perivascular Adductor Longus muscle injury: Ultrasound and Magnetic Resonance Imaging findings

Affiliations

Perivascular Adductor Longus muscle injury: Ultrasound and Magnetic Resonance Imaging findings

Gabriele Mattiussi et al. Muscles Ligaments Tendons J. .

Abstract

Background: Muscle injuries affecting the Adductor Longus are not all localised at the level of the proximal myotendinous junction and enthesis. Thus, the main purpose of this article was to raise awareness of the imaging features of the Perivascular Adductor Longus muscle injury, which currently remains widely under-recognised.

Methods: The ultrasound (US) and Magnetic Resonance imaging (MRI) images of five professional football players were retrospectively reassessed to identify distinctive imaging details of the Perivascular Adductor Longus muscle injury. Complementary information regarding the traumatic mechanics is presented as well.

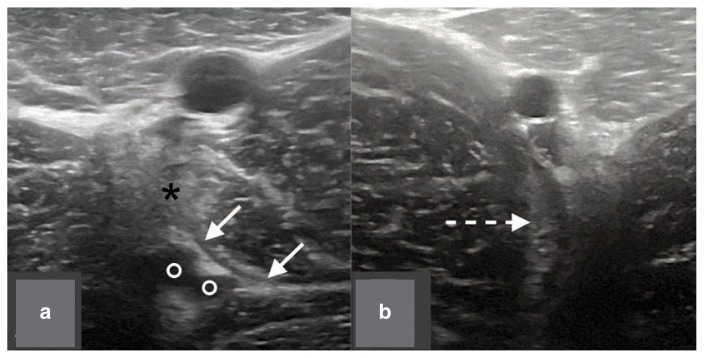
Results: All the players presented similar US images in the first seventy-two hours: loss of ecostructural integrity of the lateral epimysium, in proximity to the femoral vessels, and perilesional oedema were the main pathological findings. The injury lead to the formation of a hypoechoic, intramuscular haematoma in three of the subjects. Anyway, this was detectable only after five days, or later. Moreover, MRI sequences showed long-standing haematoma-related signal alterations which were also observable at three months after trauma. Typically, kicking was the traumatic motor task.

Conclusions: The main practical value of this technical note is to compensate for the lack of studies concerning the Perivascular Adductor Longus muscle injury. Promptly identifying its typical imaging features is crucial in order to establish the correct diagnosis and to implement a highly specific rehabilitative program.

Level of evidence: V.

Keywords: magnetic resonance imaging; soft tissue injuries; sports injuries; thigh; ultrasonography.


Conflict of interest statement

Conflict of interest The Authors declare that they have no conflict of interest.

Figures

Figure 1
Figure 1
Cross-sectional ultrasound anatomy of the Adductor Longus (AL), proximal third, in a 25-year-old male healthy volunteer. The muscle is easily recognizable as its intramuscular tendon (hyperechoic structure indicated by the arrow) runs through the muscle belly; this has a wavy shape and runs substantially in the coronal plane of AL, almost parallel to the long axis of the muscle. At this level, the AL is still divided from the femoral vessels (asterisk) by the Pectineus muscle (PE). Virtual Convex technology was used to capture this image. AB = Adductor Brevis.
Figure 2
Figure 2
Cross-sectional ultrasound anatomy of the Adductor Longus (AL), middle third, in a 25-year-old male healthy volunteer. The muscle makes anatomical contact with the Vastus Medialis (VM), the femoral vein (v) and the femoral artery (a). Even the saphenous nerve (s), the final branch of the femoral nerve, can be observed. The Sartorious muscle (SA) acts as a “roof” to the neurovascular bundle. It can be seen how the lateral aspects of the AL (inside the dashed rectangle) are not easily observable; this is because the artifact induced by the femoral vein limits their visualisation and due to the fact that they are already at about four centimetres of depth (see parameters of the device on the right).
Figure 3
Figure 3
The “Push-to-View” tip, performed in a 25-year-old male healthy volunteer. The ultrasonographer applies pressure to the muscle belly of the Sartorius (SA), using the probe; note the evident flattening of the muscle belly onto the femoral artery (a). In doing so, the blood flow of the femoral vein (asterisk) is almost interrupted, as well as the resulting posterior acoustic enhancement artifact. As a result, the epimysium and perimysium in the lateral portions of the Adductor Longus (AL) become easily observable. In addition to this, thanks to the compression of tissues, even the deep femoral vessels (small circles) and the obturator nerve (large circle) are visible deeper. Therefore, the “perivascular” portion of the AL is now completely observable.
Figure 4
Figure 4
Cross-sectional ultrasound performed 48 hours post trauma showing the ultrasonographical features of the Perivascular Adductor Longus muscle injury in the acute phase. The eco-destructuration of the Adductor Longus (AL) epimysium, which appears hypoechogenic, is indicated by the solid arrows and extends from the compressed femoral vein (asterisk) to the deep femoral vessels (circles). Oedema of AL within the muscle belly is visible in the vicinity of the lesion (dashed arrow). Due to this, the perimysium is not locally distinguishable from the muscle fibres. The hyperechoic region below the vessels and facing the Vastus Medialis (VM) is likely due to the posterior acoustic enhancement artifact induced by the femoral artery. Accordingly, at this site, the presence of interfascial liquid should not be confirmed using ultrasound.
Figure 5 a, b
Figure 5 a, b
Practical value of the Push-to-View tip. Cross-sectional ultrasound images acquired in acute phase with (a) or without (b) the use of the tip. In (a), the eco-destructuration of the epimysium is well displayed (indicated by the solid arrows) as well as the intramuscular oedema (dashed arrow). In (b), the posterior acoustic enhancement artifact induced by the femoral vein (asterisk) significantly impairs the visualisation of the lesion; even the signs of the intramuscular oedema (dashed arrow), though present, are very weak in comparison. In this case, the possibility of misdiagnosis is certainly substantial.
Figure 6 a, b
Figure 6 a, b
Ultrasound diagnostic difficulties in the analysis of the Perivascular Adductor Longus muscle injury, in acute phase. In (a), the compression of the femoral vein causes the formation of a wide echogenic area just under it (black asterisk), which prevents ideal visualisation of the injury. Despite this, the deepest part of the epymsium is still visible and appears hypoechogenic (solid arrows). The ultrasonographer must rule out that it is not from a horizontal blood vessel, originating from the deep femoral vessels (circles). In (b), while the eco-destructuration of the epymisium is quite evident, the intramuscular perilesional oedema (dotted arrow) is barely visible. There is also the possibility that this sign is mistaken for the posterior acoustic enhancement artifact caused by vessels.
Figure 7
Figure 7
Cross-sectional ultrasound performed 7 days post trauma showing a high grade Perivascular Adductor Longus (AL) muscle injury. A wide anechoic region (solid arrow) is visible within the AL muscle belly. The sign is compatible with the presence of fluid, most likely blood, resulting from local lesion of the muscle fibres.
Figure 8
Figure 8
Elastosonography of an intramuscular haematoma within the lateral peripheral aspects of the Adductor Longus (AL). The fluid collection (full arrow) appears easily circumscribed as corresponding to the blue region, surrounded by green/red areas. Such collection is considered hard, i.e., with high mechanical resistance, potentially interpretable as a dense and not compressible liquid.
Figure 9 a–e
Figure 9 a–e
Fat-suppressed T2-weighted transversal consecutive sections showing the MRI features of Perivascular Adductor Longus (AL) muscle injury, in the acute phase. In a and c the intramuscular oedema, while in b and d the interfascial fluid, are observable. In c and d the portions of interest of sections a and b (white squares) are magnified. In c it is worth noting how the oedematous area, corresponding to the region of increased intramuscular signal, does not extend to the Vastus Medialis, excluding lesions affecting this muscle. In d the increase signal of the lateral epymisium mimics a pseudo-thickening of the fascia, which can be better assessed if compared with the same healthy portion of the contralateral limb (e).
Figure 10 a–e
Figure 10 a–e
Short tau inversion recovery transversal MRI consecutive sequences (corresponding to those presented in Figure 9). By comparing the sequences, sections a and b clearly show an increase in signal intensity in the lateral peripheral region of the Adductor Longus (AL). The sections contained in the black squares are magnified and show the oedema (c) and the interfascial liquid (d) that specifically extend from the superficial femoral vessels to the deep ones (hence the “perivascular” prefix). This should be considered as the site to be reassessed in the sub-acute phase in order to evaluate the potential delayed intramuscular haematoma formation or interfascial fluid accumulation. The comparison with the contralateral limb (e) is always extremely useful as the signal alterations may be modest at this stage or present only in a few single sequences. In general, whenever possible, an MRI of both limbs should be carried out: the possible misinterpretation is that the interfascial liquid is mistaken for a blood vessel.
Figure 11 a, b
Figure 11 a, b
Short tau inversion recovery sagittal MRI sequences acquired 30 days after trauma. In a the persistent and isolated intramuscular oedema (black asterisk), which extends for the entire section of the muscle, is visible. In b, the haematoma (large bright area) can easily be spotted, just slightly below the surface to the femoral artery and in relation with it.
Figure 12 a–c
Figure 12 a–c
Short tau inversion recovery axial MRI sequences acquired at 30 days after trauma, from proximal to distal. The proximal section (a) shows the site as being likely to have been affected by the primary injury, with presence of interfascial effusion and intramuscular oedema, extending for about a third of the muscle belly. In b, fluid spillage, enclosed in the muscle belly, is clearly visible (bright area). It is situated just below the femoral vessels (two black points), possibly accumulated due to gravity. Just below the plausible haematoma, only a minimum increase of signal is observable (c) at epimysial level.
Figure 13 a, b
Figure 13 a, b
Coronal MRI sequences acquired 30 days post trauma. Large haematomas (white arrow) are recognizable both in STIR (a) and in T1-weighted (b) sequences, as hyperintense and hypointense areas, respectively.

References

    1. Dimitrakopoulou A, Schilders E, Bismil Q, Talbot JC, Kazakos K. An unusual case of enthesophyte formation following an adductor longus rupture in a high-level athlete. Knee Surg Sports Traumatol Arthrosc. 2010;18:691–693. - PubMed
    1. Thorborg K, Petersen J, Nielsen MB, Hölmich P. Clinical recovery of two hip adductor longus ruptures: a case-report of a soccer player. BMC Research Notes. 2013;6:205. - PMC - PubMed
    1. Serner A, Tol JL, Jomaah N, Weir A, Whiteley R, Thorborg K, et al. Diagnosis of Acute Groin Injuries: a prospective study of 110 athletes. Am J Sports Med. 2015;43(8):1857–1864. - PubMed
    1. Charnock BL, Lewis CL, Garrett JRWE, Queen RM. Adductor longus mechanics during the maximal effort soccer kick. Sports Biomech. 2009;8(3):223–234. - PubMed
    1. Pesquer L, Reboul G, Silvestre A, Poussange N, Meyer P, Dallaudière B. Imaging of adductor-related groin pain. Diagn Interv Imaging. 2015;96:861–869. - PubMed

LinkOut - more resources