. 2017 Dec 21;23(1):12.
doi: 10.3390/molecules23010012.

Anticoagulants Influence the Performance of In Vitro Assays Intended for Characterization of Nanotechnology-Based Formulations

Affiliations

Anticoagulants Influence the Performance of In Vitro Assays Intended for Characterization of Nanotechnology-Based Formulations

Edward Cedrone et al. Molecules. .

Abstract

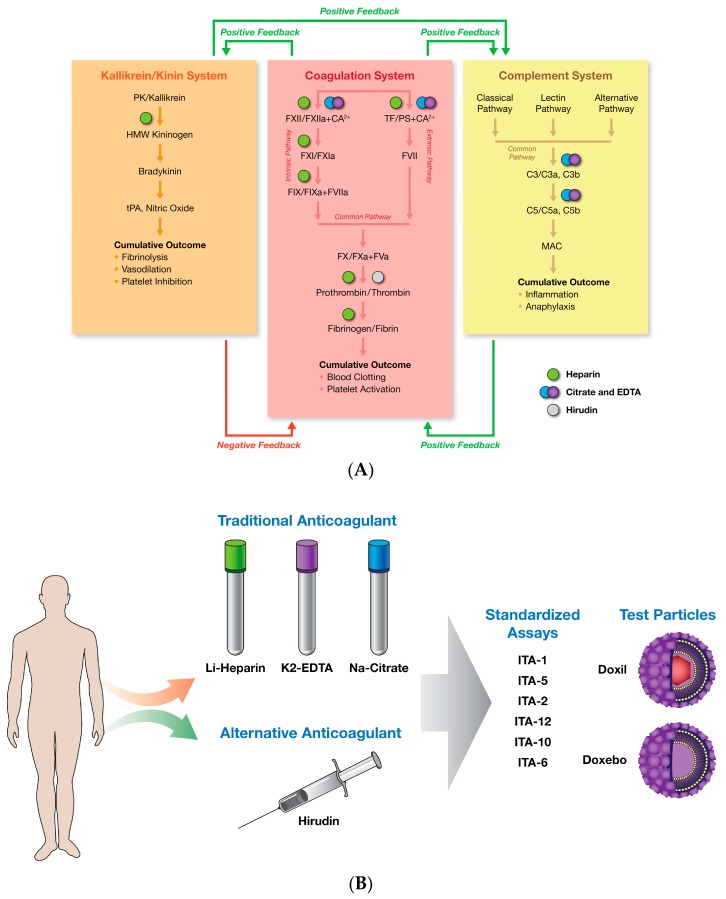
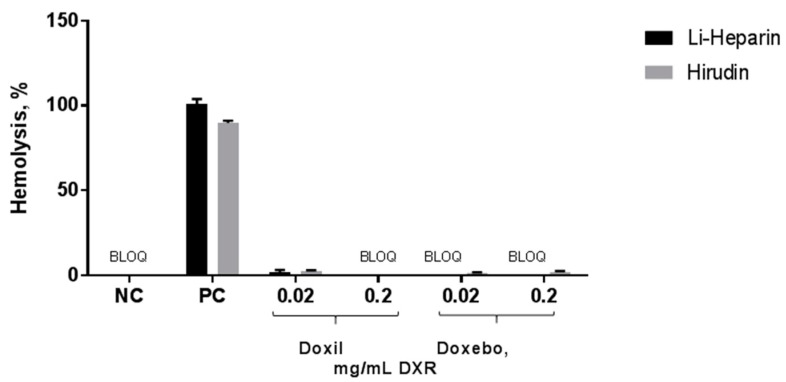
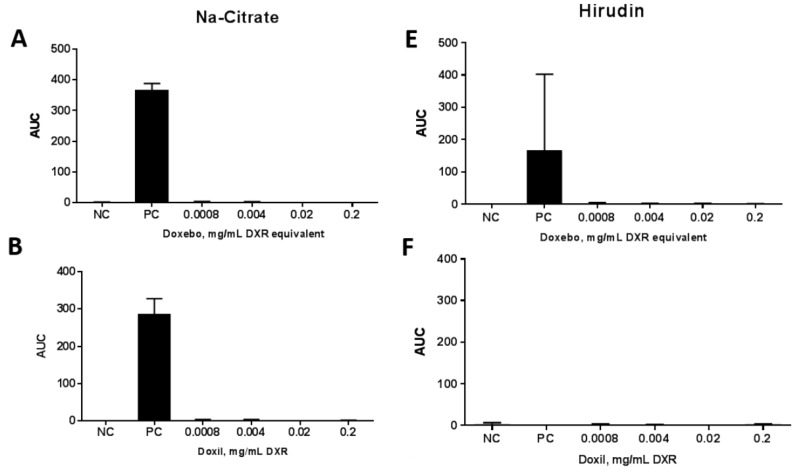
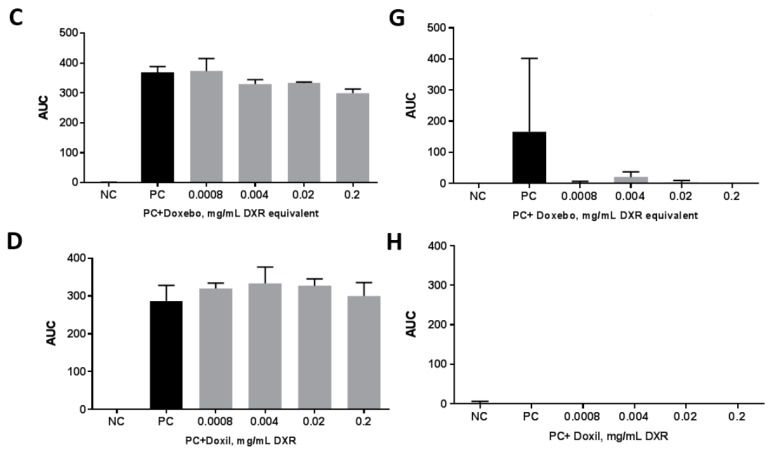
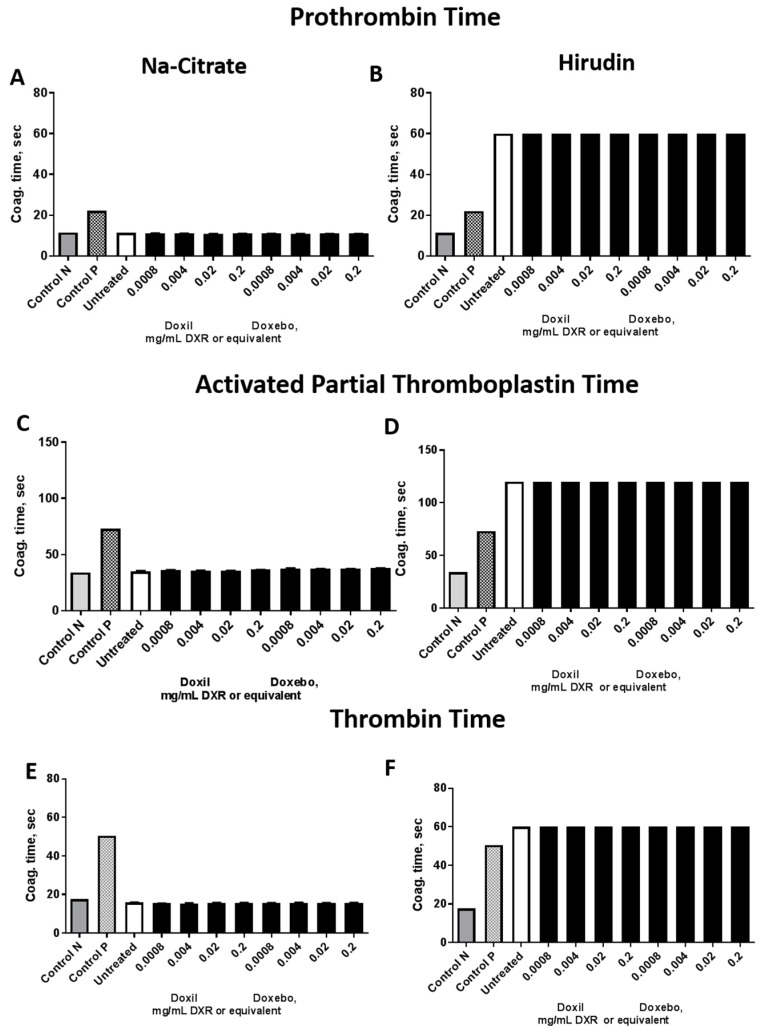
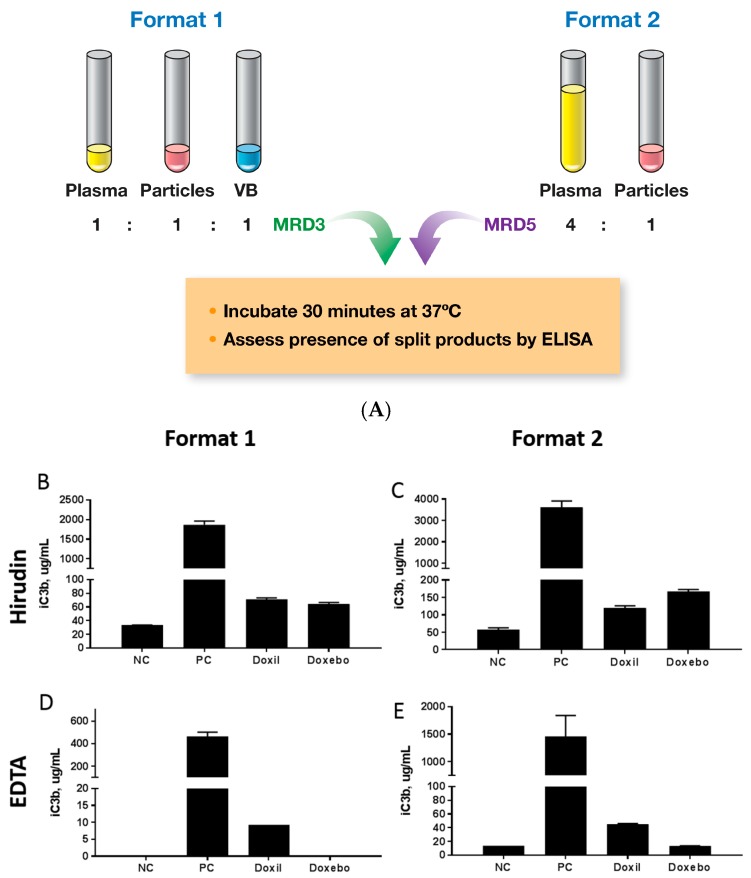
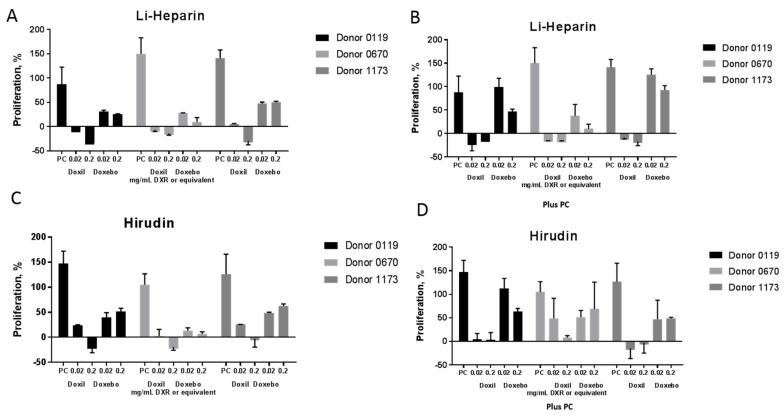
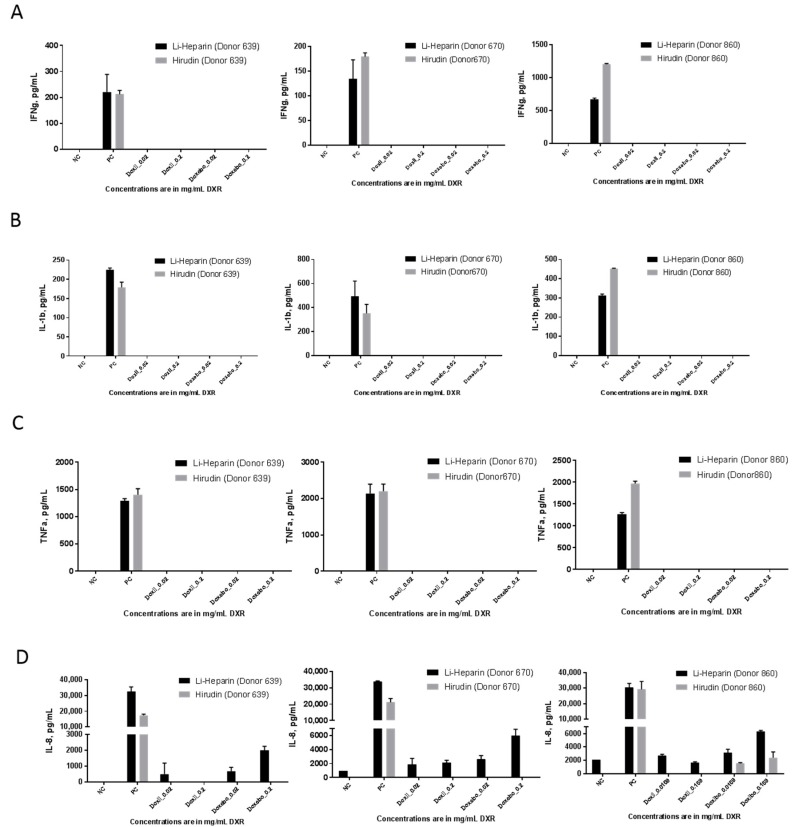
The preclinical safety assessment of novel nanotechnology-based drug products frequently relies on in vitro assays, especially during the early stages of product development, due to the limited quantities of nanomaterials available for such studies. The majority of immunological tests require donor blood. To enable such tests one has to prevent the blood from coagulating, which is usually achieved by the addition of an anticoagulant into blood collection tubes. Heparin, ethylene diamine tetraacetic acid (EDTA), and citrate are the most commonly used anticoagulants. Novel anticoagulants such as hirudin are also available but are not broadly used. Despite the notion that certain anticoagulants may influence assay performance, a systematic comparison between traditional and novel anticoagulants in the in vitro assays intended for immunological characterization of nanotechnology-based formulations is currently not available. We compared hirudin-anticoagulated blood with its traditional counterparts in the standardized immunological assay cascade, and found that the type of anticoagulant did not influence the performance of the hemolysis assay. However, hirudin was more optimal for the complement activation and leukocyte proliferation assays, while traditional anticoagulants citrate and heparin were more appropriate for the coagulation and cytokine secretion assays. The results also suggest that traditional immunological controls such as lipopolysaccharide (LPS ) are not reliable for understanding the role of anticoagulant in the assay performance. We observed differences in the test results between hirudin and traditional anticoagulant-prepared blood for nanomaterials at the time when no such effects were seen with traditional controls. It is, therefore, important to recognize the advantages and limitations of each anticoagulant and consider individual nanoparticles on a case-by-case basis.

Keywords: complement activation; cytokines; hemolysis; immunotoxicity; in vitro; leukocyte proliferation; liposomes; nanoparticles; plasma coagulation; platelet aggregation; safety.


Conflict of interest statement

The authors declare no conflict of interest.

Figures

Figure 1
Figure 1
Rationale and study design. (A) Anticoagulants and their effects on various components of complement, plasma coagulation, and kinin/kallikrein systems are shown in this diagram. There is a cross-talk between these systems. Activation of the coagulation provides positive (i.e., agonist) feedback to the complement and kinin/kallikrein systems. Likewise, activated complement system stimulates coagulation, while activation of kinin/kallikrein system can also activate complement system. Cumulative outcome of the kallikrein/kinin system supplies a negative (i.e., inhibitory) feedback to the coagulation system to stop the blood clotting process and maintain hemostasis. Colored dots representing specific anticoagulant are shown above their respective protein targets. Unlike heparin, citrate, and EDTA, hirudin has a single target affecting only the coagulation cascade; (B) Schematic depiction of the study design. F—factor; C—complement; ITA—immunotoxicity assay from the standardized assay cascade (https://ncl.cancer.gov/resources/assay-cascade-protocols); TF—tissue factor; PS—phosphatidylserine; EDTA—ethylene diamine tetraacetic acid; PK—prekallikrein; tPA—tissue plasminogen activator; HMW—high molecular weight; MAC—membrane attack complex; K2—potassium ions.
Figure 2
Figure 2
Hemolysis assay. Various, clinically relevant concentrations of Doxil and Doxebo were tested in the hemolysis assay in order to estimate their potential effects on the integrity of red blood cells. Three independent samples were prepared for each nanoparticle concentration and analyzed in duplicate (%CV < 20). Shown is mean (n = 3) ± SD. Triton X-100 was used as a positive control (PC). PBS was used as the negative control (NC). BLOQ: Below limit of quantification.
Figure 3
Figure 3
Platelet aggregation assay. Various clinically relevant concentrations of Doxil and Doxebo were spiked into platelet reach plasma (PRP), and platelet aggregation was monitored in real time during six minutes of sample incubation at 37 °C (A,B,E,F). Particle effects on collagen-induced platelet aggregation were tested by adding the collagen into PRP spiked with test nanomaterials (C,D,G,H). The AUC of nanoparticle-treated plasma (A,B,E,F) were compared to the negative control sample (NC). The AUC of the collagen-treated plasma pre-incubated with nanoparticles (C,D,G,H) was compared to the AUC of the PC. PC was collagen. NC was PBS. Plasma anticoagulated with Na-citrate (AD) was compared to plasma anticoagulated with hirudin (EH). Blood from the same donor volunteers was used for all tests. Doxebo and Doxil samples were conducted on different days due to the low throughput of the light transmission aggregometry. Shown is mean ± SD (n = 3).
Figure 3
Figure 3
Platelet aggregation assay. Various clinically relevant concentrations of Doxil and Doxebo were spiked into platelet reach plasma (PRP), and platelet aggregation was monitored in real time during six minutes of sample incubation at 37 °C (A,B,E,F). Particle effects on collagen-induced platelet aggregation were tested by adding the collagen into PRP spiked with test nanomaterials (C,D,G,H). The AUC of nanoparticle-treated plasma (A,B,E,F) were compared to the negative control sample (NC). The AUC of the collagen-treated plasma pre-incubated with nanoparticles (C,D,G,H) was compared to the AUC of the PC. PC was collagen. NC was PBS. Plasma anticoagulated with Na-citrate (AD) was compared to plasma anticoagulated with hirudin (EH). Blood from the same donor volunteers was used for all tests. Doxebo and Doxil samples were conducted on different days due to the low throughput of the light transmission aggregometry. Shown is mean ± SD (n = 3).
Figure 4
Figure 4
Plasma coagulation time. Various clinically relevant concentrations of Doxil and Doxebo were tested in prothrombin time, thrombin time, and activated partial thromboplastin time assays. For each nanoparticle concentration, three independent samples were prepared and analyzed in duplicate (%CV < 5). Each bar represents the mean (n = 3) ± SD. Normal plasma standard (Control N) and abnormal plasma standard (Control P) were used for instrument controls. Plasma pooled from at least three donors was either untreated (Untreated) or treated with nanoparticles at the concentrations shown. Prothrombin time assay in Na-Citrate (A) and hirudin (B) anticoagulated plasma; Activated Partial Thromboplastin Time in Na-citrate (C) and hirudin (D) anticoagulated; Thrombin time assay in Na-citrate (E) and hirudin (F) anticoagulated plasma.
Figure 5
Figure 5
Complement activation. Various clinically relevant concentrations of Doxil and Doxebo were tested in vitro to estimate their effects on the complement system. PBS was used as the negative control (NC). Cobra venom factor (CVF) was used as the positive control (PC). Three independent samples were prepared for each concentration and analyzed in duplicate (%CV < 20). Particle concentration was 0.67 mg/mL of doxorubicin or equivalent for Doxil or Doxebo, respectively. Shown is the mean response (n = 3) ± SD. (A) Schematic of two assay formats used in this experiment; The results of the assay format 1 using hirudin and EDTA anticoagulants (B,D, respectively); The results of the assay format 2 using hirudin- and EDTA-anticoagulants (C,E, respectively). BLOQ = below limit of quantification; VB = veronal buffer; MRD = minimum required dilution.
Figure 6
Figure 6
Leukocyte Proliferation PBMC from three healthy donor volunteers was cultured in the presence of nanoparticles and controls for 72 h. Several clinically relevant concentrations of nanoparticles were tested. Following incubation, the proliferation of leukocytes was estimated using the MTT reagent. The percent proliferation was calculated by comparing the mean optical density of test samples to that of the baseline. PBS was used at the negative control (NC). Mitogen phytohemagglutinin (PHA-M) at a concentration of 10 µg/mL was used as the positive control (PC). The experiment included two parts. In part one, the particle’s ability to induce leukocyte proliferation was studied. This part is shown in graphs (A,C) as Doxil or Doxebo treatments alone. In part two, the ability of nanoparticles to influence mitogen-induced proliferation was assessed. This part is shown in graphs (B,D) as Doxil or Doxebo plus PC. The data shown in graphs (A,B) were generated using blood coagulated with Li-heparin. The data shown in graphs (C,D) were produced using blood anticoagulated with hirudin. Three independent samples were prepared for each treatment and analyzed in duplicate. Percent CV between individual replicates was less than 25. Shown is the mean response ± SD (n = 3).
Figure 7
Figure 7
Cytokine response in PBMC. Doxebo and Doxil were tested at two clinically relevant concentrations in the PBMC cultures derived from the blood of three healthy donor volunteers. Donor number is shown in parentheses. PBS was used as the negative control (NC), 10 ng/mL E. coli K12 LPS and 10 μg/mL PHA-M were used as PC. Supernatants were analyzed by ELISA to estimate concentrations of IFNγ (A); IL1-β (B); TNFα (C); and IL-8 (D). Three independent samples were prepared for each concentration and analyzed in duplicate (%CV < 20). Shown is the mean response (n = 3) ± SD. BLOQ = below the limit of quantification.

References

    1. Van Balveren J.A., Huijskens M.J., Gemen E.F., Pequeriaux N.C., Kusters R. Effects of time and temperature on 48 routine chemistry, haematology and coagulation analytes in whole blood samples. Ann. Clin. Biochem. 2017;54:448–462. doi: 10.1177/0004563216665868. - DOI - PubMed
    1. Wallen N.H., Ladjevardi M., Albert J., Broijersen A. Influence of different anticoagulants on platelet aggregation in whole blood: A comparison between citrate, low molecular mass heparin and hirudin. Thromb. Res. 1997;87:151–157. doi: 10.1016/S0049-3848(97)00114-X. - DOI - PubMed
    1. Kenne E., Renne T. Factor XII: A drug target for safe interference with thrombosis and inflammation. Drug Discov. Today. 2014;19:1459–1464. doi: 10.1016/j.drudis.2014.06.024. - DOI - PubMed
    1. Bexborn F., Engberg A.E., Sandholm K., Mollnes T.E., Hong J., Ekdahl K.N. Hirudin versus heparin for use in whole blood in vitro biocompatibility models. J. Biomed. Mater. Res. A. 2009;89:951–959. doi: 10.1002/jbm.a.32034. - DOI - PubMed
    1. Carteaux J.P., Gast A., Tschopp T.B., Roux S. Activated clotting time as an appropriate test to compare heparin and direct thrombin inhibitors such as hirudin or Ro 46-6240 in experimental arterial thrombosis. Circulation. 1995;91:1568–1574. doi: 10.1161/01.CIR.91.5.1568. - DOI - PubMed

LinkOut - more resources