. 2017 Dec 21;12(12):e0189601.
doi: 10.1371/journal.pone.0189601. eCollection 2017.

Impact of diabetes on gingival wound healing via oxidative stress

Affiliations

Impact of diabetes on gingival wound healing via oxidative stress

Daisuke Kido et al. PLoS One. .

Abstract

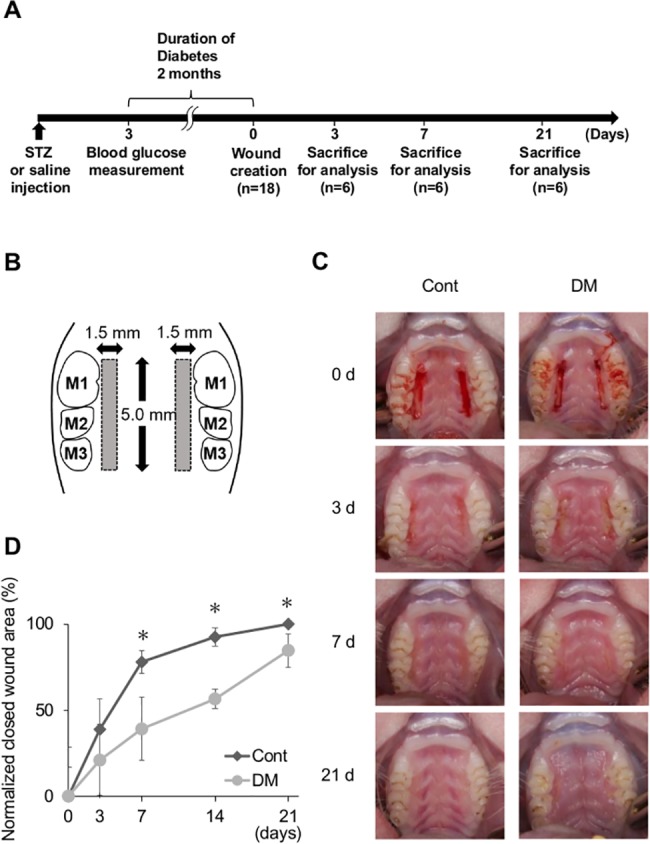
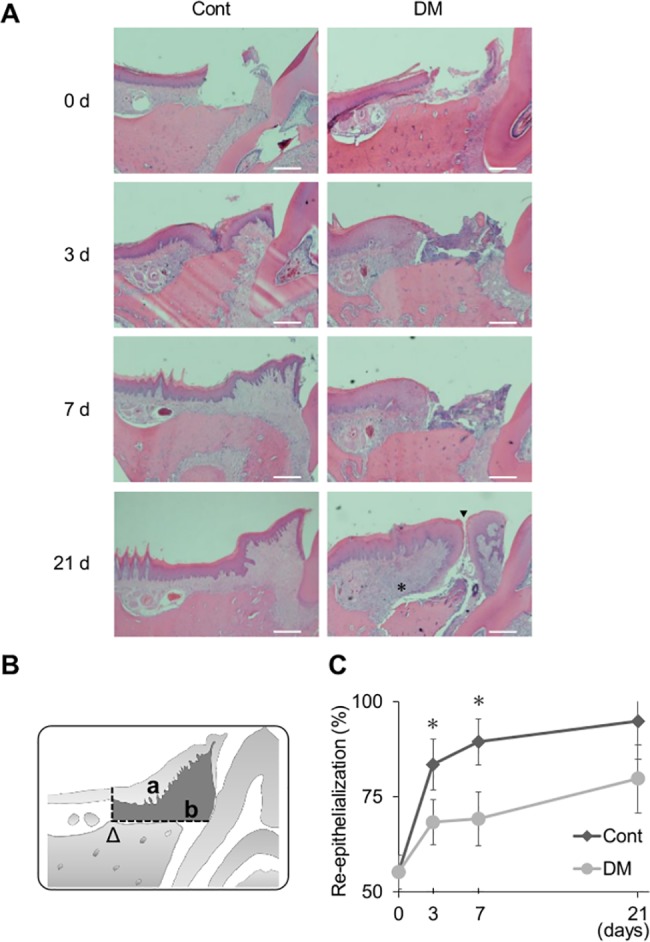
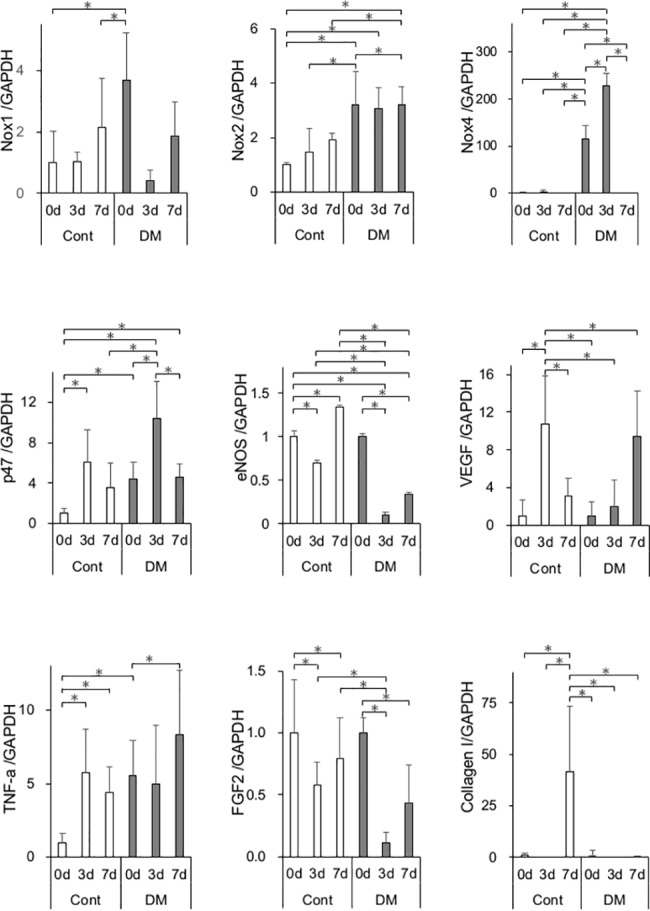
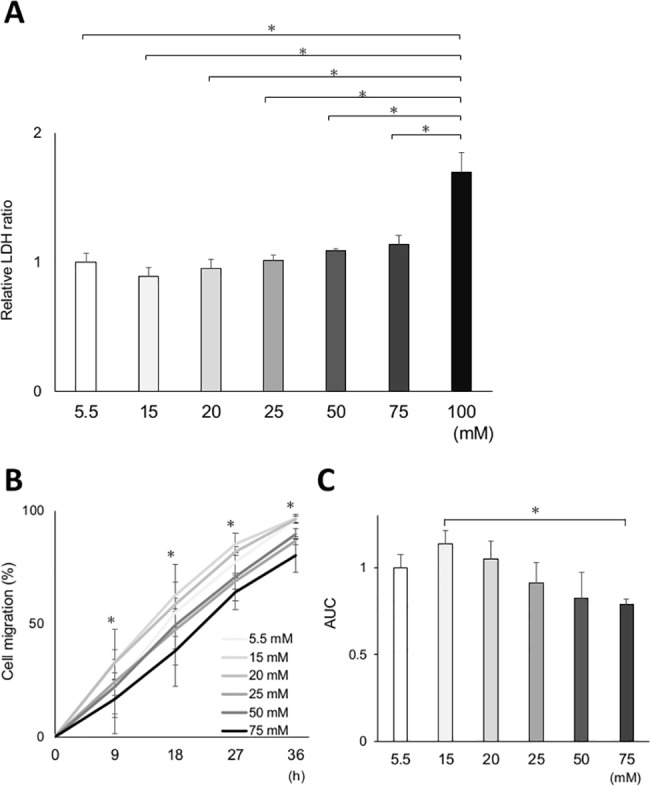
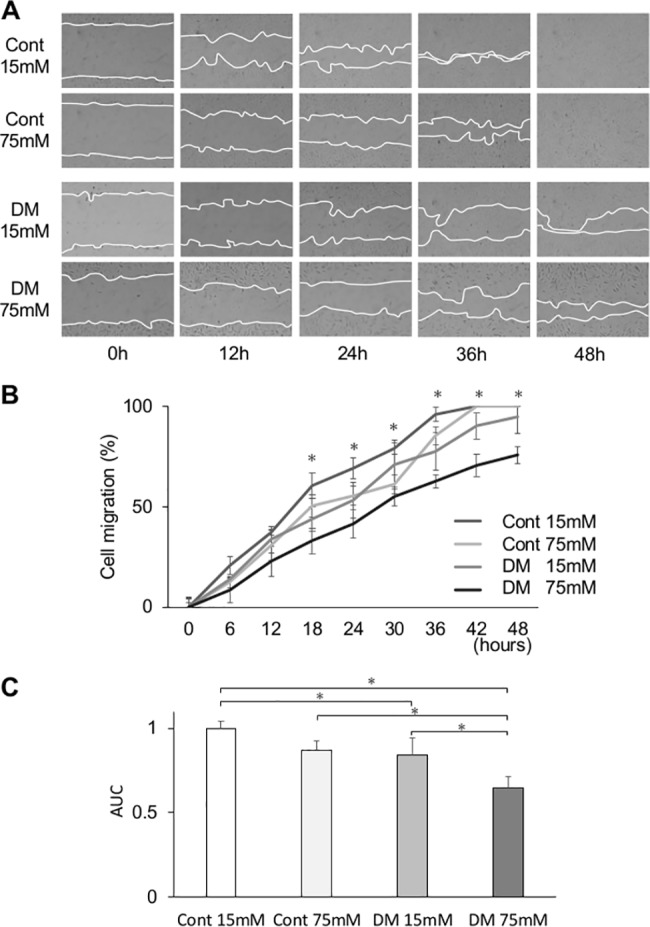
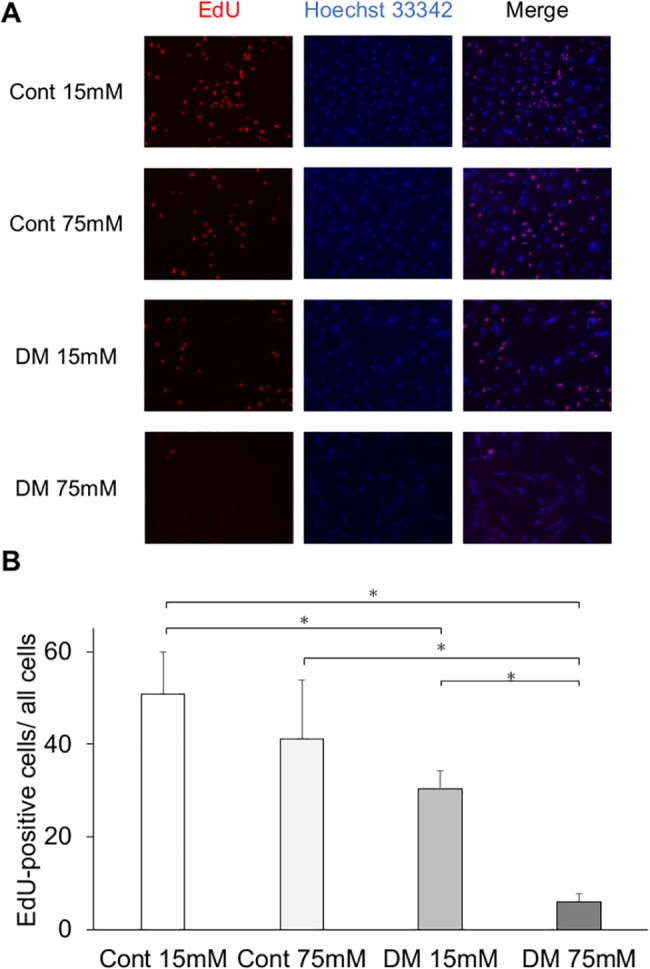
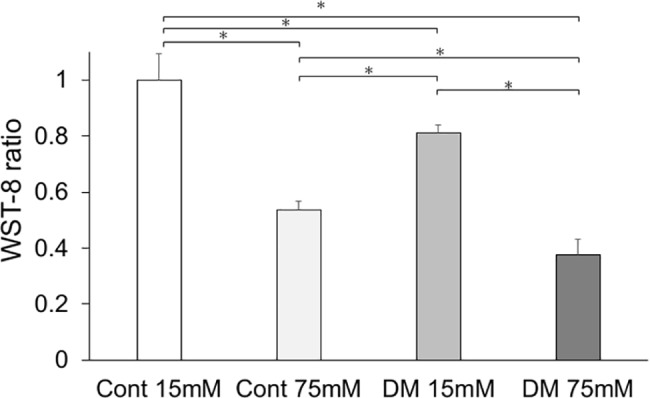
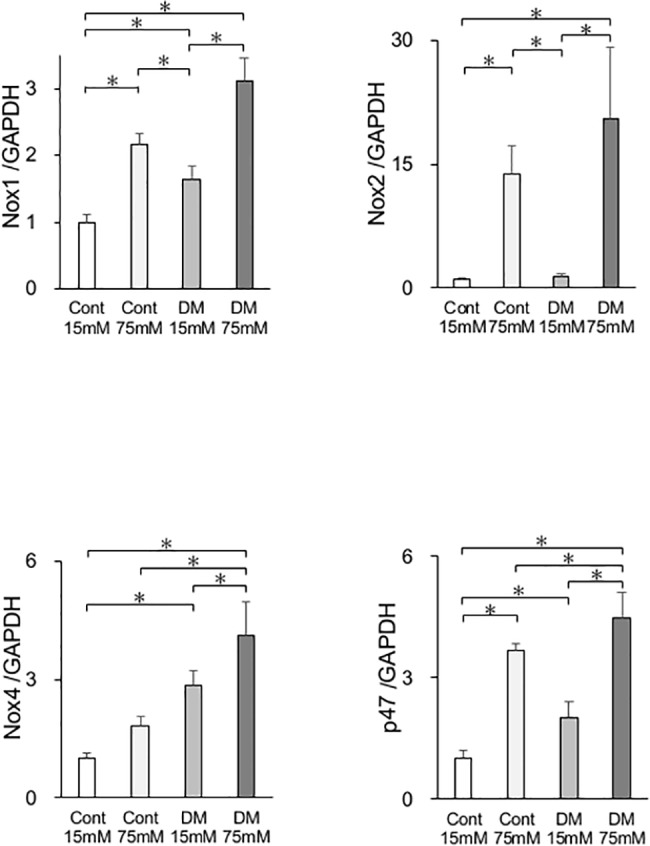
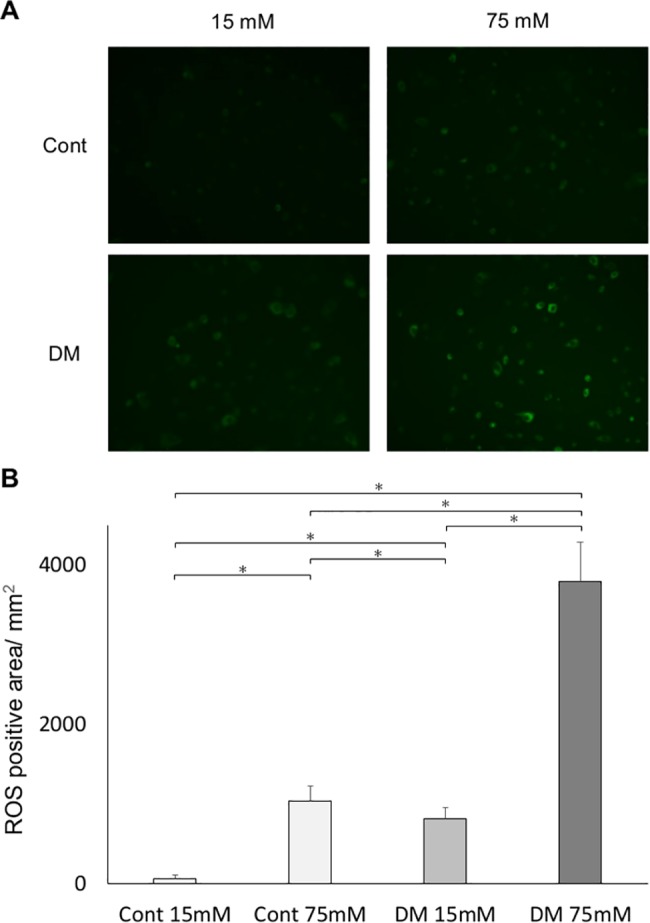
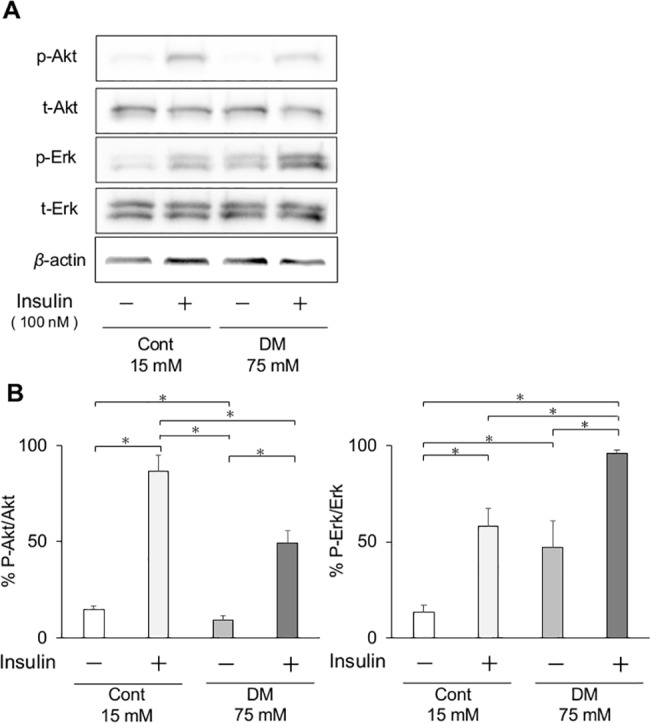
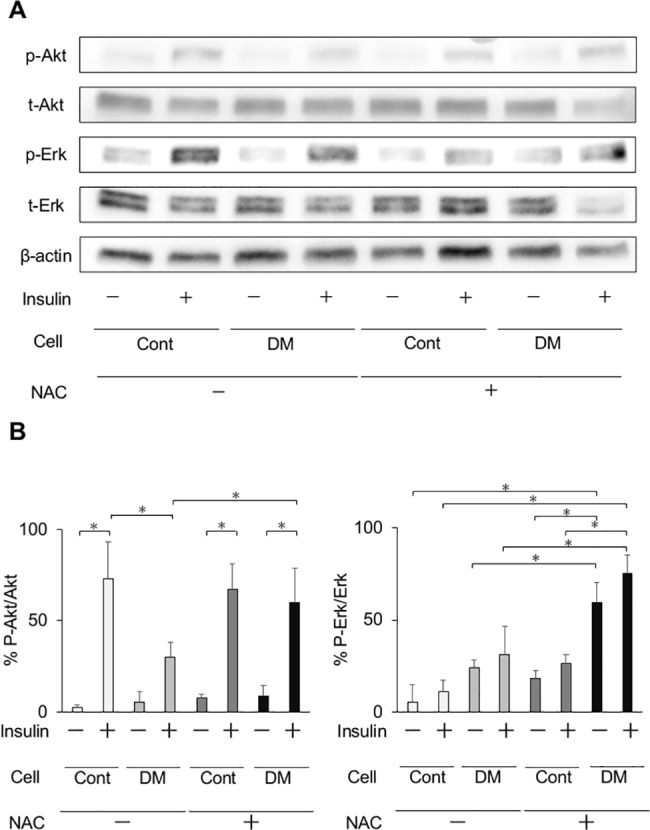
The aim of this study is to investigate the mechanisms linking high glucose to gingival wound healing. Bilateral wounds were created in the palatal gingiva adjacent to maxillary molars of control rats and rats with streptozotocin-induced diabetes. After evaluating postsurgical wound closure by digital imaging, the maxillae including wounds were resected for histological examinations. mRNA expressions of angiogenesis, inflammation, and oxidative stress markers in the surgical sites were quantified by real-time polymerase chain reaction. Primary fibroblast culture from the gingiva of both rats was performed in high glucose and normal medium. In vitro wound healing and cell proliferation assays were performed. Oxidative stress marker mRNA expressions and reactive oxygen species production were measured. Insulin resistance was evaluated via PI3K/Akt and MAPK/Erk signaling following insulin stimulation using Western blotting. To clarify oxidative stress involvement in high glucose culture and cells of diabetic rats, cells underwent N-acetyl-L-cysteine treatment; subsequent Akt activity was measured. Wound healing in diabetic rats was significantly delayed compared with that in control rats. Nox1, Nox2, Nox4, p-47, and tumor necrosis factor-α mRNA levels were significantly higher at baseline in diabetic rats than in control rats. In vitro study showed that cell proliferation and migration significantly decreased in diabetic and high glucose culture groups compared with control groups. Nox1, Nox2, Nox4, and p47 expressions and reactive oxygen species production were significantly higher in diabetic and high glucose culture groups than in control groups. Akt phosphorylation decreased in the high glucose groups compared with the control groups. Erk1/2 phosphorylation increased in the high glucose groups, with or without insulin treatment, compared with the control groups. Impaired Akt phosphorylation partially normalized after antioxidant N-acetyl-L-cysteine treatment. Thus, delayed gingival wound healing in diabetic rats occurred because of impaired fibroblast proliferation and migration. Fibroblast dysfunction may occur owing to high glucose-induced insulin resistance via oxidative stress.


Conflict of interest statement

Competing Interests: The authors have declared that no competing interests exist.

Figures

Fig 1
Fig 1. Morphometric measurements.
(A) Study design. Diabetes was induced by intraperitoneal injection of streptozotocin (STZ). Seventy-two hours after injection, rats with fasting glucose levels above 350 mg/dL were used as diabetic rats. In total, 36 animals (6 per group per time point) and 72 wound sites (2 per animal) were evaluated. (B) Illustration of a palatal wound. Bilateral standardized wounds were created in the palatal gingiva adjacent to maxillary molars. M1: first molar. M2: second molar. M3: third molar. (C) Standardized photographs of wound sites at 0, 3, 7, and 21 days in control and diabetes mellitus (DM) groups. On days 7 and 21, delay of wound healing was observed in the DM group. On day 21, the wound sites were completely closed in the control group but they were still not closed in the DM group. (D) Normalized closed wound areas in control and DM groups. The area of wound closure was measured. Measurements were independently made by two blinded examiners (K.M. and K.T.), and the data were analyzed. Wound closing was delayed on days 7, 14, and 21 in the DM group. Data are presented as means ± SD (n = 6). *p < 0.05 (t-test).
Fig 2
Fig 2. Histological and histomorphometric analysis.
(A) Representative histological photographs. Note that on day 21 the wounds were completely closed and inflammatory cells were lost in the control group. While, the wounds were still not closed (arrow head) and infiltrating of inflammatory cells were not remained (asterisk) in the diabetes mellitus (DM) group. Hematoxylin–eosin staining, magnification ×40. Scale bar: 50 μm. (B) Histomorphometric analysis of wound site. The areas of epithelium (a) and connective tissue (b) were measured in the enclosed area with horizontal lines and vertical lines from the arrowhead (Δ). The re-epithelialization rate was calculated as (a / a + b). (C) Re-epithelialization rates in the control and DM groups. On days 3 and 7, delayed re-epithelialization was observed in the DM group. Data are presented as means ± SD (n = 6). *p < 0.05 (t-test).
Fig 3
Fig 3. In vivo mRNA expression.
mRNA expression of Nox1, Nox2, Nox4, p47, eNOS, VEGF, TNF-α, FGF2, and collagen type I genes was measured by real-time quantitative polymerase chain reaction (PCR) in the control and diabetes mellitus (DM) groups on days 0, 3, and 7. Oxidative stress markers and inflammatory cytokines were up-regulated at baseline. Expression of genes involved in angiogenesis and wound healing was significantly decreased on days 3 and 7 in the DM group. Data are presented as means ± SD (n = 6). *p < 0.05 (Tukey-Kramer test).
Fig 4
Fig 4. Verification of the effect of various glucose concentrations on cytotoxicity and in vitro wound healing assay in primary cultured rat gingival fibroblasts.
Cytotoxicity and cell migration after incubation at various glucose concentrations were assessed in gingival fibroblasts from control rats. (A) Cytotoxicity was measured by lactate dehydrogenase (LDH) release in the supernatant. The results revealed a significant cytotoxicity with incubation at 100 mM glucose concentration. There was a tendency of increased cytotoxicity dose-dependent manner, although the difference was not statistically significant. (B) Effects of various glucose concentrations on in vitro wound healing assay. The relative cell migration area in the 75 mM group significantly decreased from 9 to 36 h compared with that in the 15 mM group. (C) The area under the curve (AUC) was calculated from the line graph. The AUC was the largest in the 15 mM group. The AUC of the 75 mM group was significantly smaller than that of the 15 mM group. Data are presented as mean ± SD. *p < 0.05 (Tukey–Kramer test). This finding was confirmed in three independent experiments.
Fig 5
Fig 5. In vitro wound healing assay in normal and high glucose medium.
(A) Representative photomicrographs of in vitro wound healing assay with gingival fibroblasts from control and diabetes mellitus (DM) rats. Lines show the cell migration fronts. Magnification ×40. (B) The relative cell migration area of the DM group cultured in high glucose concentration (75 mM) was significantly decreased at 18 to 48 h. Data are presented as means ± SD. *p < 0.05 (Tukey-Kramer test). This finding was confirmed in three independent experiments. (C) The area under the curve (AUC) of the relative cell migration area in the DM group was significantly low. Control cells incubated in 75 mM glucose had significantly attenuated migration compared with those incubated in 15 mM glucose at 18, 24, 30, and 36 h. DM cells incubated in 75 mM glucose also had significantly attenuated migration compared with those incubated in 15 mM glucose at 36, 42, and 48 h. DM cells incubated in control medium for 72 h had significantly decreased migration compared with control cells incubated in control medium at 18, 24, 36, and 42 h. Data are presented as means ± SD. *p < 0.05 (Tukey-Kramer test). This finding was confirmed in three independent experiments.
Fig 6
Fig 6. Cell proliferation analysis (EdU).
Cell proliferation measured by the EdU assay was significantly less in the diabetes mellitus (DM) groups than in the control groups. (A) Representative immunofluorescence images of EdU incorporated into mitochondrial DNA, Hoechst 33342, and merged images. EdU activation was decreased in the DM groups. (B) Among the control and DM groups, cells incubated at a high glucose concentration had a significantly lower cell proliferation than those incubated at the control glucose concentration. Data are presented as mean ± SD; *p < 0.05 (Tukey–Kramer test). This finding was confirmed in four independent experiments.
Fig 7
Fig 7. Cell proliferation analysis (WST-8).
Cell proliferation measured by WST-8 assay was significantly less in the diabetes mellitus (DM) groups than in the control groups. Among the control and DM groups, cells incubated at high glucose concentration had significantly lower cell proliferation than those incubated at control glucose concentration. Data are presented as means ± SD. *p < 0.05 (Tukey-Kramer test). This finding was confirmed in four independent experiments.
Fig 8
Fig 8. In vitro mRNA expression.
mRNA expression of the oxidative stress markers Nox1, Nox2, Nox4, and p47 in cells from control and diabetes mellitus (DM) rats was quantified by real-time quantitative polymerase chain reaction (PCR). Oxidative stress markers were significantly increased in the DM and high glucose groups. Data are presented as means ± SD. *p < 0.05 (Tukey-Kramer test). This finding was confirmed in four independent experiments.
Fig 9
Fig 9. Fluorescence determination of oxidative stress.
CM-H2DCFDA staining showed that high glucose concentration induced oxidative stress. Oxidative stress measured by CM-H2DCFDA assay was significantly higher in the diabetes mellitus (DM) groups than in the control groups. (A) Representative immunofluorescence images. Immunofluorescence by ROS was assessed by digital fluorescence microscopy. ROS activation was increased in the DM groups. (B) Among the control and DM groups, cells incubated at a high glucose concentration had showed a significantly higher ROS production than those incubated at the control glucose concentration. Data are presented as mean ± SD; *p < 0.05 (Tukey–Kramer test). This finding was confirmed in four independent experiments.
Fig 10
Fig 10. Phosphorylation of Akt and Erk1/2 in fibroblasts in vitro.
(A) Effect of insulin on phosphorylation of Akt and Erk1/2 in gingival fibroblasts from control and diabetes mellitus (DM) rats. Representative immunoblots of lysates from insulin-treated or -untreated gingival fibroblasts were shown. (B) Phosphorylation of Akt and Erk1/2 was quantified by densitometry and expressed as percentage of phosphorylation in insulin-untreated gingival fibroblasts. Insulin-induced phosphorylation of Akt was significantly decreased in DM cells, but Erk1/2 activation was significantly increased. Data are presented as means ± SD. *p < 0.05 (Tukey-Kramer test). This finding was confirmed in three independent experiments.
Fig 11
Fig 11. Phosphorylation of Akt and Erk1/2 in fibroblasts in vitro with antioxidant treatment in cells from control and DM rats.
(A) Effects of treatment with the antioxidant N–acetyl–L-cysteine (NAC) on insulin signaling in gingival fibroblasts from control and diabetes mellitus (DM) rats. Representative immunoblots of lysates from insulin-treated or–untreated, and NAC-treated or -untreated gingival fibroblasts were shown. (B) Antioxidant treatment significantly improved Akt phosphorylation in DM cells. Data are presented as means ± SD. *p < 0.05 (Tukey-Kramer test). This finding was confirmed in three independent experiments.

Similar articles

Cited by

References

    1. Brownlee M. Biochemistry and molecular cell biology of diabetic complications. Nature. 2001;414(6865):813–20. doi: 10.1038/414813a - DOI - PubMed
    1. King GL. The role of inflammatory cytokines in diabetes and its complications. J Periodontol. 2008;79(8 Suppl):1527–34. doi: 10.1902/jop.2008.080246 - DOI - PubMed
    1. Lalla E, Papapanou PN. Diabetes mellitus and periodontitis: a tale of two common interrelated diseases. Nat Rev Endocrinol. 2011;7(12):738–48. doi: 10.1038/nrendo.2011.106 - DOI - PubMed
    1. Borgnakke WS, Ylöstalo PV, Taylor GW, Genco RJ. Effect of periodontal disease on diabetes: systematic review of epidemiologic observational evidence. J Periodontol. 2013;84(4 Suppl):S135–52. doi: 10.1902/jop.2013.1340013 - DOI - PubMed
    1. Simpson TC, Weldon JC, Worthington HV, Needleman I, Wild SH, Moles DR, et al. Treatment of periodontal disease for glycaemic control in people with diabetes mellitus. Cochrane Database Syst Rev. 2015(11):CD004714 doi: 10.1002/14651858.CD004714.pub3 - DOI - PMC - PubMed

Publication types

MeSH terms

LinkOut - more resources