

Competitive cation binding computations of proton balance for reactions of the phosphagen and glycolytic energy systems within skeletal muscle
- PMID: 29267370
- PMCID: PMC5739460
- DOI: 10.1371/journal.pone.0189822
Competitive cation binding computations of proton balance for reactions of the phosphagen and glycolytic energy systems within skeletal muscle
Abstract
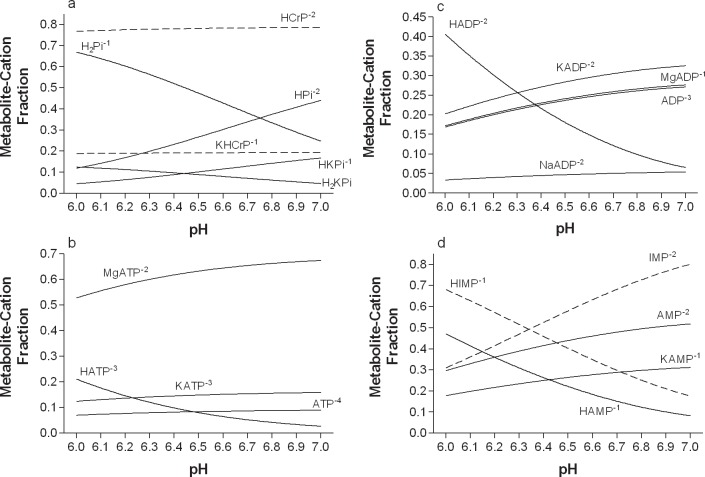
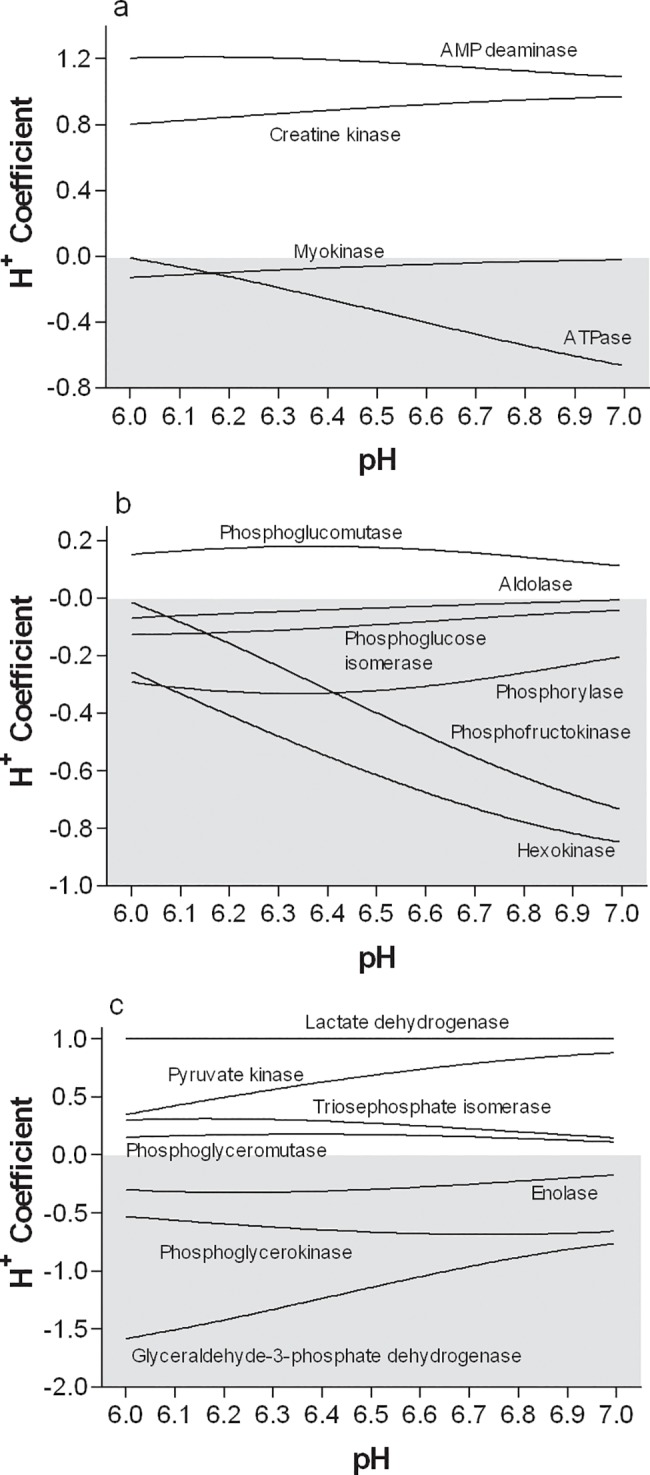
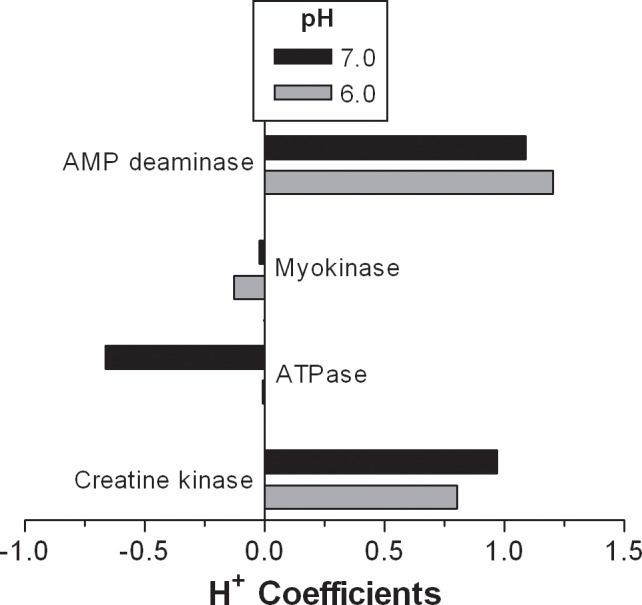
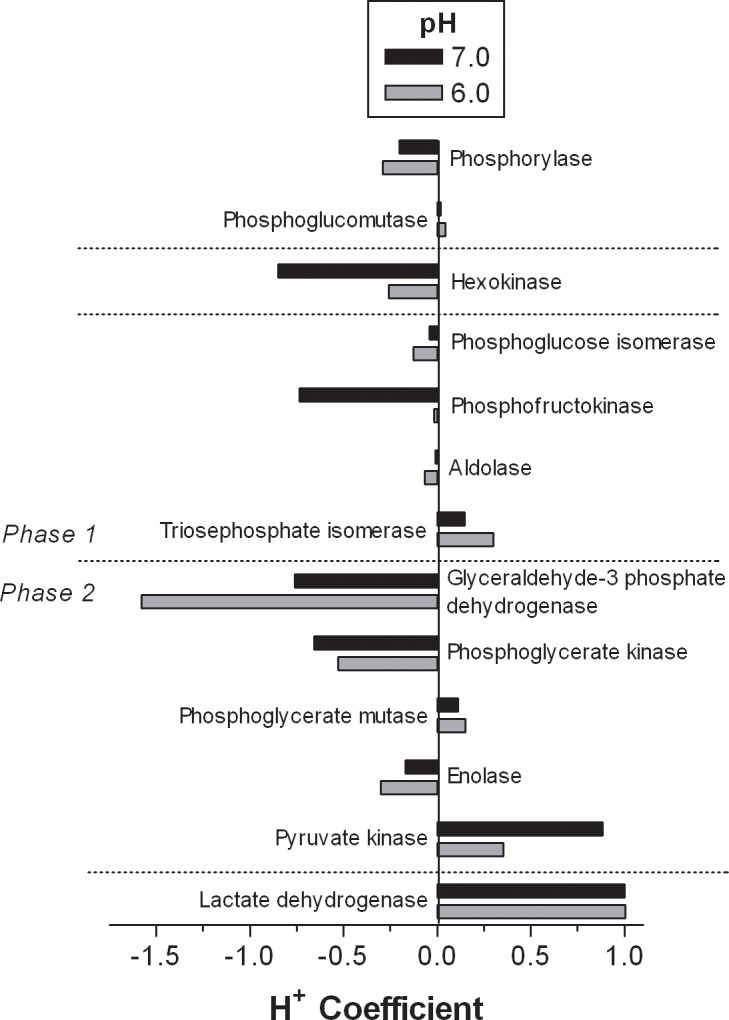
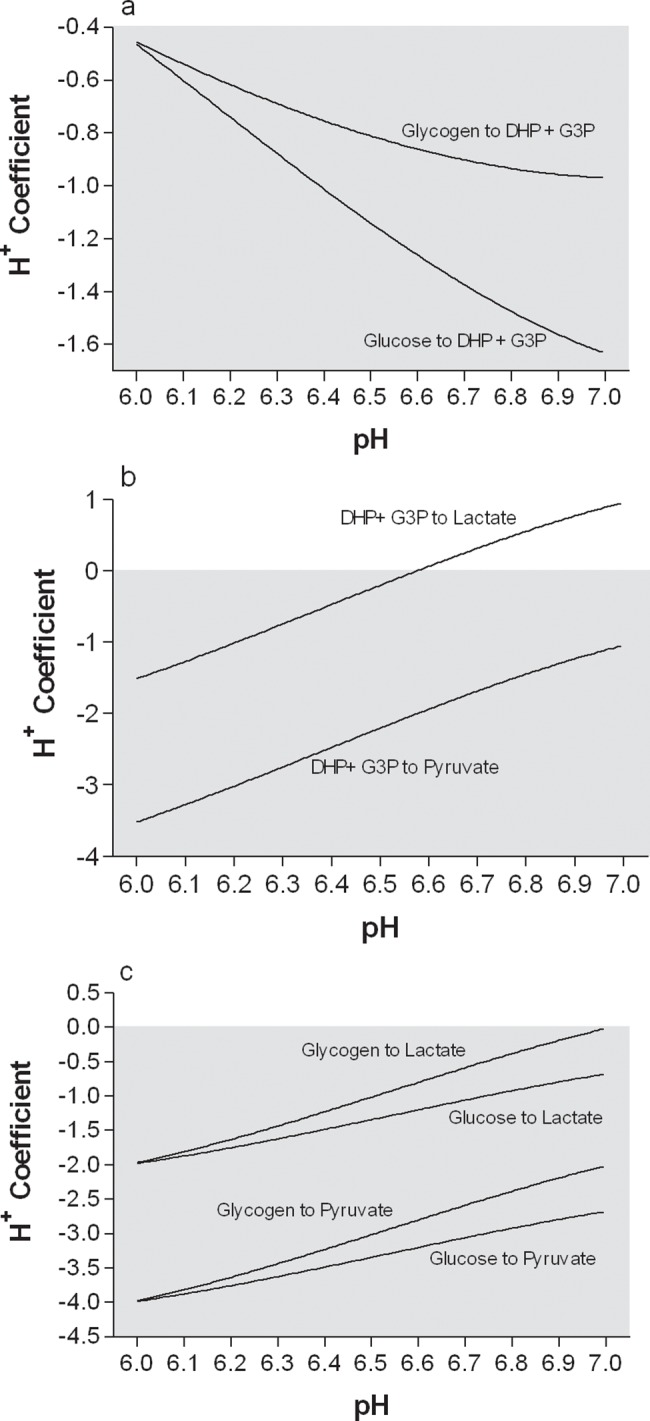
Limited research and data has been published for the H+ coefficients for the metabolites and reactions involved in non-mitochondrial energy metabolism. The purpose of this investigation was to compute the fractional binding of H+, K+, Na+ and Mg2+ to 21 metabolites of skeletal muscle non-mitochondrial energy metabolism, resulting in 104 different metabolite-cation complexes. Fractional binding of H+ to these metabolite-cation complexes were applied to 17 reactions of skeletal muscle non-mitochondrial energy metabolism, and 8 conditions of the glycolytic pathway based on the source of substrate (glycogen vs. glucose), completeness of glycolytic flux, and the end-point of pyruvate vs. lactate. For pH conditions of 6.0 and 7.0, respectively, H+ coefficients (-'ve values = H+ release) for the creatine kinase, adenylate kinase, AMP deaminase and ATPase reactions were 0.8 and 0.97, -0.13 and -0.02, 1.2 and 1.09, and -0.01 and -0.66, respectively. The glycolytic pathway is net H+ releasing, regardless of lactate production, which consumes 1 H+. For glycolysis fueled by glycogen and ending in either pyruvate or lactate, H+ coefficients for pH 6.0 and 7.0 were -3.97 and -2.01 (pyruvate), and -1.96 and -0.01 (lactate), respectively. When starting with glucose, the same conditions result in H+ coefficients of -3.98 and -2.67, and -1.97 and -0.67, respectively. The most H+ releasing reaction of glycolysis is the glyceraldehyde-3-phosphate dehydrogenase reaction, with H+ coefficients for pH 6.0 and 7.0 of -1.58 and -0.76, respectively. Incomplete flux of substrate through glycolysis would increase net H+ release due to the absence of the pyruvate kinase and lactate dehydrogenase reactions, which collectively result in H+ coefficients for pH 6.0 and 7.0 of 1.35 and 1.88, respectively. The data presented provide an extensive reference source for academics and researchers to accurately profile the balance of protons for all metabolites and reactions of non-mitochondrial energy metabolism, and reveal the greater role of glycolysis in net H+ release than previously assumed. The data can also be used to improve the understanding of the cause of metabolic acidosis, and reveal mechanistic connections between H+ release within and from muscle and the electrochemical neutrality concepts that further refine acid-base balance in biological solutions.
Conflict of interest statement
Figures
References
-
- Kushmerick MJ. Multiple equilibria of cations with metabolites in muscle bioenergetics. Am J Physiol. 1997;272(5 Pt 1):C1739–47. - PubMed
-
- Vinnakota K, Kemp ML, Kushmerick MJ. Dynamics of muscle glycogenolysis modeled with pH time course computation and pH-dependent reaction equilibria and enzyme kinetics. Biophys J. 2006;August 15;91(4):1264–87. doi: 10.1529/biophysj.105.073296 - DOI - PMC - PubMed
-
- Li X, Wu F, Beard DA. A database of thermodynamic properties of the reactions of glycolysis, the tricarboxylic acid cycle, and the pentose phosphate pathway. Database. 2011; bar005, doi: 10.1093/database/bar005 - DOI - PMC - PubMed
-
- Bendahan D, Kemp GJ, Roussel M, Fur YL, Cozzone PJ. ATP synthesis and proton handling in muscle during short periods of exercise and subsequent recovery. J Appl Physiol. 2003;94:2391–2397. doi: 10.1152/japplphysiol.00589.2002 - DOI - PubMed
-
- Boning D, Srobel G, Beneke R and Maassen N. Letter to the editor: Lactic acid still remains the real cause of exercise-induced metabolic acidosis. Am J Physiol Regul Integr Comp Physiol. 2005;289:R902–R903. doi: 10.1152/ajpregu.00069.2005 - DOI - PubMed
MeSH terms
Substances
LinkOut - more resources
Full Text Sources
Other Literature Sources
Molecular Biology Databases
Research Materials
