. 2017 Dec 21;12(12):e0189861.
doi: 10.1371/journal.pone.0189861. eCollection 2017.

Cardiac-specific ablation of the E3 ubiquitin ligase Mdm2 leads to oxidative stress, broad mitochondrial deficiency and early death

Affiliations

Cardiac-specific ablation of the E3 ubiquitin ligase Mdm2 leads to oxidative stress, broad mitochondrial deficiency and early death

Ludger Hauck et al. PLoS One. .

Abstract

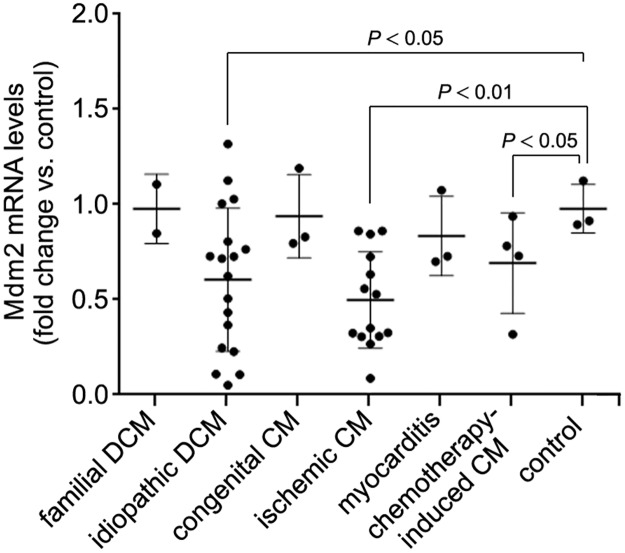
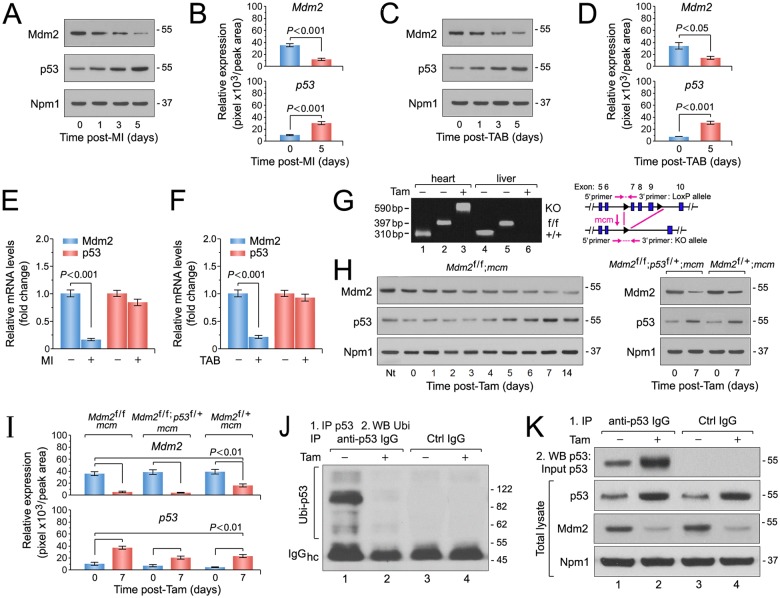
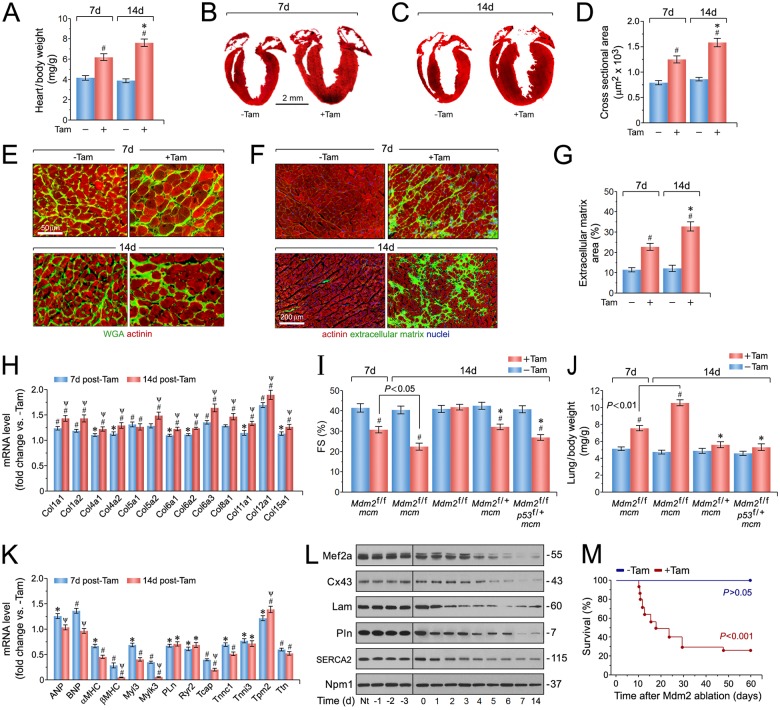
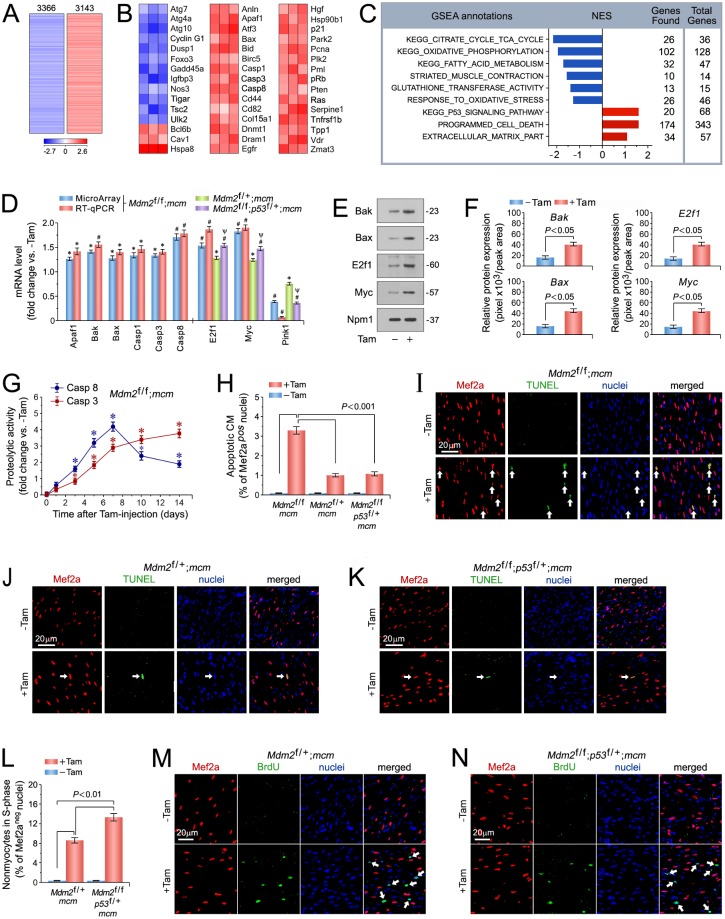
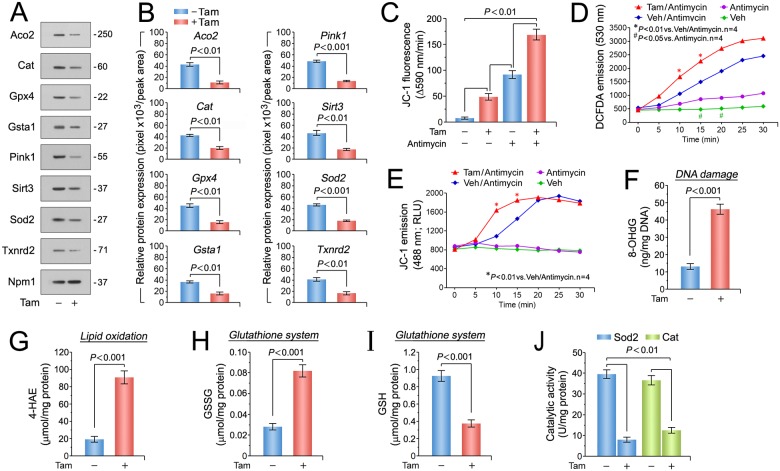
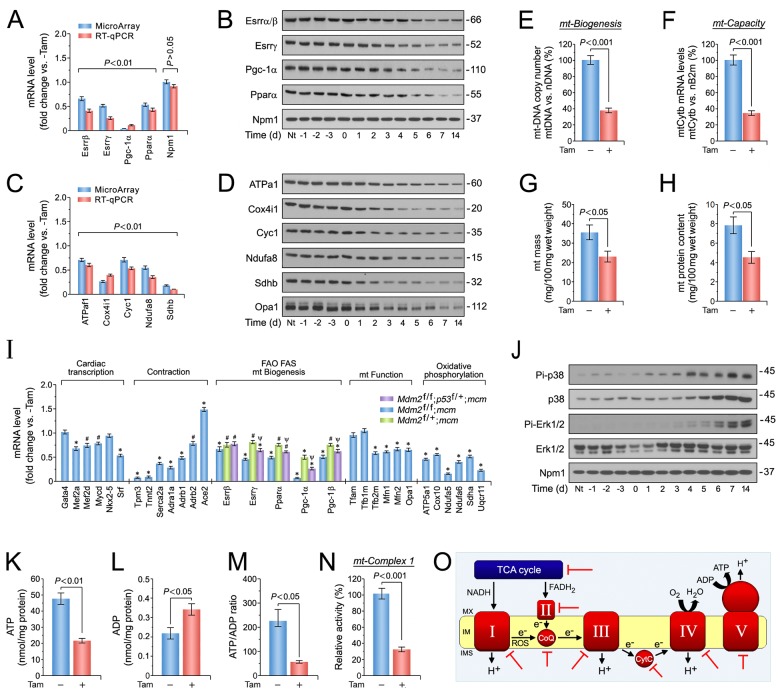
The maintenance of normal heart function requires proper control of protein turnover. The ubiquitin-proteasome system is a principal regulator of protein degradation. Mdm2 is the main E3 ubiquitin ligase for p53 in mitotic cells thereby regulating cellular growth, DNA repair, oxidative stress and apoptosis. However, which of these Mdm2-related activities are preserved in differentiated cardiomyocytes has yet to be determined. We sought to elucidate the role of Mdm2 in the control of normal heart function. We observed markedly reduced Mdm2 mRNA levels accompanied by highly elevated p53 protein expression in the hearts of wild type mice subjected to myocardial infarction or trans-aortic banding. Accordingly, we generated conditional cardiac-specific Mdm2 gene knockout (Mdm2f/f;mcm) mice. In adulthood, Mdm2f/f;mcm mice developed spontaneous cardiac hypertrophy, left ventricular dysfunction with early mortality post-tamoxifen. A decreased polyubiquitination of myocardial p53 was observed, leading to its stabilization and activation, in the absence of acute stress. In addition, transcriptomic analysis of Mdm2-deficient hearts revealed that there is an induction of E2f1 and c-Myc mRNA levels with reduced expression of the Pgc-1a/Ppara/Esrrb/g axis and Pink1. This was associated with a significant degree of cardiomyocyte apoptosis, and an inhibition of redox homeostasis and mitochondrial bioenergetics. All these processes are early, Mdm2-associated events and contribute to the development of pathological hypertrophy. Our genetic and biochemical data support a role for Mdm2 in cardiac growth control through the regulation of p53, the Pgc-1 family of transcriptional coactivators and the pivotal antioxidant Pink1.


Conflict of interest statement

Competing Interests: The authors have declared that no competing interests exist.

Figures

Fig 1
Fig 1. Down-regulation of Mdm2 mRNA levels in human end-stage heart failure determined by RT-qPCR.
DCM, dilated cardiomyopathy. CM, cardiomyopathy. Control, normal human heart. Data are means±s.e.m.
Fig 2
Fig 2. The E3 ubiquitin ligase Mdm2 is indispensable for the negative regulation of p53 protein stability in adult cardiomyocytes in vivo.
Ctrl, control. Hc, heavy chains. IgG, immunoglobulin G. IP, immunoprecipitation. Tam, 4-hydroxytamoxifen. Ubi, ubiquitin. WB, Western blot. Numbers on the right indicate the relative molecular protein weight in kilodalton. (A) Mdm2 and p53 protein levels after ischemic injury (myocardial infarction, MI). Immunoblot analysis of left ventricular extracts (60 ug total protein/lane) of C57BL/6J wild type mice at the indicated time points was performed employing anti-Mdm2 and anti-p53 antibodies as indicated on the left. Animals were 13 weeks old at the time of analysis. For normalization, Western blots were probed with anti-nucleophosmin (Npm1). One representative immunoblot of 3 independent experiments is shown. (B) Protein levels shown in Fig 2A were quantified with ImageJ software. n = 3. (C) Mdm2 and p53 protein levels after acute pressure overload (TAB). Immunoblot analysis of left ventricular extracts (60 ug total protein/lane) of C57BL/6J wild-type mice at the indicated time points was performed employing anti-Mdm2 and anti-p53 antibodies as indicated on the left. Animals were 13 weeks old at the time of analysis. One representative immunoblot of 3 independent experiments is shown. (D) Quantification of protein levels shown in Fig 2C. n = 3. (E) Transcript levels of endogenous Mdm2 and p53 in 10-week-old wild-type mice post-MI as analyzed by RT-qPCR. n = 4. (F) RT-qPCR analysis of endogenous Mdm2 and p53 transcript levels in 10-week-old wild-type mice post-TAB as analyzed by RT-qPCR. n = 4. (G) Heart-specific deletion of Mdm2. Schematic structure of the floxed alleles of Mdm2 (right panel). Genomic PCR results (left panel) of DNA isolated from LV tissue or liver control samples of wild-type (wt), vehicle injected control Mdm2f/f;mcm (-Tam) and Mdm2f/f;mcm mice at 7 days post-Tam (+Tam). Animals were 12 weeks old at the time of analysis. Numbers on the left refer to amplicon sizes in base pairs (bp). lane 1: Mdm2+/+;mcm, LV, -Tam. lane 2: Mdm2f/f;mcm, LV, -Tam. Lane 3: Mdm2f/f;mcm, LV +Tam. Lane 4: Mdm2+/+;mcm, liver, -Tam. lane 5: Mdm2f/f;mcm, liver, -Tam. Lane 6: Mdm2f/f;mcm, liver, +Tam. One representative result of 3 independent experiments is shown. (H) Immunoblot analysis of Mdm2 and p53 levels in left ventricular extracts (60 ug total protein/lane) of Mdm2f/f;mcm (left panel), Mdm2f/+;mcm and Mdm2f/f;p53f/+;mcm mice (right panel) employing specific antibodies as indicated on the left. Animals were 13 weeks old at the time of analysis. One representative immunoblot of 3 independent experiments is shown. (I) Quantification of protein levels of endogenous Mdm2 and p53 in the indicated strains shown in Fig 2H. n = 3. (J and K) Mdm2 regulates p53 protein stability in the adult mouse heart by regulation of its ubiquitin-mediated proteasomal degradation. (J) At 7d post-Tam, Mdm2f/f;mcm mice were intraperitoneally injected with the proteasomal inhibitor MG132 (30 mmol/kg body weight) for 6 hours. Left ventricular lysates were immunoprecipitated (IP) with anti-p53 antibodies or normal rabbit IgG. Ubiquitinated p53 proteins in the immunoprecipitates were identified by immunoblotting with antibodies to ubiquitin. One representative immunoblot of 3 independent experiments is shown. IgG, immunoglobulin G. IP, immunoprecipitation. Ubi, ubiquitin. WB, Western blot. (K) Levels of endogenous Mdm2 and p53 proteins in total left ventricular extracts prepared from Mdm2f/f;mcm mice in the presence and absence of Tam (middle and bottom panels). Samples were subjected to anti-p53 immunoprecipitations and Western blots were probed with anti-p53 antibodies (top panel). The same samples as in Fig 3J were analyzed. The mice were 12 weeks old at the end of the experiment. One representative immunoblot of 3 independent experiments is shown. Fig 2 data are means±s.e.m.
Fig 3
Fig 3. Ablation of Mdm2 is associated with the development of concentric hypertrophy and cardiac dysfunction.
(A) Heart-weight corrected for body weight in Mdm2f/f;mcm mice at 7d and 14 days post-Tam. n = 24. #P < 0.01 vs. -Tam. *P < 0.01 vs. Mdm2f/f;mcm at 7 days post-Tam. (B) Masson staining of longitudinal cardiac sections of Mdm2f/f;mcm mice at 7 days post-Tam. (C) Masson staining of longitudinal cardiac sections of Mdm2f/f;mcm mice at 14 days post-Tam. (D) Quantification of cross-sectional area of adult cardiomyocytes in Mdm2f/f;mcm mice shown in Fig 2E. n = 6–8. #P < 0.01 vs. -Tam. *P < 0.05 vs. Mdm2f/f;mcm at 7 days post-Tam. (E) Immunofluorescence microscopy of wheat germ agglutinin (WGA, green; top panel) and cardiomyocyte-specific anti-actinin (red; bottom panel) stained left ventricular sections from Mdm2f/f;mcm mice. (F) Immunofluorescence microscopy employing WGA staining (green) of the extracellular matrix, cardiomyocyte-specific anti-actinin (red), and Dapi (blue) to visualize nuclear DNA in left ventricular sections from Mdm2f/f;mcm mice. (G) Quantification of extracellular matrix area indicative of left ventricular fibrosis in Mdm2f/f;mcm mice shown in Fig 2F. n = 4. #P < 0.01 vs. -Tam. *P < 0.05 vs. Mdm2f/f;mcm at 7 days post-Tam. (H) Transcript levels of differentially expressed collagen types in Tam-treated Mdm2f/f;mcm mice as determined by RT-qPCR at 7 days and 14 days post-Tam. n = 4. #P < 0.01 vs. -Tam. *P < 0.05 vs. -Tam. ΨP < 0.05 vs. 7d +Tam. (I) Fractional shortening (FS) determined by M-mode echocardiography of the indicated strains at 7 and 14 days post-treatment with Tam or vehicle. n = 6. #P < 0.01 vs. -Tam. *P < 0.05 vs. Mdm2f/f;mcm at 14 days post-Tam. (J) Lung/body weight ratios in various Mdm2/p53 mutant mice at 7 and 14 days after Tam treatment. n = 6. #P < 0.01 vs. -Tam. *P < 0.05 vs. Mdm2f/f;mcm at 14 days post-Tam. (K) Levels of hypertrophic marker genes in Mdm2f/f;mcm mice as analyzed by qRT-PCR at 7 days and 14 days post-Tam. n = 4. #P < 0.01 vs. -Tam. *P < 0.05 vs. -Tam. ΨP < 0.05 vs. 7d +Tam. (L) Immunoblot analysis of cardiac-specific gene expression in left ventricular samples from Mdm2f/f;mcm mice. Nt, no treatment. Western blots were repeated at least once with similar results. (M) Acute genetic ablation of Mdm2 evokes premature death. Kaplan-Meier survival curves of conditional Mdm2f/f;mcm mice. n = 20. Fig 3A to Fig 3M: 12-week-old mice (7 days post-Tam) and 13-week-old mice (14 days post-Tam) were analyzed. Fig 3 data are means±s.e.m.
Fig 4
Fig 4. p53 is spontaneously active in Mdm2-deficient cardiomyocytes and induces apoptosis.
(A) Genome-wide messenger RNA (mRNA) microarray profiling reveals that conditional genetic ablation of Mdm2 induces profound alterations in the cardiac transcriptome indicating a high degree of complexity associated with Mdm2-deficiency. Heat map of unsupervised hierarchical cluster analysis at a high confidence threshold identifies 6,509 transcripts (rows) out of 26,166 individual genes (columns) that were enriched in the hearts of Mdm2f/f;mcm mice post-Tam relative to vehicle-injected controls. Values (log2 expression) are shown by color and intensity of shading. Blue, repressed. Red, induced. n = 3 biological replicates. P < 0.01. Fold change >1.3. Mice (13 weeks old) were analyzed at 14 days post-Tam. (B) Heat maps examining the impact of genomic modifications in Mdm2-deficient hearts (columns) on previously validated p53 target genes (rows). Values, log2 expression. n = 3. P < 0.01. Fold change >1.3. (C) Gene Set Enrichment Analysis (GSEA) of biological processes among all differentially expressed transcripts, assessed by overrepresentation of GSEA terms for the biological function of each transcript in hearts of Mdm2f/f;mcm mice post-Tam. NES, normalized enrichment score. NES have False Discovery Rate (FDR) q-values <0.1. Blue, inhibited processes. Red, activated processes. (D) Expression levels of key genes selected from top-ranked gene sets identified in Fig 4A, involved in the regulation of cardiomyocyte apoptosis in the indicated Mdm2 and p53 mutant mice as analyzed by RT-qPCR at 7 days post-Tam. n = 3. *P < 0.05 vs. -Tam. #P < 0.01 vs. -Tam. Ψ < 0.05 vs. Mdm2f/+;mcm and Mdm2f/f;mcm. (E) Immunoblot analysis of master regulators of apoptosis in Mdm2f/f;mcm mice at 7 days post-Tam employing specific antibodies as indicated on the left. One representative immunoblot of 3 independent experiments is shown. (F) Protein levels shown in Fig 4E were quantified with ImageJ software. n = 3. (G) Time course of caspase 3/8 activation in Mdm2f/f;mcm mice. n = 4. *P < 0.05 vs. -Tam. (H) Quantification of apoptotic cardiomyocytes shown in Fig 4I-K. n = 4. (I to K) Analysis of apoptosis in left ventricular cardiomyocytes (white arrows) in various Mdm2 and p53 mutant strains at 7 days post-Tam by immunofluorescence microscopy and terminal deoxynucleotidyl transferase dUTP nick end labeling (TUNEL) assay. Red, anti-Mef2a. Green, TUNEL. Blue, DAPI stain of nuclear genomic DNA. (L) Induction of cell cycle entry and DNA synthesis is restricted to non-myocytes in the indicated Mdm2 and p53 mutant strains. Quantification of non-myocytes in S phase of the cell cycle shown in Fig 4M and N. n = 4. (M, N) Analysis of DNA replication in left ventricular non-myocytes (white arrows) in the indicated Mdm2 and p53 mutant strains at 7 days post-Tam by immunofluorescence microscopy. Red, anti-Mef2a. Green, BrdU. Blue, DAPI stain of nuclear genomic DNA. Mice were 13 weeks old at 14 days post-Tam (Fig 4A to C). Animals were 12 weeks old mice at 7 days post-Tam (Fig 4C to N). Abbreviations of gene names in Fig 4B: Anln, anillin actin binding protein; Apaf1, apoptotic peptidase activating factor 1; Atf3, activating transcription factor 3; Atg7, autophagy related 7; Atg4a, autophagy related 4A cysteine peptidase; Atg10, autophagy related 10; Bax, BCL2-associated X protein; Bcl6b, B cell CLL/lymphoma 6, member B; Bid, BH3 interacting domain death agonist; Birc5, baculoviral IAP repeat-containing 5; Casp1, caspase 1; Cav1, caveolae protein caveolin 1; Cd44, CD44 antigen; Cd82, CD82 antigen; Col18a1, collagen type XVIII alpha 1; Cyclin G1 (Ccng1); Dnmt1, DNA methyltransferase (cytosine-5) 1; Dram1, DNA-damage regulated autophagy modulator 1; Dusp1, dual specificity phosphatase 1; Egfr, epidermal growth factor receptor; Foxo3, forkhead box O3; Gadd45a, growth arrest and DNA-damage-inducible 45 alpha; Hgf, hepatocyte growth factor; Hspa8, heat shock protein 8; Hsp90b1, heat shock protein 90 beta (Grp94) member 1; Igfbp3, insulin-like growth factor binding protein 3; Nos3, endothelial cell nitric oxide synthase 3; p21, cyclin-dependent kinase inhibitor 1A (Cdkn1a); Park2 (parkin), Parkinson disease autosomal recessive, juvenile 2; Pcna, proliferating cell nuclear antigen; Plk2, polo-like kinase 2; Pml, promyelocytic leukemia; pRb, retinoblastoma 1 (Rb1); Pten, PTEN induced putative kinase 1; Ras, Harvey rat sarcoma virus oncogene (Hras); Serpine1, serine (or cysteine) peptidase inhibitor clade E member 1; Tigar, Trp53 induced glycolysis regulatory phosphatase; Tnfrs1b, TNF receptor superfamily member 1B; Tpp1, tripeptidyl peptidase I; Tsc2, tuberous sclerosis 2; Ulk2, unc-51 like kinase 2; Vdr, vitamin D receptor; Zmat3, zinc finger matrin-type 3. Fig 4 data are means±s.e.m.
Fig 5
Fig 5. Enhanced oxidative stress and impaired antioxidant systems in cardiomyocytes lacking Mdm2.
(A) Immunoblot analysis of key genes selected from top-ranked gene sets identified in Fig 3C involved in detoxification processes of reactive oxygen species (ROS). One representative immunoblot of 3 independent experiments is shown. Left ventricular samples from Mdm2f/f;mcm mice were analyzed at 7 days post-Tam. (B) Densitometric analysis of Western blot results shown in Fig 5A employing ImageJ software. Numbers at the bottom of each panel indicate fold-change. n = 3 (C) Isolated cardiac mitochondria from Tam-treated Mdm2f/f;mcm have a membrane potential (MMP) that is susceptible to ROS-induced depolarization. Mitochondria were mechanically isolated, incubated with JC-1 (5.0 ug/mL), and were then treated with antimycin (50 uM). JC-1 emission at 535/595 nm was recorded at 1 reading/min for 30 min using a fluorescence spectrophotometer. The rate between two time points (emission at 595 nm/min) was calculated in the most linear range of decline for JC-1 fluorescence intensity. n = 4. (D) DCFAD (dichlorofluorescin diacetate) emission data in isolated cardiac mitochondria from Tam-treated Mdm2f/f;mcm mice. n = 4. (E) JC-1 green emission data in isolated cardiac mitochondria from Tam-treated Mdm2f/f;mcm mice. RLU, relative light units. n = 4. (F) Higher oxidative genomic DNA damage in Mdm2f/f;mcm mice post-Tam when compared to vehicle-injected controls. Concentrations of 8-hydroxy-2’-deoxyguanosine (8-OHdG), a biomarker for oxidative DNA damage in the indicated strains was determined by a competitive enzyme-linked ELISA employing 8-OHdG antibodies. n = 4. (G) Significantly enhanced levels of 4-hydroxyalkenals (4-HAE), an indicator of ROS-dependent lipid peroxidation in Mdm2f/f;mcm mice post-Tam compared with control injected animals. n = 4. (H and I) Markedly reduced glutathione/oxidized glutathione (GSH/GSSG) ratios, an indicator of cardiac oxidative stress, in Mdm2f/f;mcm mice post-Tam compared to controls. n = 4. (J) Significantly downregulated mitochondrial superoxide dismutase (Sod2) and catalase (Cat) activities as determined spectrophotometrically in Mdm2f/f;mcm mice post-Tam. n = 4. Fig 5A to J: Left ventricular samples from 12-week-old mice were analyzed at 7 days post-Tam. Fig 5 data are means±s.e.m.
Fig 6
Fig 6. Mdm2 is involved in the maintenance of mitochondrial biogenesis and bioenergetics.
(A) Expression levels of selected factors from top-ranked gene sets identified in Fig 4A that play a crucial role in the regulation of mitochondrial function and fatty acid oxidation as analyzed by RT-qPCR. n = 4. Left ventricular tissue samples from Mdm2f/f;mcm mice were analyzed at 7 days post-Tam. (B) Immunoblot analysis of key factors regulating mitochondrial biogenesis and fatty acid oxidation from Mdm2f/f;mcm mice. Western blots were repeated at least once with similar results. (C) Transcript levels of important constituents of the mitochondrial electron transport chain participating in oxidative phosphorylation in Mdm2f/f;mcm mice. n = 4. (D) Immunoblot analysis of important components of the mitochondrial electron transport chain complexes in Mdm2f/f;mcm mice. Western blots were repeated at least once with similar results. (E) Mitochondrial biogenesis, defined as relative DNA copy number of mitochondrial encoded Cytb gene normalized to the copy number of the nuclear gene B2m, was determined by qPCR in Mdm2f/f;mcm mice. n = 4. (F) Mitochondrial capacity, defined as relative mRNA levels of the nuclear gene cytochrome b (Cytb), a constituent of oxidative phosphorylation (OxPhos) complex III, normalized to B2m transcript expression, was determined by RT-qPCR in Mdm2f/f;mcm mice. (G) Decreased mitochondrial wet weight in ventricular tissue of Mdm2f/f;mcm mice post-Tam. n = 4. (H) Downregulation of total mitochondrial protein content in Mdm2-deficient ventricles. n = 4. (I) Cardiac-specific gene expression in the indicated Mdm2 and p53 mutant mice post-Tam as analyzed by RT-qPCR. n = 4. *P < 0.01 vs. -Tam. #P < 0.05 vs. -Tam. Ψ < 0.05 vs. Mdm2f/+;mcm and Mdm2f/f;mcm. (J) Activation of p38 and Erk1/2 signal transduction pathways is associated with the development of decompensated cardiac hypertrophy in Mdm2f/f;mcm mice exposed to Tam. LV extracts were prepared at the indicated time points, and were immunoblotted with the antibodies as indicated on the left. The amount of phosphorylation was determined using phosphorylation site-specific antibodies to p38 and Erk1/2. Western blots were repeated at least once with similar results. (K) Markedly impaired ATP production indicates mitochondrial dysfunction in Mdm2f/f;mcm mice post-Tam. ATP levels were analyzed with a bioluminescence-based assay. n = 4. (L) Acute genetic deletion of Mdm2 evokes increases in ADP levels in Mdm2f/f;mcm mice post-Tam. n = 4. (M) Mdm2 is indispensable for the maintenance of proper energy metabolism as indicated by a significantly lower ATP/ADP ratio in Mdm2f/f;mcm mice post-Tam. n = 4. (N) Mitochondrial complex I activity in Mdm2f/f;mcm mice was determined with an ELISA assay employing isolated mitochondria and complex I-specific antibodies. The NADH dehydrogenase activity of complex I was determined colorimetrical by monitoring the oxidation of NADH to NAD+. n = 4. (O) Potential Mdm2-regulated genes in a well-established mt interaction network. Red block arrows indicate significantly downregulated genes in Mdm2f/f;mcm mice post-Tam. CoQ, coenzyme Q10. CytC, cytochrome c. IMM, inner mt membrane. IMS, inner membrane space. MMX, mt matrix. ROS, reactive oxygen species. (A to M) Tam- and vehicle-injected Mdm2f/f;mcm animals were investigated. Unless indicated otherwise left ventricular samples from 12-week-old mice were analyzed at 7 days post-Tam. Fig 6 data are means±s.e.m.

References

    1. Akazawa H. Mechanisms of cardiovascular homeostasis and pathophysiology—from gene expression, signal transduction to cellular communication. Circ J. 2015;79: 2529–2536. doi: 10.1253/circj.CJ-15-0818 - DOI - PubMed
    1. Borlaug BA, Paulus WJ. Heart failure with preserved ejection fraction: pathophysiology, diagnosis, and treatment. Eur Heart J. 2011;32: 670–679. doi: 10.1093/eurheartj/ehq426 - DOI - PMC - PubMed
    1. Jessup M, Konstam MA, Mancini DM, Michl K, Oates JA, Rahko PS, et al. ACC/AHA 2005 Guideline Update for the Diagnosis and Management of Chronic Heart Failure in the Adult: a report of the American College of Cardiology/American Heart Association Task Force on Practice Guidelines (Writing Committee to Update the 2001 Guidelines for the Evaluation and Management of Heart Failure): developed in collaboration with the American College of Chest Physicians and the International Society for Heart and Lung Transplantation: endorsed by the Heart Rhythm Society. Circulation. 2005;112: e154–e235. doi: 10.1161/CIRCULATIONAHA.105.167586 - DOI - PubMed
    1. Kapiloff MS, Emter CA. The cardiac enigma: current conundrums in heart failure research. F1000Res. 2016;5 doi: 10.12688/f1000research.7278.1 - DOI - PMC - PubMed
    1. Mann DL, Bristow MR. Mechanisms and models in heart failure: The biomechanical model and beyond. Circulation. 2005;111: 2837–2849. doi: 10.1161/CIRCULATIONAHA.104.500546 - DOI - PubMed

Publication types