. 2017 Dec 20;96(6):1290-1302.e6.
doi: 10.1016/j.neuron.2017.11.032.

Activation of the STING-Dependent Type I Interferon Response Reduces Microglial Reactivity and Neuroinflammation

Affiliations

Activation of the STING-Dependent Type I Interferon Response Reduces Microglial Reactivity and Neuroinflammation

Vidhu Mathur et al. Neuron. .

Abstract

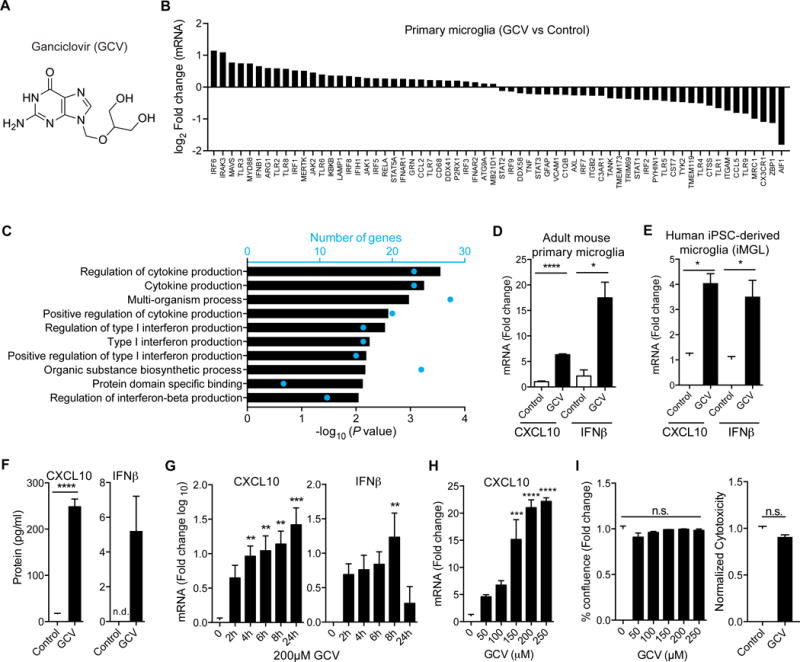
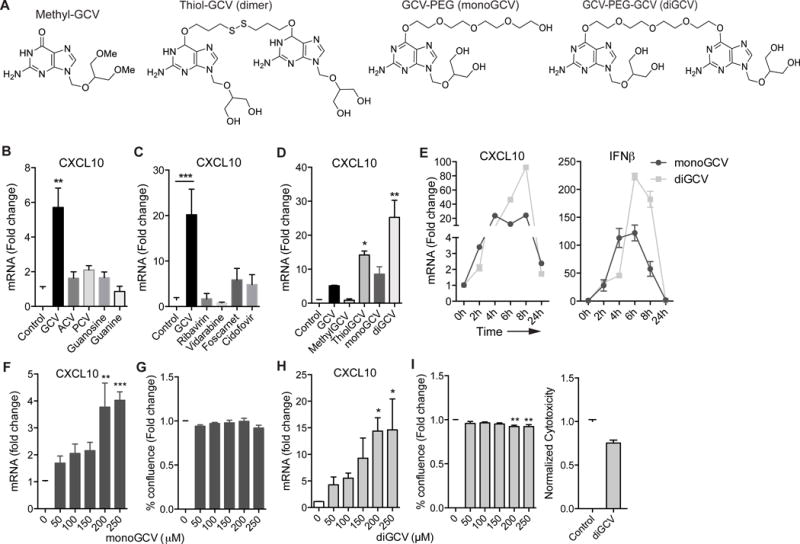
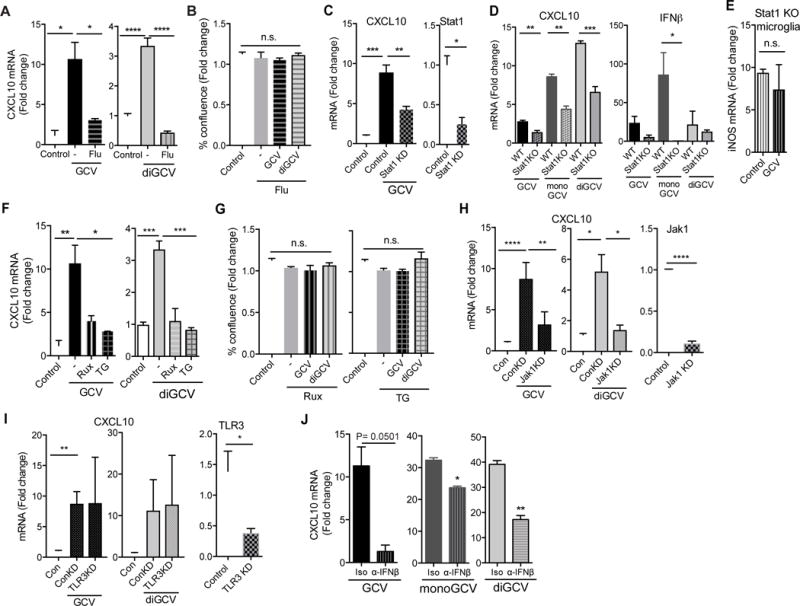
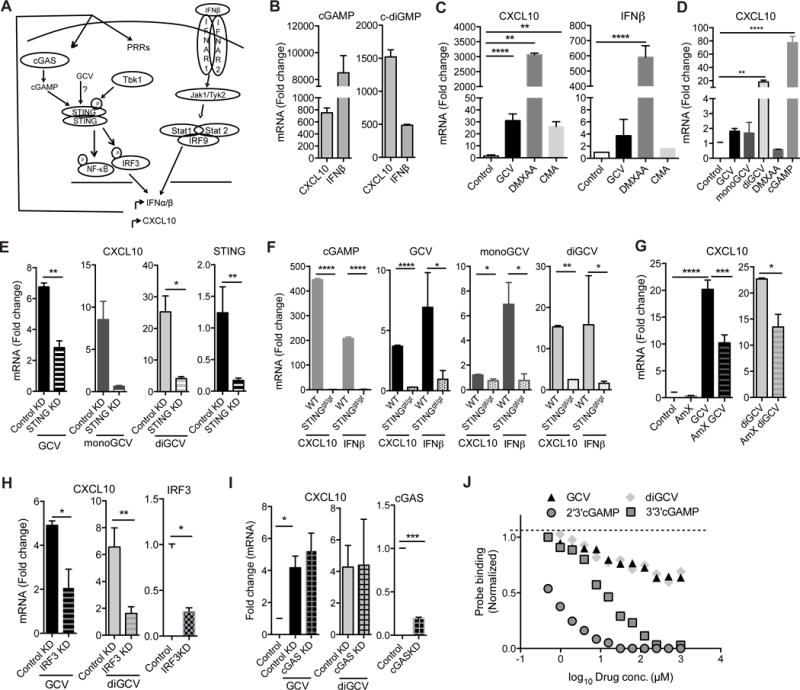
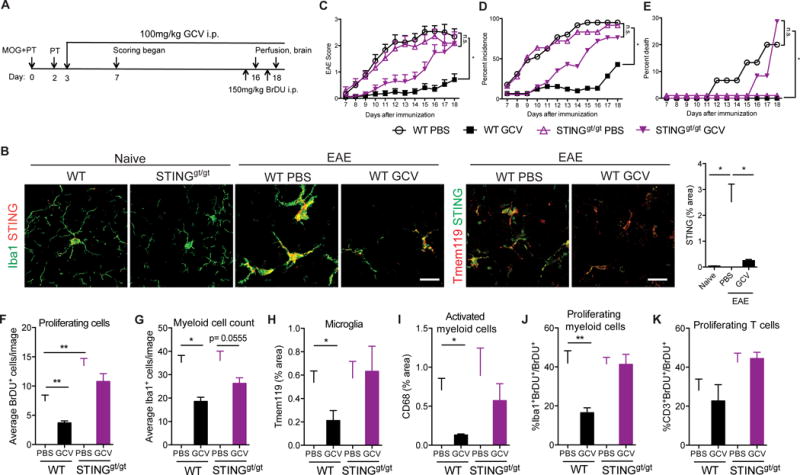
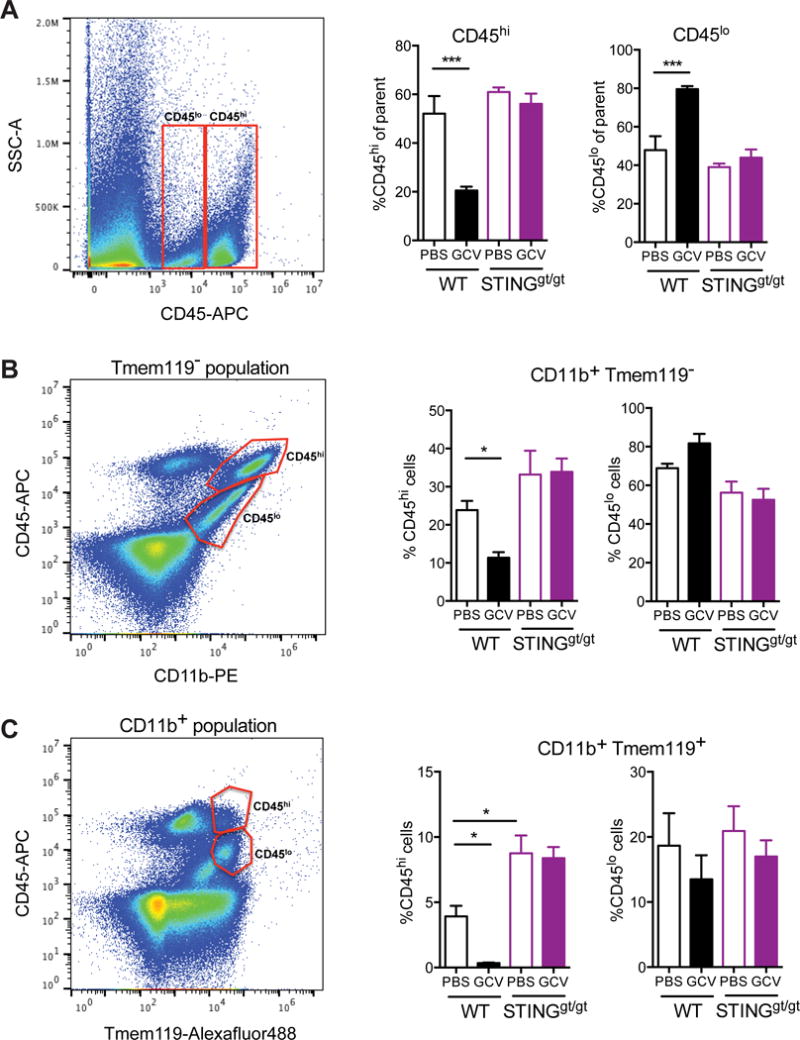
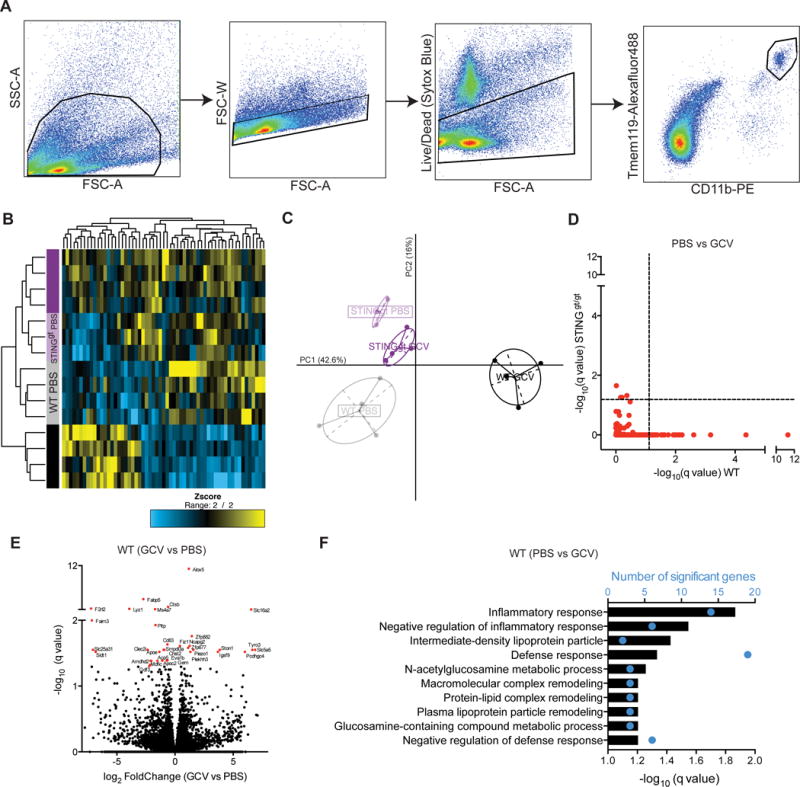
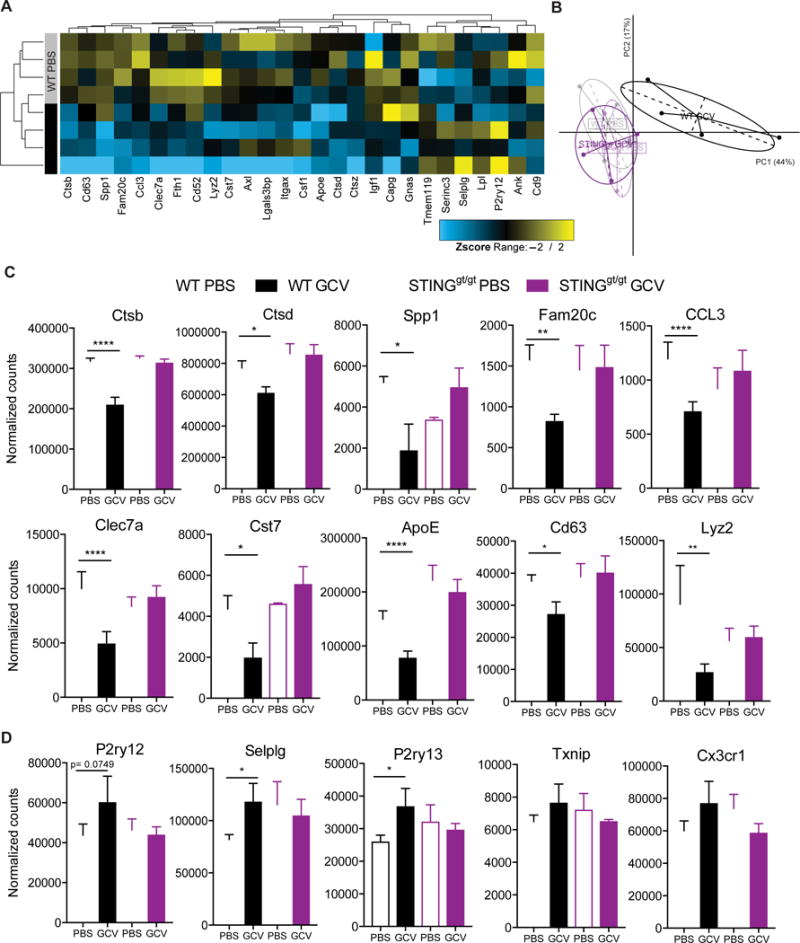
Brain aging and neurodegeneration are associated with prominent microglial reactivity and activation of innate immune response pathways, commonly referred to as neuroinflammation. One such pathway, the type I interferon response, recognizes viral or mitochondrial DNA in the cytoplasm via activation of the recently discovered cyclic dinucleotide synthetase cGAS and the cyclic dinucleotide receptor STING. Here we show that the FDA-approved antiviral drug ganciclovir (GCV) induces a type I interferon response independent of its canonical thymidine kinase target. Inhibition of components of the STING pathway, including STING, IRF3, Tbk1, extracellular IFNβ, and the Jak-Stat pathway resulted in reduced activity of GCV and its derivatives. Importantly, functional STING was necessary for GCV to inhibit inflammation in cultured myeloid cells and in a mouse model of multiple sclerosis. Collectively, our findings uncover an unexpected new activity of GCV and identify the STING pathway as a regulator of microglial reactivity and neuroinflammation.

Keywords: STING; experimental autoimmune encephalomyelitis; ganciclovir; microglia; neuroinflammation; type I interferon response.


Figures

Figure 1
Figure 1. Ganciclovir induces interferon response in microglia
(A) Structure of Ganciclovir (GCV). (B) Microfluidic quantitative RT-PCR (qRT-PCR) analysis of control or GCV treated primary microglia from adult mice (n= 4 mice/group). Differentially expressed genes with log2 fold change > 0.1 and < −0.1 are shown. (C) Gene ontology pathways enriched by GCV treatment in primary microglia. Blue dots indicate the number of significant genes in the respective GO term. (D-E) qRT-PCR analysis for CXCL10 and IFNβ from GCV treated primary microglia from adult mice (D) and iPSC-derived human microglia, iMGL (E). (F) ELISA for CXCL10 and IFNβ on supernatants from primary microglia treated with GCV. (G) Time course for the induction of CXCL10 and IFNβ mRNA in BV-2 cells treated with GCV. (H-I) Dose response for CXCL10 mRNA (G), cell viability (H, left) and cytotoxicity (H, right) in BV-2 cells treated with GCV for 24h. Fold change is based on control treatment for experiment. All GCV treatments were with 200μM unless otherwise noted. Statistical tests: one-way ANOVA followed by Dunnett’s multiple comparison test (G-I), unpaired Student’s t-test (D-F). Bars represent mean + SEM from 3 (cell lines) or 2 (primary cells) independent experiments. *P < 0.05, **P < 0.01, *** P < 0.001, ****P < 0.0001.
Figure 2
Figure 2. GCV derivatives are potent inducers of interferon response
(A) Structures of GCV derivatives. (B-D) BV-2 cells were treated with indicated compounds for 24h and CXCL10 mRNA was quantified by qRT-PCR. (E) Time course for the induction of CXCL10 and IFNβ mRNA in BV-2 cells treated with monoGCV and diGCV. (F-I) Dose curves depicting CXCL10 induction by qRT-PCR, cell viability and cytotoxicity (I, right) in BV-2 cells treated with monoGCV (F-G) and diGCV (H-I) for 24h. Fold change is based on control treatment for each genotype. All monoGCV and diGCV treatments were with 200μM unless otherwise noted. Statistical tests: one-way ANOVA followed by Dunnett’s multiple comparison test (B-H), unpaired Student’s t-test (I, right). Bars represent mean + SEM from 3 independent experiments. *P < 0.05, **P < 0.01, *** P < 0.001, ****P < 0.0001.
Figure 3
Figure 3. Jak-Stat signaling through IFNβ is required for GCV activity
(A-B) BV-2 cells were treated with GCV or diGCV along with 10μM Fludarabine for 24h. mRNA fold change were analyzed by qRT-PCR (A) and toxicity was assessed using an automated cell counter (B). (C) BV-2 cells were transfected with control or Stat1 siRNA for 24h and then stimulated with GCV for another 24h. CXCL10 mRNA fold change (left) and efficiency of knockdown (right) are shown. (D-E) Primary microglia from wild type (WT) and Stat1 knockout (Stat1 KO) mice were treated with GCV, monoGCV or diGCV for 6h (D) or with IFNγ/LPS with or without GCV for 24h (E). Indicated transcripts were analyzed by qRT-PCR. (F-G) BV-2 cells were treated with GCV or diGCV along with 1μM Ruxolitinib (Rux) or TG101348 (TG) for 24h. mRNA (F) and toxicity (G) are shown. (H-I) BV-2 cells were transfected with control, Jak1 (H) or TLR3 (I) siRNA for 24h and then stimulated with GCV or diGCV for another 24h. CXCL10 mRNA fold change (left) and efficiency of knockdown (right) are shown. (J) BV-2 cells were treated with GCV, monoGCV or diGCV with anti-IFNβ antibody (α-IFNβ) or isotype (Iso) control for 4h and mRNA quantified. Drug treatments were with 200μM unless otherwise noted. Statistical tests: one-way ANOVA followed by Dunnett’s multiple comparison test (A-C, F-I) or unpaired Student’s t-test (C right, D, H right, I right, J). Bars represent mean + SEM from 3 (cell lines) or 2 (primary cells) independent experiments. *P < 0.05, **P < 0.01, *** P < 0.001, ****P < 0.0001.
Figure 4
Figure 4. STING pathway is required for GCV activity in microglia
(A) Schematic showing STING induces IFNβ via Tbk1 and IRF3 and further activation of Jak/Stat signaling activates antiviral interferon response. PRR, pattern recognition receptors. (B-D) BV-2 (B, C) and THP-1 (D) cells were treated with the drugs for 24h and 8h respectively and indicated transcripts were quantified. (E) STING was knocked down in BV-2 cells using siRNA for 24h. Cells were then stimulated with GCV, monoGCV or diGCV for additional 24h. Fold change in CXCL10 mRNA (left) and efficiency of STING knockdown (right) is shown. (F) Primary microglia from wild type or STINGgt/gt mice were treated with cGAMP, GCV, monoGCV and diGCV for 6h and indicated transcripts were analyzed. mRNA fold change was determined by qRT-PCR. (G) BV-2 cells were treated with GCV or diGCV along with Tbk1 inhibitor Amlexanox (AmX, 1μM) for 24h and CXCL10 mRNA was quantified. (H-I) IRF3 (H) or cGAS (I) were knocked down in BV-2 cells using siRNA for 24h. Cells were then stimulated with GCV or diGCV for additional 24h. Fold change in CXCL10 mRNA (left) and efficiency of knockdown (right) is shown. GCV and diGCV treatments were with 200μM drugs. (J) Competition binding assay using 500 pM 35S-labeled 2′3′-cGAsMP probe showing that 2′3′-cGAMP and 3′3′-cGAMP, but not GCV and diGCV, dose dependently compete with 2′3′-cGAsMP for binding to 100nM mSTING. Statistical tests: one-way ANOVA followed by Dunnett’s multiple comparison test (C-D) or unpaired Student’s t-test (E-I). mRNA fold change was determined by qRT-PCR. Bars represent mean + SEM from 3 (cell lines) or 2 (primary cells) independent experiments. *P < 0.05, **P < 0.01, *** P < 0.001, ****P < 0.0001.
Figure 5
Figure 5. STING is required for inhibition of inflammation in EAE by GCV
(A) Schematic showing the experimental design. (B) Representative merged images showing STING expression in Iba1 and Tmem119 expressing cells in the hippocampus (Naïve) or cerebella (EAE) of mice. Bar graph shows quantification of STING expression. Scale bar = 20μm. EAE score (C), percent incidence (D) and percent death (E) is depicted for indicated groups. Data are cumulative of 3 independent experiments (n= 25-32 mice/group). (F-K) Quantification of average number of BrDU+ proliferating cells (F), Iba1+ myeloid cells (G), Tmem119 expression (H), CD68 expression (I) percent Iba1+BrDU+ proliferating myeloid cells (J) and CD3+BrDU+ proliferating T-cells (K). For histology, n= 6-10 mice/group. Bars represent mean + SEM. Statistical tests: Two- way ANOVA followed by Sidak’s multiple comparisons test between indicated groups. *P < 0.05, **P < 0.01, *** P < 0.001, ****P < 0.0001.
Figure 6
Figure 6. GCV reduces CD45hi myeloid and microglial cells in wild type, but not STINGgt/gt, mice with EAE
Flow cytometry analysis of CD11b, CD45 and Tmem119 in isolated microglia from the cerebella of wild type and STINGgt/gt EAE mice treated with GCV. Left shows representative flow dot plots. Right shows the quantification of CD45hi and CD45lo populations (A) in CD11b+ Tmem119 cells (B) and CD11b+ Tmem119+ microglia (C). n= 3-4 mice/group. Bars represent mean + SEM. Statistical tests: Two- way ANOVA followed by Sidak’s multiple comparisons test between indicated groups. *P < 0.05, **P < 0.01, *** P < 0.001, ****P < 0.0001.
Figure 7
Figure 7. RNA-seq on microglia from mice with EAE shows Ganciclovir inhibits inflammation in a STING- dependent manner
(A) Flow sorting scheme for isolation of CD11b+Tmem119+ cells from mice with EAE. (B) Heatmap showing significant genes (q<0.05) between at least two groups (n= 3-4 mice/group). (C) Principal component analysis (PCA) using significant genes. (D) –log10 q-value plots from WT and STINGgt/gt PBS vs GCV differential expression comparison. Dashed line indicates q= 0.05. (E) Volcano plot showing differentially expressed genes in WT GCV vs WT PBS microglia from mice with EAE. (F) Gene ontology (GO) terms associated with top 100 differentially expressed genes ranked by q-value in WT PBS vs GCV comparison.
Figure 8
Figure 8. Ganciclovir treatment reduces the expression of top disease associated genes in microglia from mice with EAE
(A) Heatmap shows differential expression of top disease associated microglia genes in WT PBS vs GCV groups. The genes with –log10 (p-value) >20 for homeostatic to DAM (AD and ALS) comparisons are represented (n= 27). (B) Principal component analysis (PCA) of top disease associated microglia genes shows distinct clustering of GCV treated WT microglia. (C-D) Individual plots of normalized counts from RNA-seq data showing down-regulation of disease associated inflammatory genes (C) and an increase in homeostatic genes (D) by GCV in WT but not STINGgt/gt microglia. Bars represent mean + SEM. Statistical tests: Differential expression analysis based on the negative binomial distribution using DEseq2. *P < 0.05, **P < 0.01, *** P < 0.001, ****P < 0.0001.

Comment in

References

    1. Abud EM, Ramirez RN, Martinez ES, Healy LM, Nguyen CHH, Newman SA, Yeromin AV, Scarfone VM, Marsh SE, Fimbres C, et al. iPSC-Derived Human Microglia-like Cells to Study Neurological Diseases. Neuron. 2017;94:278–293 e279. - PMC - PubMed
    1. Ahn J, Konno H, Barber GN. Diverse roles of STING-dependent signaling on the development of cancer. Oncogene 2015 - PMC - PubMed
    1. Alexa A, Rahnenfuhrer J. topGO: enrichment analysis for gene ontology. R package version 2.16.0 2010
    1. Andrews S. FastQC: a quality control tool for high throughput sequence data 2010
    1. Barber GN. STING: infection, inflammation and cancer. Nat Rev Immunol. 2015;15:760–770. - PMC - PubMed

Publication types

MeSH terms