. 2017 Dec 20;96(6):1327-1341.e6.
doi: 10.1016/j.neuron.2017.11.037.

Drp1 Mitochondrial Fission in D1 Neurons Mediates Behavioral and Cellular Plasticity during Early Cocaine Abstinence

Affiliations

Drp1 Mitochondrial Fission in D1 Neurons Mediates Behavioral and Cellular Plasticity during Early Cocaine Abstinence

Ramesh Chandra et al. Neuron. .

Abstract

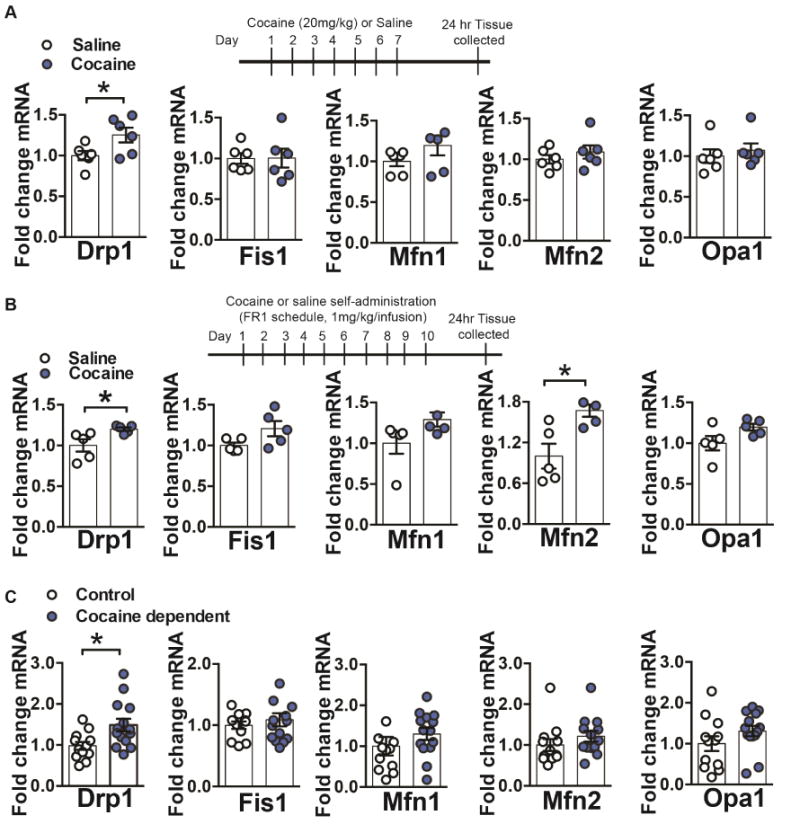
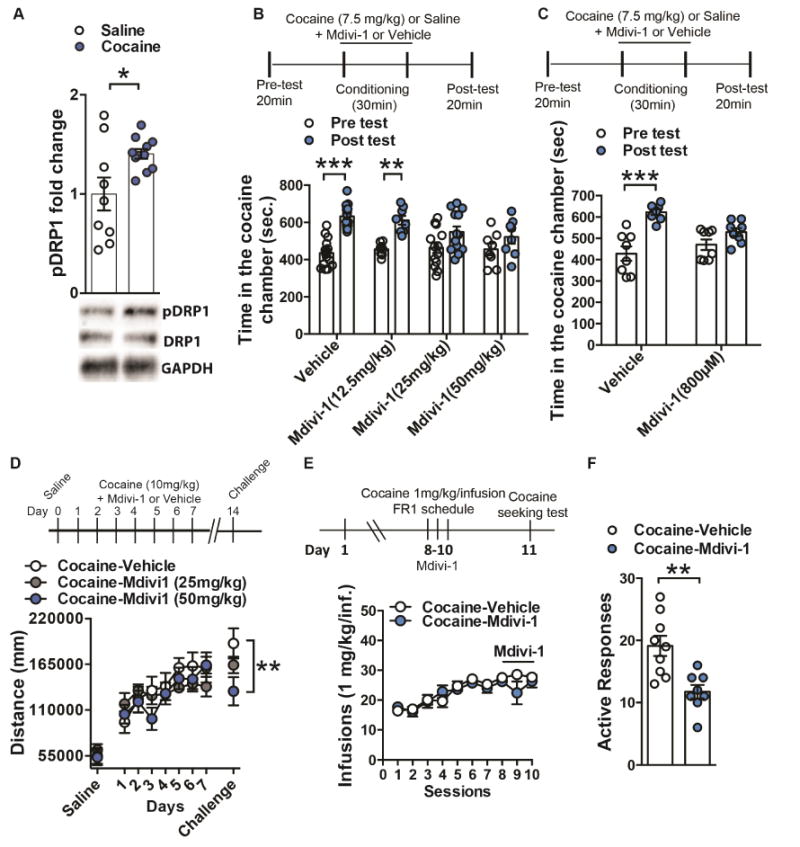
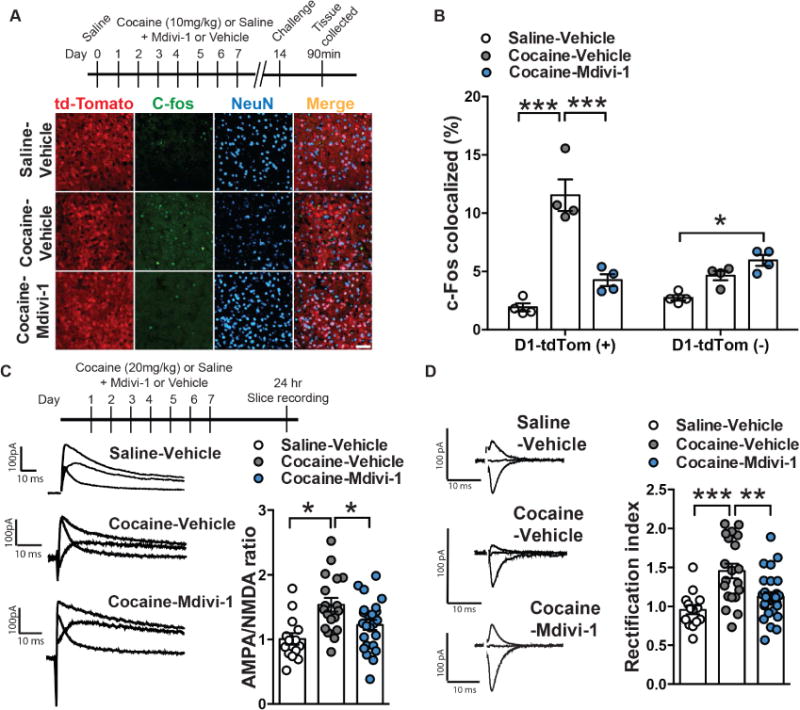
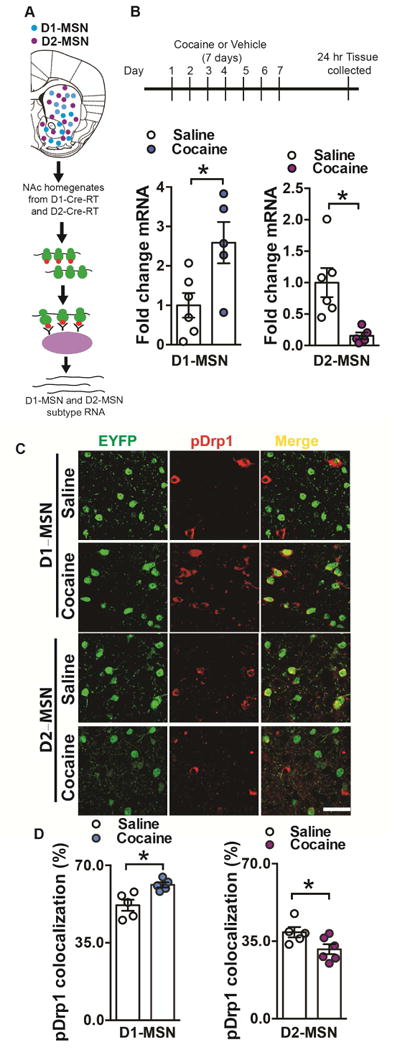
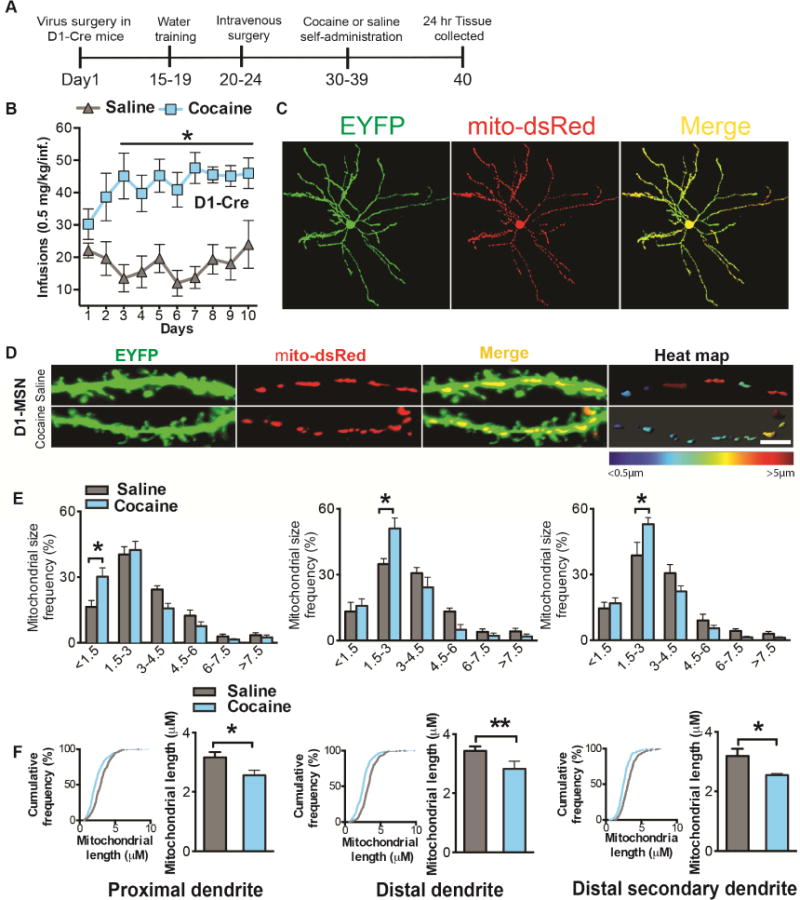
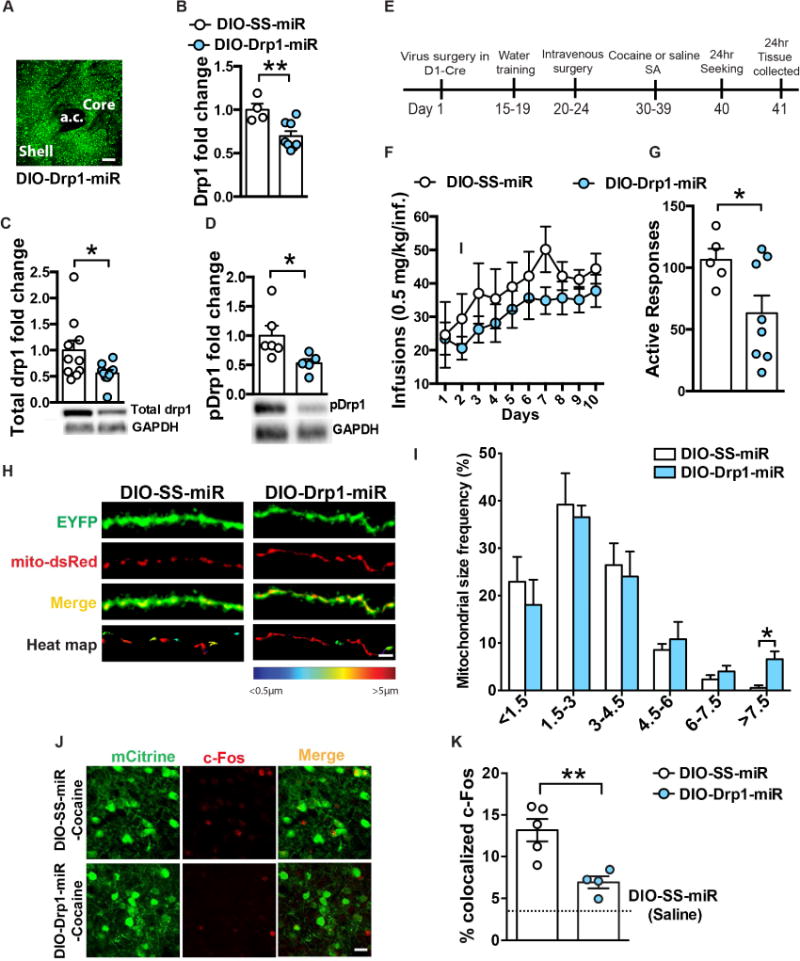
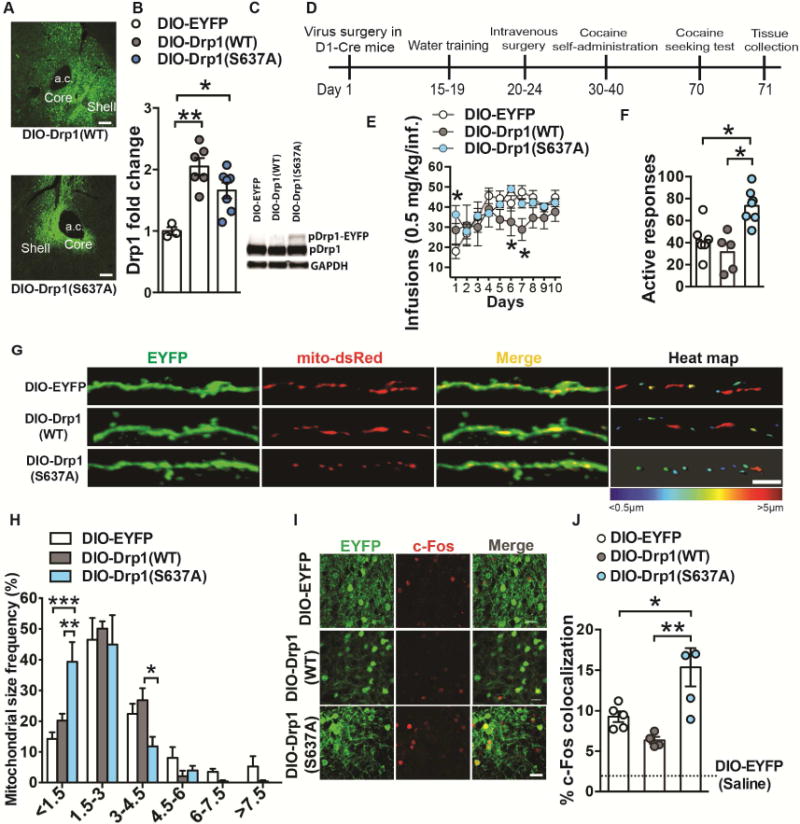
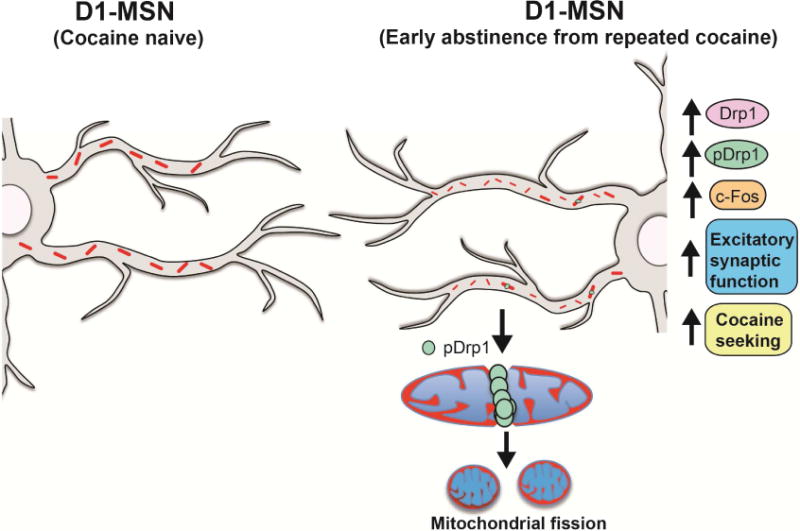
Altered brain energy homeostasis is a key adaptation occurring in the cocaine-addicted brain, but the effect of cocaine on the fundamental source of energy, mitochondria, is unknown. We demonstrate an increase of dynamin-related protein-1 (Drp1), the mitochondrial fission mediator, in nucleus accumbens (NAc) after repeated cocaine exposure and in cocaine-dependent individuals. Mdivi-1, a demonstrated fission inhibitor, blunts cocaine seeking and locomotor sensitization, while blocking c-Fos induction and excitatory input onto dopamine receptor-1 (D1) containing NAc medium spiny neurons (MSNs). Drp1 and fission promoting Drp1 are increased in D1-MSNs, consistent with increased smaller mitochondria in D1-MSN dendrites after repeated cocaine. Knockdown of Drp1 in D1-MSNs blocks drug seeking after cocaine self-administration, while enhancing the fission promoting Drp1 enhances seeking after long-term abstinence from cocaine. We demonstrate a role for altered mitochondrial fission in the NAc, during early cocaine abstinence, suggesting potential therapeutic treatment of disrupting mitochondrial fission in cocaine addiction.

Keywords: Drp1; cocaine; medium spiny neurons; mitochondria; nucleus accumbens; self-administration.


Conflict of interest statement

All authors report no biomedical financial interests or potential conflicts of interest.

Figures

Figure 1
Figure 1. Dynamin-related protein 1 (Drp1) mRNA expression is increased in NAc after repeated cocaine and postmortem NAc of cocaine dependents
(A) Repeated cocaine (7 days, 20mg/kg, ip) caused an increase in Drp1 mRNA in NAc, compared to saline treated controls Student’s t test: t=2.378, df=10, p=0.03. However, mRNA of other mitochondrial fission (Fis1) or fusion (Mfn1, Mfn2, and Opa1) genes were unaltered in NAc in cocaine vs. saline groups: Student’s t-test (in the order of the genes displayed): t=0.03, df=10, p=0.97, t=1.46, df=10, p=0.17, t=0.91, df=10, p=0.38, t=0.58, df=10, p=0.56. n=6 in each group. (B) Drp1 mRNA is increased in NAc of rats after cocaine self-administration (1mg/kg/infusion, 10 days, FR1 schedule) Student’s t test, t=2.542, df=8, p=0.03. While mRNA for other mitochondrial fission or fusion genes was unaltered after cocaine self-administration: Student’s t-test (in the order of the genes displayed): t=2.08, df=8, p=0.07, t=1.86, df=8, p=0.09, t=2.01, df=8, p=0.08, only Mfn2 showed significantly increased levels: Student’s t-test: t=3.14, df=7, p=0.01. n=5 in each group. (C) Drp1 mRNA was increased in postmortem NAc of cocaine dependents (Student’s t test, t=2.707, df=24, p=0.01) but mRNA for other mitochondrial fission or fusion genes was unchanged: Student’s t-test (in the order of the genes displayed): t=0.69, df=24, p=0.49, t=1.15, df=24, p=0.26, t=1.09, df=24, p=0.28, t=1.42, df=24, p=0.16. n=12 control and 14 cocaine dependent. *p<0.05. Error bars, SEM. See also Table S1 and Figure S1.
Figure 2
Figure 2. Inhibiting mitochondrial fission with Mdivi-1 reduces cocaine behavioral outcomes
(A) pSer616-Drp1 is increased in NAc after repeated cocaine (7 days, 20mg/kg, ip) compared to saline controls. pSer616-Drp1 levels were normalized to total Drp1 and GAPDH. Student’s t-test, t=2.551, df=18, p=0.02, n=9 saline and 11 cocaine (B) Mice pre-treated with both 25mg/kg (n=13) and 50mg/kg (n=8) did not display a change in time spent in the drug paired chamber post cocaine conditioning, whereas vehicle (n=15) and 12.5mg/kg (n=8) displayed a significant increased in time spent in the drug paired chamber post conditioning: Two-way Repeated Measure ANOVA: Time: F(1,40)=43.87, p<0.0001, Tukey post-hoc: p<0.001 and p<0.01 respectively. (C) Mice pretreated with Mdivi-1 infusion in the NAc (800μM/0.5μL/side) failed to show cocaine conditioned place preference when comparing time in the drug-paired chamber before and after conditioning, contrary to vehicle-treated animals: Two-way Repeated Measure ANOVA: Time: F(1,14)=44.81, p<0.0001, Tukey post-hoc: p<0.001; n=8 in each group. (D) Cocaine (10mg/kg)-induced locomotion was unaltered with 25mg/kg (n=7) or 50mg/kg (n=7) Mdivi-1 treatment compared to vehicle control (n=10). However, mice pretreated with 50mg/kg Mdivi-1 show reduced locomotor sensitization, compared to saline controls, when challenged with cocaine (10mg/kg) 7 days after withdrawal (Two-way Repeated Measures ANOVA: Interaction: F(16,176)=1.79, p=0.0356, Tukey post-hoc: p<0.01). (E) Rats receiving NAc infusion of Mdivi-1 (800μM; 1 μL/side; n=8) during the last 3 FR1 sessions of cocaine self-administration show similar cocaine intake compared to control group (n=9): Two-way Repeated Measures ANOVA: Interaction: F(9,150)=1.089, p=0.37. (F) When tested for cocaine seeking, 24h after the last FR1session and Mdivi-1 infusion, treated rats showed reduced responding: Student’s t-test, t=3.66, df=15; p=0.002. *p<0.05. Error bars, SEM. See also Figure S2.
Figure 3
Figure 3. Inhibiting mitochondrial fission with Mdivi-1 reduces cocaine-induced D1-MSN adaptations
(A) Representative confocal images of D1-MSNs (red), c-Fos (green) and neuronal marker NeuN (blue) in Saline-Vehicle (top), Cocaine-Vehicle (middle) and Cocaine-Mdivi-1 (bottom) groups. Scale bar: 50μm. (B) Mdivi-1 (50mg/kg, ip) reduced cocaine-induced c-Fos colocalization in D1-MSNs and leads to a modest increase of c-Fos colocalization in non-D1-MSN cells when compared to saline-vehicle controls. Two-way ANOVA: Interaction: F(2,18)=25.41, p<0.0001, Tukey post-hoc: p<0.001 and p<0.05 respectively. n=4 in each group. (C) Representative traces of AMPA/NMDA ratio in D1-MSNs of mice pre-treated with vehicle and receiving saline, mice pre-treated with vehicle receiving cocaine and mice pre-treated with Mdivi-1 receiving cocaine (left panel). Mdivi-1 (50mk/kg, ip) normalized cocaine-induced increase in AMPA/NMDA ratio: One-way ANOVA: F(2,53)=7.214, p=0.0017, Tukey post-hoc: p<0.05. Saline-Vehicle: n=14 cells, Cocaine-Vehicle: n=18 cells and Cocaine-Mdivi-1: n=24 cells, all obtained from 6 mice in each group (right panel). (D) Representative traces of rectification index in saline-vehicle (top), cocaine-vehicle (middle) and cocaine-Mdivi-1 (bottom) pre-treated mice (left panel). Quantification of AMPA current rectification index (RI): cocaine increased the RI relative to saline-treated controls, while Mdivi-1 treatment (50mg/kg, ip) reduced the RI in cocaine treated mice: One-way ANOVA: F(2,58)=11.01, p<0.0001, Tukey post-hoc: p<0.001 and p<0.01; Saline-Vehicle: n=15 cells, Cocaine-Vehicle: n=20 cells and Cocaine-Mdivi-1: n=26 cells, all obtained from 6 mice in each group (right panel). *p<0.05, **p<0.01, ***p<0.001. Error bars, SEM. See also Figure S3.
Figure 4
Figure 4. Drp1 ribosome associated mRNA is bidirectionally altered in MSN subtypes after repeated cocaine
(A) Illustration of NAc D1-MSN (blue) and D2-MSN (magenta) subtypes and the RiboTag procedure to isolate ribosome-associated mRNA from MSN subtypes using D1-Cre-RT and D2-Cre-RT mice. HA tagged (red) ribosomes are immunoprecipitated from NAc homogenates using anti-HA coupled to magnetic beads, followed by isolation of ribosome-associated mRNA from D1-MSNs and D2-MSNs. (B) Drp1 ribosome-associated mRNA is increased in D1-MSNs but reduced in D2-MSNs of D1-Cre-RT or D2-Cre-RT NAc after repeated cocaine (7 days, 20mg/kg). Student’s t test, t=2.711, df=9, p=0.02 and t=3.251, df=9, p=0.009 respectively. n=5 saline, 6 cocaine in both D1- and D2-MSNs groups. (C) Representative confocal images of pDrp1 immunostaining (red) in EYFP labeled D1- and D2-MSNs (green) following cocaine (or saline) 7 days treatment (20mg/kg, ip). Scale bar: 50μm. (D) Drp1 phosphorylation at Ser616 colocalization is increased in D1-MSNs (Student’s t-test: t=3.338, df=8, p=0.01; n=5 in each group) and decreased in D2-MSNs (Student’s t-test: t=2.355, df=9, p=0.04; n=5 saline and 6 cocaine) following cocaine repeated treatment. *p<0.05. Error bars, SEM. See also Figure S4.
Figure 5
Figure 5. NAc D1-MSNs show decreased mitochondria size following cocaine self-administration
(A) Timeline of virus injection into NAc and cocaine self-administration in D1-Cre mice. Animals first receive Cre inducible virus to label MSN cell bodies (EYFP) and mitochondria (mito-dsRed). Two weeks later they were trained for water self-administration (FR1) for 4 days, followed by catheterization surgery. After recovery, mice self-administered cocaine (FR1) for 10 consecutive days. Finally, tissue was collected 24h following the last session. (B) D1-Cre mice developed stable cocaine intake (0.5mg/kg/infusion) from day 3 onward compared to saline controls (n=8 in each group): Two-way Repeated Measures ANOVA: Interaction: F(9,126)=2.913, p=0.0036, Tukey post-hoc: p<0.05. (C) Representative confocal images of a D1-MSN co-labeled with EYFP (green) and mito-dsRed (red). (D) Representative confocal images of D1-MSN dendrites (green) with labeled mitochondria (red) after cocaine or saline self-administration (left and middle panels). The right panel displays a heat map of mitochondrial length in MSN dendrites in cocaine and saline conditions. Scale bar 5μm. (E) 3D reconstruction of dendrites and mitochondria demonstrates an increase in the frequency of smaller length mitochondria in D1-MSN proximal (left; Two-way ANOVA: Interaction: F(5,48)=4.04, p=0.0039, Bonferroni post-hoc: p<0.01.), distal (middle; Two-way ANOVA: Interaction: F(5,48)=3.839, p=0.0053, Bonferroni post-hoc: p<0.01), and distal (right; Two-way ANOVA: Interaction: F(5,48)=4.51, p=0.0019, Bonferroni post-hoc: p<0.01) secondary dendrites in the cocaine group (n=6) compared to saline controls (n=4). (F) Cumulative frequency distribution plots. A shift to the left is observed in D1-MSN dendrites implicating overall reduced mitochondrial length in D1-MSNs. Kolmogorov-Smirnov test: the maximum difference between the cumulative distributions D=0.19, 0.21 and 0.19μm in D1-MSN proximal, distal and distal secondary dendrites respectively, p<0.0001. The overall length of mitochondria is reduced in D1-MSN proximal (Student’s t-test: t=2.337, df=8, p=0.04), distal (Student’s t-test: t=4.969, df=8, p=0.001) and distal secondary (Student’s t-test: t=2.911, df=8, p=0.02) dendrites in the cocaine (n=6) group as compared to saline (n=4). *p<0.05, **p<0.01. Error bars, SEM. See also Figure S5.
Figure 6
Figure 6. Blocking mitochondrial fission through Drp1 knockdown decreases cocaine seeking
(A) Representative confocal image of AAV-DIO-Drp1-miR expression in the NAc of D1-Cre mice. Scale bar: 100μm. (B) Virally-mediated Drp1 knockdown reduced Drp1 mRNA (31%, Student’s t-test: t=3.241, df= 10, p=0.008; n=4 SS-miR and 8 Drp1-miR), (C) Total Drp1 (Student’s t-test: t=2.214, df=18, p=0.04; n=10 in each group) and (D) pDrp1 are reduced (44% and 47% respectively in NAc after Drp1-miR expression in D1-MSNs (Student’s t-test: t=2.373, df=9, p=0.04; n=6 SS-miR and 5 Drp1-miR) levels. (E) Timeline of the experiment: cocaine seeking was performed 24h after the last FR1 session. (F) Drp1 knockdown in NAc D1-MSNs had no effect on cocaine self-administration (FR1, 0.5mg/kg/inf): Two-way Repeated Measures ANOVA: Interaction: F(9,99)=0.4373, p=0.9118, but (G) decreased cocaine seeking 24h after the last FR1 session: Student’s t-test: t=2.208, df=11, p=0.04; n=5 scramble and 8 Drp1-miR. (H) Representative confocal images of D1-MSN dendrites (green) with labeled mitochondria (red) after cocaine self-administration from SS-miR and Drp1-miR groups. Scale bar: 5μm. (I) Blocking mitochondrial fission increased the frequency of longer size mitochondria (>7.5 μm) in the dendrites of D1-MSNs (Student’s t-test: t=3.142, df=7, p=0.01; n=4 scramble and 5 Drp1-miR). (J) Representative confocal images of D1-MSNs labeled with mCitrine (green) showing c-Fos (red) colocalization. Scale bar: 25μm. (K) Drp1 knockdown reduces cocaine-induced c-Fos expression in D1-MSNs: One-way ANOVA: F(2,9)=19.9, p=0.0005. Scramble-Saline n=3, Scramble-Cocaine n=5, Drp1-miR n= 4. *p<0.05, **p<0.01. Error bars, SEM. See also Figure S6.
Figure 7
Figure 7. Enhancing fission promoting Drp1 in D1-MSNs increases acquisition to cocaine self-administration and seeking after long-term abstinence
(A) Conditional expression of DIO-Drp1(WT)-EYFP and DIO-Drp1(S637A)-EYFP in the nucleus accumbens. Scale bar, 100μm. (B) AAV delivery of DIO-Drp1(WT)-EYFP and DIO-Drp1(S637A)-EYFP to NAc of D2-Cre mice results in an increase of Drp1 mRNA. One-way ANOVA: F(2,13)=11.15, p=0.0015, Tukey post-hoc: p<0.01 and p<0.05, n=3, 6 and 7 respectively. (C) NAc of D2-Cre mice receiving DIO-Drp1(S637A)-EYFP display an additional p-Ser616-Drp1-EYFP fusion protein band while DIO-EYFP and DIO-Drp1(WT)-EYFP mice do not display this band. GAPDH was used as a loading control. (D) Timeline of virus surgery, water training, cocaine self-administration, and seeking test. (E) Overexpression of Drp1(S637A)-EYFP in D1-MSNs resulted in higher cocaine intake on day 1 of self-administration compared to EYFP controls. Drp1(WT) expression attenuated cocaine intake on days 6 and 7 compared to Drp1(S637A)-EYFP and EYFP groups respectively: Two-way Repeated Measures ANOVA: Interaction F(18,144)=1.896: p=0.02, Tukey post-hoc: p<0.05. n=7, 5 and 7 respectively. (F) Overexpression of Drp1-S637A in D1-MSNs resulted in increased drug seeking 30 days after the last cocaine self-administration session: One-way ANOVA F(2,16)=11.22, p<0.01 Tukey post-hoc: p<0.05. (G) Representative confocal images of D1-MSN dendrites (green) with labeled mitochondria (red) after cocaine self-administration of mice inject with AAV-DIO-EYFP (top), AAV-DIO-Drp1(WT)-EYFP (middle) and AAV-DIO-Drp1(S637A)-EYFP (bottom) vectors. The right panel displays a heat map of mitochondrial length in MSN dendrites in cocaine and saline conditions. Scale bar 5μm. (H) Mice expressing the constitutively active form of Drp1 (AAV-DIO-Drp1(S637A)-EYFP) showed increased smaller size mitochondria (<1.5μm) as well as increased longer size mitochondria (3–4.5μm): Two-way ANOVA: Interaction F(10,72)=3.530: p<0.0008, Tukey post-hoc: p<0.05, p<0.01, p<0.001. n=5 in each group. (I) Representative confocal images of D1-MSNs labeled with EYFP (green) and c-Fos (red) from mice expressing EYFP (top), Drp1(WT)-EYFP (middle) or Drp1(S637A)-EYFP (bottom). Scale bar 25μm. (J) Overexpression of the constitutively active form of Drp1 (AAV-DIO-Drp1(S637A)-EYFP) increased drug-induced c-Fos colocalization in D1-MSNs of mice that received cocaine (20mg/kg, ip, 10 days) compared to AAV-DIO-EYFP and AAV-DIO-Drp1(WT)-EYFP. All cocaine groups displayed a significant increase in D1-MSN and c-Fos colocalization compared to saline AAV-DIO-EYFP controls: One-way ANOVA F(2,11)=8.771, p=0.005, Tukey post-hoc: p<0.05, p<0.01. AAV-DIO-EYFP (n=5), AAV-DIO-Drp1(WT)-EYFP (n=4) and AAV-DIO-Drp1(S637A)-EYFP (n=5). *p<0.05, **p<0.01, ***p<0.001. Error bars, SEM. See also Figure S7.
Figure 8
Figure 8. Model of Drp1-mediated mitochondrial fission in D1-MSNs during early abstinence from repeated cocaine
In NAc D1-MSNs, repeated cocaine exposure increases Drp1 levels. Enhanced phosphorylation of Drp1 at Ser616 leads to an abundance of smaller mitochondria, reflective of enhanced fission, in D1-MSN dendrites. The enhanced mitochondrial fission in D1-MSN dendrites is associated with increased c-Fos reactivity and increased excitatory synaptic function in this MSN subtype. These adaptations ultimately cause cocaine-induced behavioral responses, such as cocaine seeking.

References

    1. Bock R, Shin JH, Kaplan AR, Dobi A, Markey E, Kramer PF, Gremel CM, Christensen CH, Adrover MF, Alvarez VA. Strengthening the accumbal indirect pathway promotes resilience to compulsive cocaine use. Nat Neurosci. 2013;16:632–638. - PMC - PubMed
    1. Bordt EA, Clerc P, Roelofs BA, Saladino AJ, Tretter L, Adam-Vizi V, Cherok E, Khalil A, Yadava N, Ge SX, et al. The Putative Drp1 Inhibitor mdivi-1 Is a Reversible Mitochondrial Complex I Inhibitor that Modulates Reactive Oxygen Species. Dev Cell. 2017;40:583–594. - PMC - PubMed
    1. Cai N, Li Y, Chang S, Liang J, Lin C, Zhang X, Liang L, Hu J, Chan W, Kendler KS, et al. Genetic Control over mtDNA and Its Relationship to Major Depressive Disorder. Curr Biol. 2015;25:3170–3177. - PMC - PubMed
    1. Calipari ES, Bagot RC, Purushothaman I, Davidson TJ, Yorgason JT, Pena CJ, Walker DM, Pirpinias ST, Guise KG, Ramakrishnan C, et al. In vivo imaging identifies temporal signature of D1 and D2 medium spiny neurons in cocaine reward. Proc Natl Acad Sci USA. 2016;113:2726–2731. - PMC - PubMed
    1. Cassidy-Stone A, Chipuk JE, Ingerman E, Song C, Yoo C, Kuwana T, Kurth MJ, Shaw JT, Hinshaw JE, Green DR, Nunnari J. Chemical. Inhibition of the Mitochondrial Division Dynamin Reveals Its Role in Bax/Bak-Dependent Mitochondrial Outer Membrane Permeabilization. Dev Cell. 2008;14:193–204. - PMC - PubMed

Publication types

MeSH terms