Comparative Study
. 2017 Dec 21;14(1):55.
doi: 10.1186/s12989-017-0236-y.

Sub-chronic inhalation of lead oxide nanoparticles revealed their broad distribution and tissue-specific subcellular localization in target organs

Affiliations
Comparative Study

Sub-chronic inhalation of lead oxide nanoparticles revealed their broad distribution and tissue-specific subcellular localization in target organs

J Dumková et al. Part Fibre Toxicol. .

Abstract

Background: Lead is well known environmental pollutant, which can cause toxic effects in multiple organ systems. However, the influence of lead oxide nanoparticles, frequently emitted to the environment by high temperature technological processes, is still concealed. Therefore, we investigate lead oxide nanoparticle distribution through the body upon their entry into lungs and determine the microscopic and ultramicroscopic changes caused by the nanoparticles in primary and secondary target organs.

Methods: Adult female mice (ICR strain) were continuously exposed to lead oxide nanoparticles (PbO-NPs) with an average concentration approximately 106 particles/cm3 for 6 weeks (24 h/day, 7 days/week). At the end of the exposure period, lung, brain, liver, kidney, spleen, and blood were collected for chemical, histological, immunohistochemical and electron microscopic analyses.

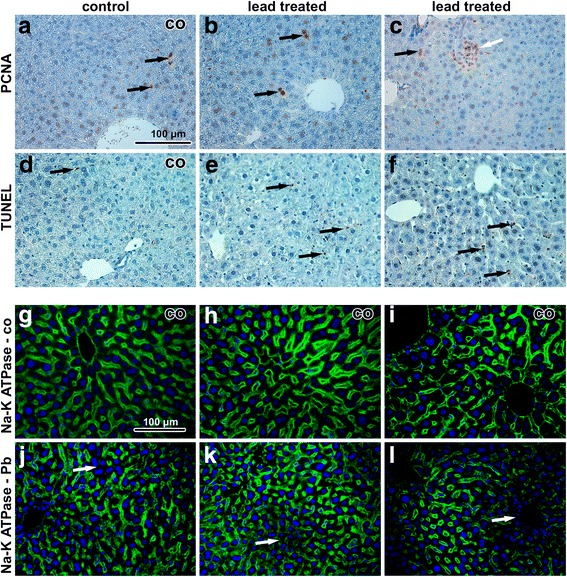
Results: Lead content was found to be the highest in the kidney and lungs, followed by the liver and spleen; the smallest content of lead was found in brain. Nanoparticles were located in all analysed tissues and their highest number was found in the lung and liver. Kidney, spleen and brain contained lower number of nanoparticles, being about the same in all three organs. Lungs of animals exposed to lead oxide nanoparticles exhibited hyperaemia, small areas of atelectasis, alveolar emphysema, focal acute catarrhal bronchiolitis and also haemostasis with presence of siderophages in some animals. Nanoparticles were located in phagosomes or formed clusters within cytoplasmic vesicles. In the liver, lead oxide nanoparticle exposure caused hepatic remodeling with enlargement and hydropic degeneration of hepatocytes, centrilobular hypertrophy of hepatocytes with karyomegaly, areas of hepatic necrosis, occasional periportal inflammation, and extensive accumulation of lipid droplets. Nanoparticles were accumulated within mitochondria and peroxisomes forming aggregates enveloped by an electron-dense mitochondrial matrix. Only in some kidney samples, we observed areas of inflammatory infiltrates around renal corpuscles, tubules or vessels in the cortex. Lead oxide nanoparticles were dispersed in the cytoplasm, but not within cell organelles. There were no significant morphological changes in the spleen as a secondary target organ. Thus, pathological changes correlated with the amount of nanoparticles found in cells rather than with the concentration of lead in a given organ.

Conclusions: Sub-chronic exposure to lead oxide nanoparticles has profound negative effects at both cellular and tissue levels. Notably, the fate and arrangement of lead oxide nanoparticles were dependent on the type of organs.

Keywords: Brain; Electron microscopy; Inhalation; Kidney; Lead oxide; Liver; Lung; Nanoparticles; Spleen; Toxicity.


Conflict of interest statement

Ethics approval

The experiments were performed in accordance with the ethics policy of the Institute of Animal Physiology and Genetics (no. 081/2010).

Consent for publication

The manuscript as submitted has been read and approved by all authors.

Competing interests

The authors declared that they have no competing interests.

Publisher’s Note

Springer Nature remains neutral with regard to jurisdictional claims in published maps and institutional affiliations.

Figures

Fig. 1
Fig. 1
Content of lead in organs following 6 weeks exposure of PbO-NPs. a, b Concentration of lead in organs following six weeks exposure. c, d Lead content (uptake) in organs following six weeks exposure
Fig. 2
Fig. 2
Content of lead in blood following 6 weeks exposure
Fig. 3
Fig. 3
Effect of inhalation of lead oxide nanoparticles on lung following 6 weeks exposure. a-d control tissues stained with Hematoxylin-Eosin. e-h exposed tissues stained with Hematoxylin-Eosin. Arrows show alterations in lung tissue as thickened septs with congested capillaries (e), alveolar emphysema (f), full-range perivascular infiltrate (g), hemostase with siderophages (h). Scale bar in panels a-h = 100 μm. i-m lung tissue after treatment in transmission electron microscope. i, i’ nanoparticles in cytoplasmic vesicle of alveolar epithelial cell type I, erythrocyte (ery) present in alveolar space. j, j’ nanoparticles in vesicle of alveolar epithelial cell type I. k, k’ nanoparticle beneath edematous changed alveolar epithelial cell type I (epi), neighboring alveolar epithelial cell type I (ep) is intact. l microthrombus in lung venule, accumulation of thrombocytes (thr) is obvious. m thrombocyte (thr) adhering to endothelial cell (ec). Arrowheads show nanoparticles
Fig. 4
Fig. 4
Immunostaining of lung samples following 6 weeks exposure to PbO-NPs. a-c PCNA in lung tissue. Arrows indicate PCNA-positive cells in lung. The highest amount of positive cells is in infiltrates. d-f TUNEL in lung tissue. Arrows indicate TUNEL-positive cells, mainly macrophages and some immune cells in infiltrates. g-i Na-K ATPase in control samples. Cells with high positivity are macrophages and bronchiolar epithelial cells. j-l Na-K ATPase in treated samples without outstanding changes. Arrows indicate positive macrophages. Scale bar in all panels = 100 μm
Fig. 5
Fig. 5
Effect of inhalation of lead oxide nanoparticles on liver following 6 weeks exposure. a, e Hematoxylin-Eosin stained liver samples. b, f Toluidine Blue stained semithin sections. c, g Green-Trichrome stained liver samples. d, h PAS staining. Arrows show alterations in liver tissue as hypertrophy of hepatocytes with karyomegaly, vacuolated cytoplasm (e, f), and focal necrosis (fn). Detail of groups of lipid droplets in hepatocyte identifiably in Toluidine Blue staining (the upper corner in panel f). Scale bar in panels a-h = 100 μm. i-p Subcellular changes in liver tissue after lead treatment. i, j affected hepatocytes (hc) with vacuolated cytoplasm, unnatural sinusoidal endothelial cells (si), and bile duct epithelial cells (bd). k, l abundant lipid droplets (li) and nuclei (nu) in hepatocyte. m-o nanoparticles (arrowheads) in hepatocyte mitochondria (mi), next to nucleus (nu). p nanoparticles (arrowhead) in hepatocyte peroxisome (pe)
Fig. 6
Fig. 6
Immunostaining of liver samples following 6 weeks exposure to PbO-NPs. a-c PCNA in liver tissue. Arrows indicate PCNA-positive cells in liver. In controls, PCNA positive cells are mainly sinusoid lining cells while after treatment (a), PCNA positive are hepatocytes (b, c – black arrows). The highest amount of positive cells is present in mononuclear infiltrates (islands of extramedullary hematopoiesis, c - white arrow). d-f TUNEL in liver tissue. Arrows indicate TUNEL-positive cells, mainly sinusoid lining cells as e.g. Kupffer cells. g-i Na-K ATPase in control samples. Membranes of hepatocytes show high positivity of enzymes, cords of hepatocytes are commonly arranged in lobules. j-l Na-K ATPase in treated samples. White arrows indicate regions in lobules without positivity. Hepatocytes are irregularly organized, different sized and often binucleated. Scale bar in all panels = 100 μm
Fig. 7
Fig. 7
X-EDS analysis in treated samples of liver. Data obtained from analyzed ROI of treated samples. Nickel observed during analysis was issued from the grid
Fig. 8
Fig. 8
Effect of inhalation of lead oxide nanoparticles on kidney following 6 weeks exposure. a-f kidney tissues stained with Hematoxylin-Eosin. g-i kidney tissues stained with Green-Trichrome. Arrows indicate mononuclear infiltrations. Scale bar in panels a-i = 100 μm. j-o kidney tissue in transmission electron microscope. j control sample of renal corpuscle, podocyte (po), parietal cell (pc), endothelial cell (ec), thrombocyte (thr) in glomerular capillary. k alteration of filtration barrier (fb) morphology after treatment, body of podocyte (po). l intact tubules - proximal tubules (pt), distal tubule (dt) in kidney cortex of lead treated animal. m nanoparticle freely in epithelial cell cytoplasm of proximal tubule, mitochondrion (mi), basement membrane (bm). n nanoparticles freely in intercalated cell cytoplasm of cortical collecting duct. o nanoparticles freely in parietal cell cytoplasm (pc) of Bowman capsule, next to podocyte (po). Details of nanoparticles in the upper corner of panels m, n, o. Arrowheads show nanoparticles
Fig. 9
Fig. 9
Immunostaining of kidney samples following 6 weeks exposure to PbO-NPs. a-c PCNA in kidney tissue. Arrows indicate PCNA-positive cells in kidney. An enormous amount of positive cells is in infiltrates. d-f TUNEL in kidney tissue. Arrows indicate TUNEL-positive cells, individually located mostly in infiltrates. g-i Na-K ATPase in control samples. Cells with high positivity of enzyme are epithelial cells of distal tubules. j-l Na-K ATPase in treated samples. Arrows indicate decreased activity of enzyme in the epithelial cells of proximal tubules. Scale bar in all panels = 100 μm
Fig. 10
Fig. 10
Effect of inhalation of lead oxide nanoparticles on brain following 6 weeks exposure. a, b HE staining - hippocampal region in control (co) sample, round and palely stained nuclei of pyramidal neurons of Ammon’s horn in CA1 region. c, d HE staining - hippocampal region in treated sample. Black arrows (c, d) show region of spongiform changes in white matter. e-h Neurofilament staining of hippocampal region with affected neurons in CA1 region. Blue arrows indicate dark shrunken damaged pyramidal neurons (d, h). i-l HE staining of fiber tracts beneath hippocampal region. m-p Luxol fast blue staining. Black arrows (l, p) point to regions of spongiform changes in white matter. Scale bar in panels a, c, e, g, i, k, m, o = 200 μm. Scale bar in panels b, d, f, h, j, l, n, p = 100 μm. q-u’ Subcellular analysis of brain following 6 weeks exposure to lead oxide nanoparticles. q, r brain tissue in control sample with neuron nucleus (nu), its cytoplasm (cy), and surrounding neuropil (np), capillaries (ca) with continuous endothelial lining, thick basal lamina, pericyte (pe), and surrounding neuropil (np). s brain capillary after treatment, thrombocyte (thr) in capillary lumen, endothelial cell (ec) is unaffected, pericyte cytoplasm (pe) contains nanoparticle, neuropil (np) is surrounding. s’ detail of nanoparticle in pericyte. t, t’ nanoparticle observed freely in neuron process. u, u’ presynaptic (pre) terminal with synaptic vesicles and mitochondrion, and postsynaptic (po) terminal with observed nanoparticle. Arrowheads show nanoparticles

References

    1. Grandjean P. Even low-dose lead exposure is hazardous. Lancet. 2010;376:855–856. doi: 10.1016/S0140-6736(10)60745-3. - DOI - PubMed
    1. Lippmann M. Environmental toxicants: human exposures and their health effects. Hoboken: Wiley; 2000. - PMC - PubMed
    1. Wang M, Chen WH, Zhu DM, She JQ, Ruan DY. Effects of carbachol on lead-induced impairment of the long-term potentiation/depotentiation in rat dentate gyrus in vivo. Food Chem Toxicol. 2007;45:412–418. doi: 10.1016/j.fct.2006.08.025. - DOI - PubMed
    1. Nascimento C, Risso W, Martinez C. Lead accumulation and metallothionein content in female rats of different ages and generations after daily intake of Pb-contaminated food. Environ Toxicol Pharmacol. 2016;48:272–277. doi: 10.1016/j.etap.2016.11.001. - DOI - PubMed
    1. Sobanska S, Ricq N, Laboudigue A, Guillermo R, Bremard C, Laureyns J, Merlin J, Wignacourt J. Microchemical investigations of dust emitted by a lead smelter. Environmental Science & Technology. 1999;33:1334–1339. doi: 10.1021/es9805270. - DOI

Publication types

MeSH terms

LinkOut - more resources