. 2018 Jan:27:258-274.
doi: 10.1016/j.ebiom.2017.12.011. Epub 2017 Dec 13.

HtrA1 Mediated Intracellular Effects on Tubulin Using a Polarized RPE Disease Model

Affiliations

HtrA1 Mediated Intracellular Effects on Tubulin Using a Polarized RPE Disease Model

Esther Melo et al. EBioMedicine. 2018 Jan.

Abstract

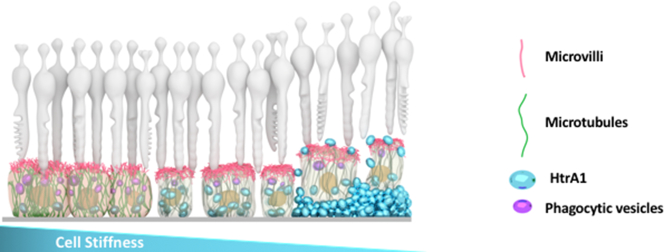
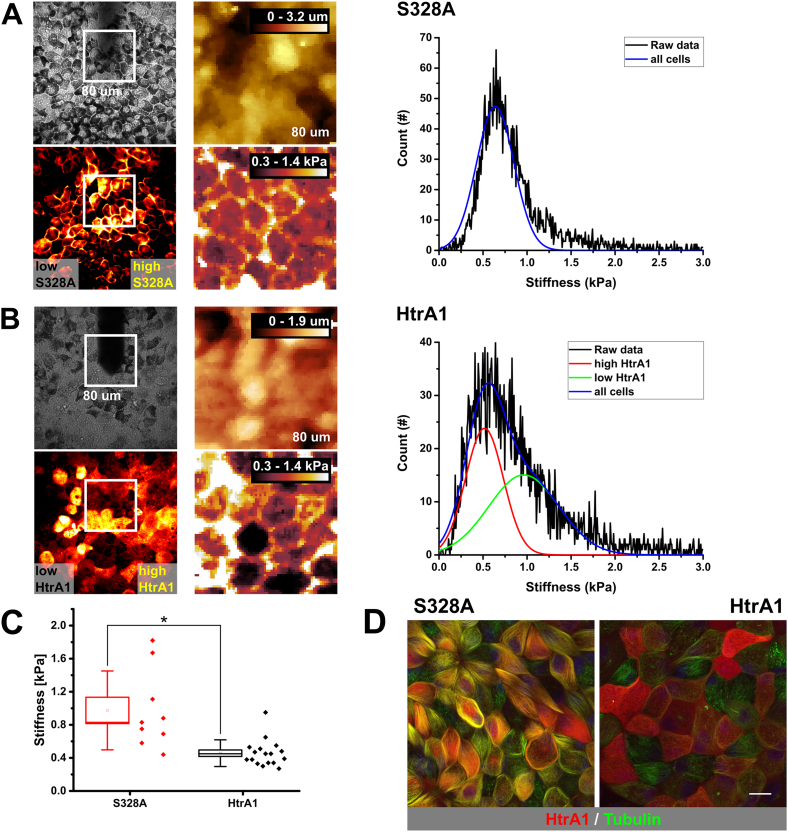
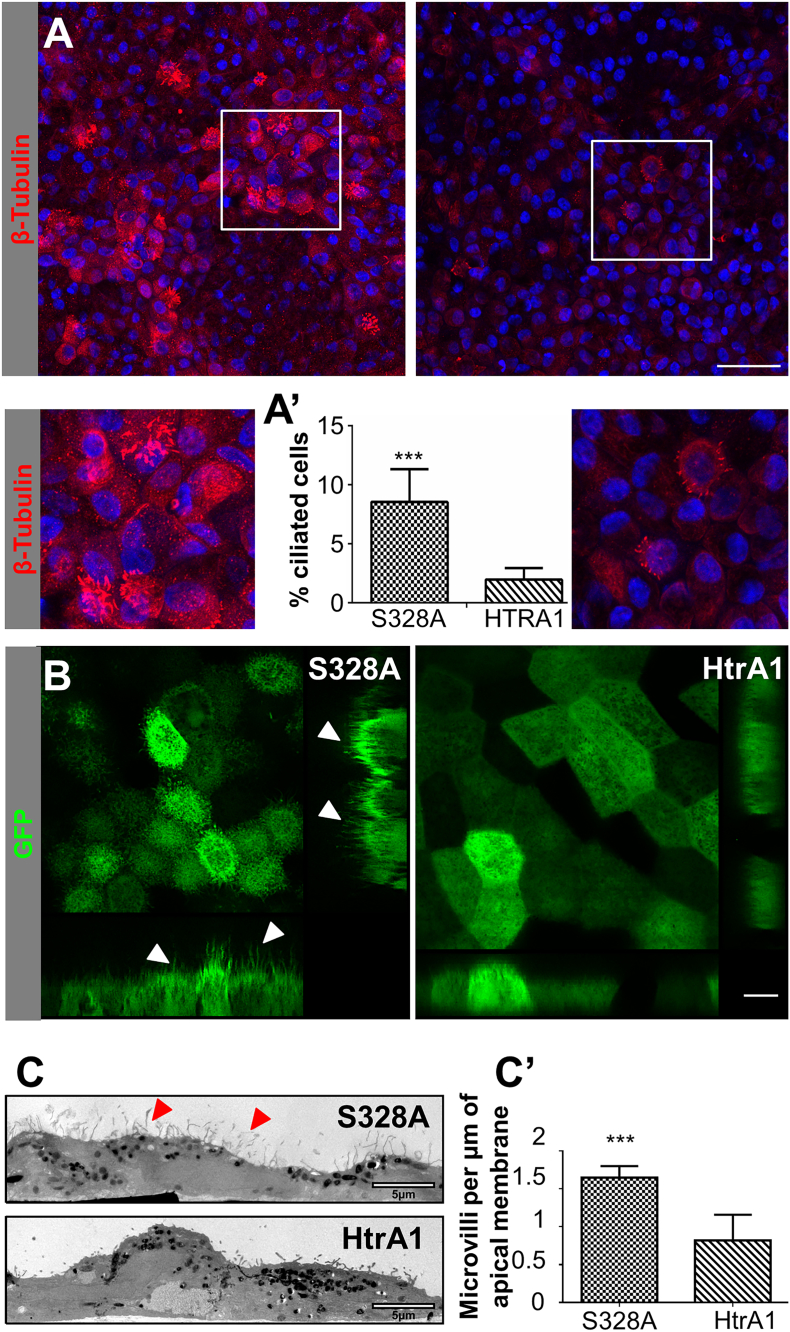
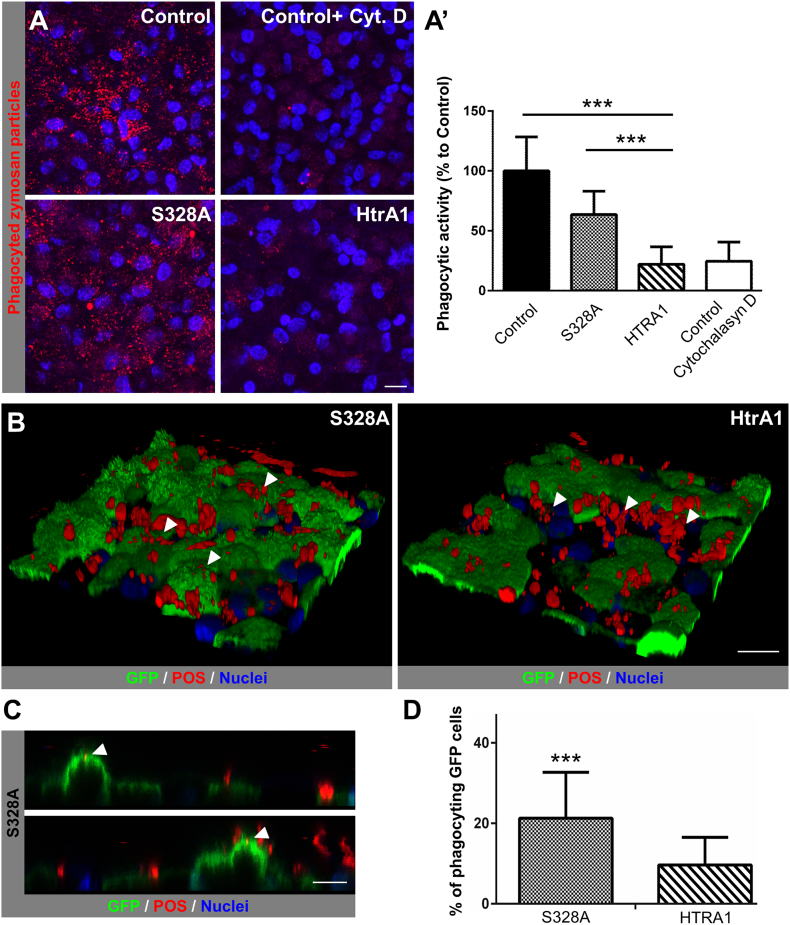
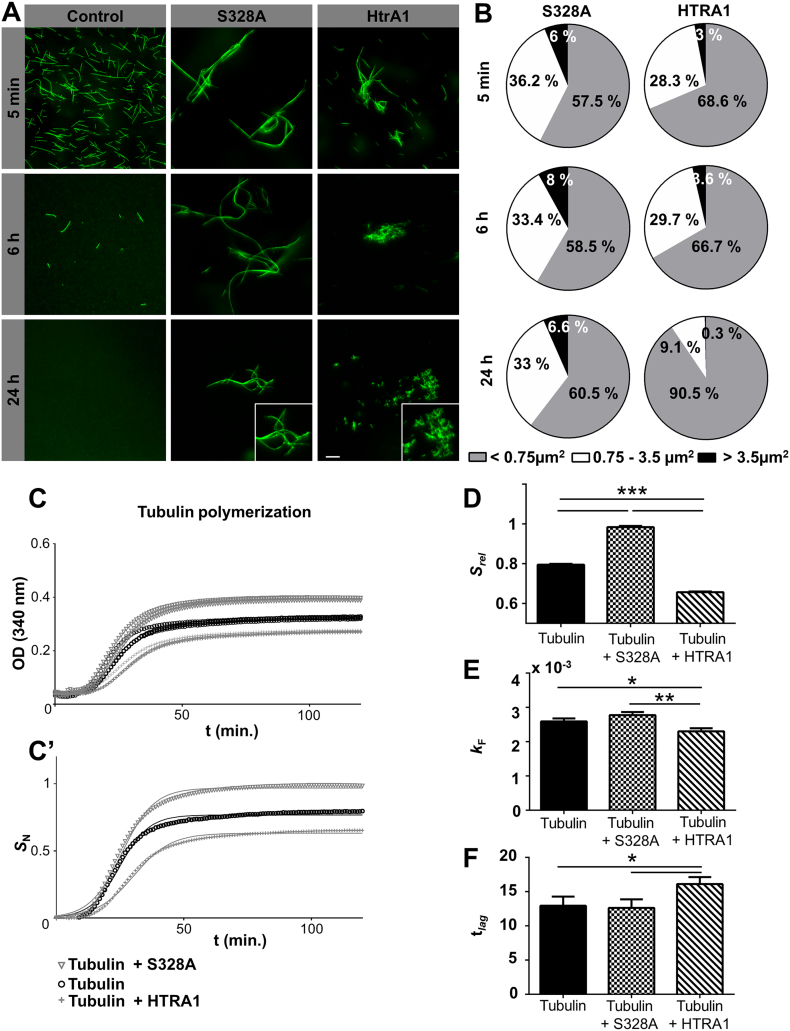
Age-related macular degeneration (AMD) is the leading cause of irreversible vision loss. The protein HtrA1 is enriched in retinal pigment epithelial (RPE) cells isolated from AMD patients and in drusen deposits. However, it is poorly understood how increased levels of HtrA1 affect the physiological function of the RPE at the intracellular level. Here, we developed hfRPE (human fetal retinal pigment epithelial) cell culture model where cells fully differentiated into a polarized functional monolayer. In this model, we fine-tuned the cellular levels of HtrA1 by targeted overexpression. Our data show that HtrA1 enzymatic activity leads to intracellular degradation of tubulin with a corresponding reduction in the number of microtubules, and consequently to an altered mechanical cell phenotype. HtrA1 overexpression further leads to impaired apical processes and decreased phagocytosis, an essential function for photoreceptor survival. These cellular alterations correlate with the AMD phenotype and thus highlight HtrA1 as an intracellular target for therapeutic interventions towards AMD treatment.

Keywords: Age-related macular degeneration; Cell stiffness; Disease modelling; HtrA serine peptidase 1; Mechanical properties; Phagocytic activity; Polarized human retinal, pigmented epithelium.


Figures

Image 2
Graphical abstract
Fig. 1
Fig. 1
Polarized RPE cell model characterization. (A) Retinal histological sections immunostained against HtrA1 (pink) from a healthy subject (left) and an AMD patient (right). Nuclei stained with eosin. Yellow arrows indicate RPE cells. Green arrows indicate the BM (B) Differentiation protocol. (C) Panel of genes that by RNA sequencing experienced an increase along the differentiation time. (D) Representative images of several characteristic RPE markers: Na+ K+ ATPase, PEDF, E-cadherin, N-cadherin, claudin 19 and occludin (green); DAPI (blue); scale bar, 10 μm. (E) Transmission electron micrographs from hfRPE at day 35 of differentiation; scale bar, 5 μm. Asterisks indicate the nucleus (F) Phase contrast image of hfRPE cells at the end of the differentiation; scale bar, 50 μm. (G) Mechanical characterization along the differentiation at 4, 9, 14 and 35 days in culture. Mean values and ± SD for nuclei, cytoplasm and cell junctions from three independent experiments. (G′) Representative force-indentation maps at days 4, 9, 14 and 35 of culture; scale bar, 10 μm. See also Fig. S1.
Fig. 2
Fig. 2
HtrA1 interacts with tubulin. (A) Immunoprecipitation against β-tubulin and detection of HtrA1 and β-tubulin in lysates obtained from HtrA1 and S328A HtrA1 overexpressing RPE cells. Left, input material in the column. Right, bound fraction. See also Fig. S2. (B) Western blot gels for HtrA1 and β-tubulin, representative of a single experiment from cell lysates incubated in increasing concentration of anti-HtrA1 competing antibody. Left, lysate from HtrA1 overexpressing cells. Right, lysate from S328A overexpressing cells. (C) Mass Spectrometry identification of possible HtrA1 interactors by immunocompetition assays. Concentration of HtrA1 and other beta subunits decay as the antibody competition antibody increases. Orange, lysate from HtrA1 overexpressing cells. Blue, lysate from S328A overexpressing cells.
Fig. 3
Fig. 3
HtrA1 overexpression associates with tubulin loss and localization at the adherens junctions. (A) IF representative confocal image of S328A (left) and HtrA1 (right) overexpressing RPE at day 35 of culture. β-tubulin (red), HtrA1 (cyan) and DAPI (blue); scale bar, 10 μm. (A’) β-tubulin intensity quantification in HtrA1 positive cells at day 35 of culture. Data represent the mean ± SD of three independent experiments, ***p < 0.001. (B) IF high-resolution confocal images (xy plane) of tubulin, claudin-19 and E-cadherin (red) and HrA1 (cyan), DAPI (blue). The apical membrane faces the top. Yellow arrows indicate cells containing less tubulin. White arrows indicate localization of HtrA1 under claudin-19 and co-localization of HtrA1 and E-cadherin. Scale bar, 5 μm. (C) Transmission electron micrographs from immune-gold detection of HtrA1 in S328A, left panel, and HtrA1 overexpressing cells, right panel. Scale bars, 500 nm and 200 nm. Red arrows indicate gold localization. Dashed line indicates the limit between cells.
Fig. 4
Fig. 4
The nanomechanical fingerprint of RPE cells overexpressing HrA1 and S328A variant. (A/B, left panels) The cell viability and position of the AFM probe is monitored in the brightfield signal for each experiment. Live-Fluorescence imaging allowed for identifying the overexpressing cells (white insert). AFM topography and stiffness data belonging to the measurements (white insert). (A, right panel) Stiffness data, S328A variant cells exhibit similar properties when compared to the neighboring negative cells. (B, right panel) Stiffness data, HtrA1 overexpressing cells showed a 2-fold decrease for RPEs overexpressing HtrA1 (red line) when compared to cells having a low HtrA1 content (green line). (C) Quantitative stiffness analysis over multiple measurements. N = 9 maps (n = 92 cells) for S328A and N = 17 maps (n = 168 cells) for HtrA1, *p < 0.05. (D) Live cell imaging Halotag TMR ligand for HtrA1 (red), SiR-Tubulin (green) and Hoechst (blue). Scale bar, 20 μm.
Fig. 5
Fig. 5
HtrA1 overexpression leads to apical impairment. (A) IF confocal images of RPE at day 35 of culture. β-tubulin (red) and DAPI (blue). Left image, S328A overexpressing cells; right image, HtrA1 overexpressing cells. Scale bar, 50 μm. Close up images show ciliated cells. (A′) % of ciliated cells in the RPE population. Data represent the mean ± SD of three independent experiments, ***p < 0.001. See also Fig. S3. (B) Life cell imaging of RPE cells at day 35 of culture. Left, S328A overexpressing RPE; right, HtrA1 overexpressing RPE. The apical membrane faces the top. Scale bar, 10 μm. (C) Transmission Electron micrographs of S328A (above) and Htra1 (below) overexpressing cells. Scale bar, 5 μm. (C′) Microvilli per μm of apical membrane. Data represent the mean ± SD of one experiment, ***p < 0.001.
Fig. 6
Fig. 6
HtrA1 overexpression is accompanied by a decrease in the phagocytosis activity. (A) Representative confocal images of Zymosan A treated hfRPE from control cells, control cells treated with Cytochalasyn D, overexpressing S328A cells and HtrA1 overexpressing cells. Zymosan A particles (red) and Hoechst (blue). Scale bar, 10 μm (A′) Phagocytic activity (in % to control cells) from S328A overexpressing cells, HtrA1 overexpressing cells and control cells treated with Cytochalasyn D at day 35 of culture. Mean ± SD of three independent experiments, ***p < 0.001. (B) Life cell imaging of RPE cells while the process of phagocytosis. Left, S328A overexpressing cells; right, HtrA1 overexpressing cells. POS (red), GFP (green) and Hoechst (blue). Scale bar, 20 μm. (C) Close up image of S328A cells in the moment of particle uptake. POS (red), GFP (green) and Hoechst (blue). Scale bar, 10 μm (D) % of phagocyting GFP cells. Mean ± SD of two independent experiments, ***p < 0.001.
Fig. 7
Fig. 7
HtrA1 degrades preformed MT and avoids polymerization in vitro. (A) MT polymerized in vitro and incubated with S328A HtrA1 (center) and HtrA1 (right). Images acquired at 5 min, 6 h and 24 h after adding the protease. Scale bar, 10 μm. (B) Quantification of the area occupied by the MT 5 min, 6 h and 24 h after adding the protease. (C) Microtubule polymerization reactions in the absence or presence of S328A HtrA1 and HtrA1. As a representative growth signal, the absorbance at 340 nm was monitored in vitro as a function of time for three independent replicates. (C′) The average growth signal for each variant was calculated and normalized relative to the overall maximum. Best fits to sigmoidal function are shown with solid lines. (D) Comparison of the growth amplitudes (Srel), (E) kinetic rate constants (kF), (F) nucleation time (tlag) of microtubule polymerization reaction in the absence or presence of S328A HtrA1 and HtrA1. Mean ± SD for three replicates are reported, *p < 0.05, **p < 0.01, ***p < 0.001.

References

    1. Augustin A., Lamerz J., Meistermann H., Golling S., Scheiblich S., Hermann J.C., Duchateau-Nguyen G., Tzouros M., Avila D.W., Langen H. Quantitative chemical proteomics profiling differentiates erlotinib from gefitinib in EGFR wild-type non-small cell lung carcinoma cell lines. Mol. Cancer Ther. 2013;12:520–529. - PubMed
    1. Barturen G., Rueda A., Hamberg M., Alganza A., Lebron R., Kotsyfakis M., Bu-Jun S., Kopper-Lalic D., Hackenberg M. sRNAbench: profiling of small RNAs and its sequence variants in single or multi-species high-throughput experiments. De Gruyter Open. 2014;1:21–31.
    1. Bonilha V.L. Age and disease-related structural changes in the retinal pigment epithelium. Clinical Ophthalmology (Auckland, NZ) 2008;2:413–424. - PMC - PubMed
    1. Booij J.C., Baas D.C., Beisekeeva J., Gorgels T.G., Bergen A.A. The dynamic nature of Bruch's membrane. Prog. Retin. Eye Res. 2010;29:1–18. - PubMed
    1. Cabrera A.C., Melo E., Roth D., Topp A., Delobel F., Stucki C., Chen C.Y., Jakob P., Banfai B. HtrA1 activation is driven by an allosteric mechanism of inter-monomer. Communication. 2017;7 - PMC - PubMed

MeSH terms

Substances