A framework for exhaustively mapping functional missense variants
- PMID: 29269382
- PMCID: PMC5740498
- DOI: 10.15252/msb.20177908
A framework for exhaustively mapping functional missense variants
Abstract
Although we now routinely sequence human genomes, we can confidently identify only a fraction of the sequence variants that have a functional impact. Here, we developed a deep mutational scanning framework that produces exhaustive maps for human missense variants by combining random codon mutagenesis and multiplexed functional variation assays with computational imputation and refinement. We applied this framework to four proteins corresponding to six human genes: UBE2I (encoding SUMO E2 conjugase), SUMO1 (small ubiquitin-like modifier), TPK1 (thiamin pyrophosphokinase), and CALM1/2/3 (three genes encoding the protein calmodulin). The resulting maps recapitulate known protein features and confidently identify pathogenic variation. Assays potentially amenable to deep mutational scanning are already available for 57% of human disease genes, suggesting that DMS could ultimately map functional variation for all human disease genes.
Keywords: complementation; deep mutational scanning; genotype–phenotype; variants of uncertain significance.
© 2017 The Authors. Published under the terms of the CC BY 4.0 license.
Figures

Modular structure of the screening framework.
Raw DMS‐BarSeq fitness scores in technical replicates (separately plated assays of the same pool) and biological replicates (separate sub‐strains in the pool carrying the same variants).
Manual spotting assay validation of a representative set of variants. Each row represents a consecutive fivefold dilution. Marked in red: maximal dilution visible in empty vector control. Marked in green: maximal dilution with visible human wt control. Marked in yellow: dilution steps exceeding visible human wt control. Bar heights represent summary screen scores. Error bars show Bayesian regularized standard error based on three technical replicates and a prior based on pre‐selection counts and final score (see Materials and Methods for details).
Variants grouped by evolutionary conservation (AMAS score) of their respective sites (top) and grouped by structural context within the protein core, within protein–protein interaction interfaces or on remaining protein surface (bottom). Boxes range across the second and third quartiles with the middle bar representing the median. Whiskers show the most extreme values within 1.5×IQR. As normality cannot be assumed for the distributions of fitness scores, one‐sided two‐sample Wilcoxon–Mann–Whitney tests were used. Low conservation (n = 60 clones) vs. medium conservation (n = 105 clones) W = 3789, *P = 0.015; medium conservation (n = 105 clones) vs. high conservation (n = 404 clones) W = 28043, *P = 1.8 × 10⁻⁷; Core (n = 208 clones) vs. surface (n = 42 clones) W = 1649, *P = 1.01 × 10⁻¹⁰; interface (n = 215 clones) vs. surface (n = 42 clones) W = 2461, *P = 1.58 × 10⁻⁶.

Cross‐validation evaluation: Joint scores from DMS‐BarSeq and DMS‐TileSeq compared to machine‐learning prediction in 10× cross‐validation. The agreement is comparable to that between biological replicates in the screen itself (compare to Fig 1B).
Error map, showing cross‐validation results for each data point sorted by amino acid position and mutant residue.
Comparison of imputation predictions with individual spotting assays. Each row represents a consecutive fivefold dilution. Marked in red: maximal dilution visible in empty vector control. Marked in green: maximal dilution with visible human wt control. Marked in yellow: dilution steps exceeding visible human wt control.
Most informative features in the Random Forest imputation, as measured in % increase in mean squared deviation upon randomization of a given feature.

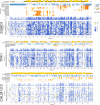
A complete functional map of UBE2I as resulting from the combination of the complementation screen and machine‐learning imputation and refinement. An impact score of 0 (blue) corresponds to a fitness equivalent to the empty vector control. A score of 1 (white) corresponds to a fitness equivalent to the wild‐type control. A score > 1 (red) corresponds to fitness above wild‐type levels. Shown above, for comparison are sequence conservation, secondary structure, solvent accessibility, and burial of the respective amino acid in protein–protein interaction interfaces with covalently and non‐covalently bound SUMO, the E1 UBA2, the sumoylation target RanGAP1, the E3 RanBP2 and UBE2I itself. Hydrogen bonds or salt bridges between residues and the respective interaction partner are marked with red asterisks. Residues buried in both the covalent SUMO and client interfaces are framed with dotted lines, marking the core members of the active site.
UBE2I crystal structure with residues colored according to the median mutant fitness. Colors as in (A). The interacting substrate's ΨKxE motif is shown in green stick model; Covalently bound SUMO is shown as a red cartoon model; and non‐covalently bound SUMO is shown in brown cartoon model. The structures shown were obtained by alignment of PDB entries 3UIP and 2PE6.
UBE2I crystal structure as in (B), with residues colored according to maximum mutant fitness.


Comparison of (refined) functional scores between rare polymorphisms (GnomAD) and somatic tumor mutations (COSMIC) in UBE2I and SUMO1. Bars show median and quartiles. As normality cannot be assumed for the distributions of fitness scores, a one‐sided two‐sample Wilcoxon–Mann–Whitney test was used: n = {26,31} variants, W = 570.5, P = 3.73 × 10⁻³.
Impact score distributions in calmodulin overlayed with previously observed alleles in CALM1, CALM2, and CALM3: Rare alleles from GnomAD are shown in green; ClinVar alleles classified as pathogenic are shown in red.
Precision‐recall curves for our DMS atlas, PROVEAN, and PolyPhen‐2 with respect to distinguishing Gnomad variants from pathogenic alleles from ClinVar.
References
-
- Baba D, Maita N, Jee J‐G, Uchimura Y, Saitoh H, Sugasawa K, Hanaoka F, Tochio H, Hiroaki H, Shirakawa M (2005) Crystal structure of thymine DNA glycosylase conjugated to SUMO‐1. Nature 435: 979–982 - PubMed
-
- Baker LJ, Dorocke JA, Harris RA, Timm DE (2001) The crystal structure of yeast thiamin pyrophosphokinase. Structure 9: 539–546 - PubMed
Publication types
MeSH terms
Substances
Grants and funding
LinkOut - more resources
Full Text Sources
Other Literature Sources
Miscellaneous

