. 2018 Feb 5;217(2):745-762.
doi: 10.1083/jcb.201709092. Epub 2017 Dec 21.

A Numb-Mdm2 fuzzy complex reveals an isoform-specific involvement of Numb in breast cancer

Affiliations

A Numb-Mdm2 fuzzy complex reveals an isoform-specific involvement of Numb in breast cancer

Ivan Nicola Colaluca et al. J Cell Biol. .

Abstract

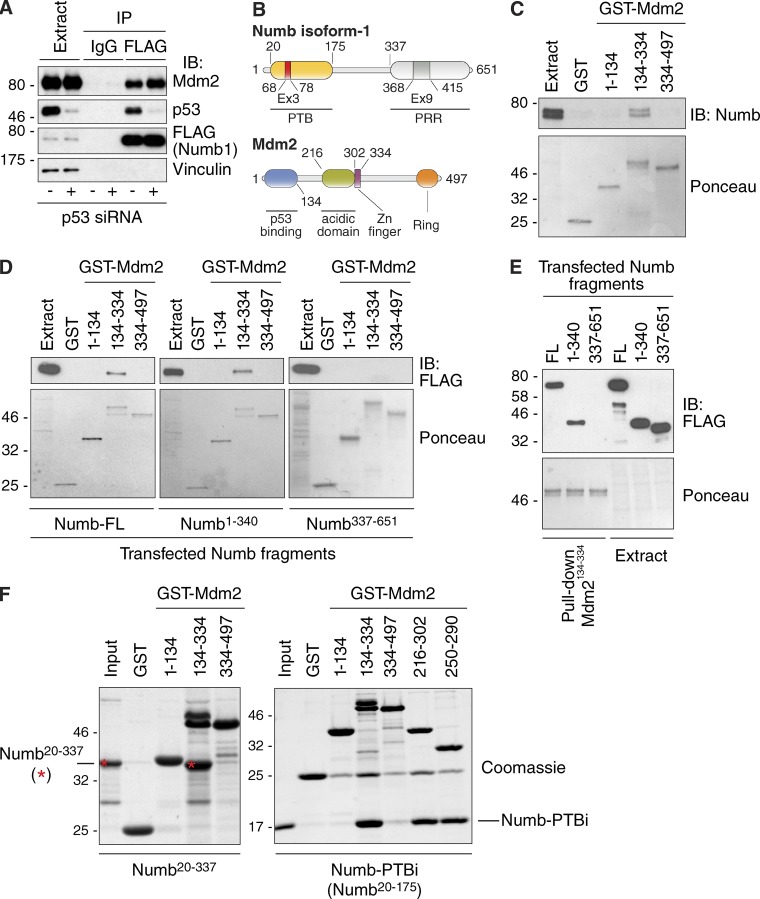
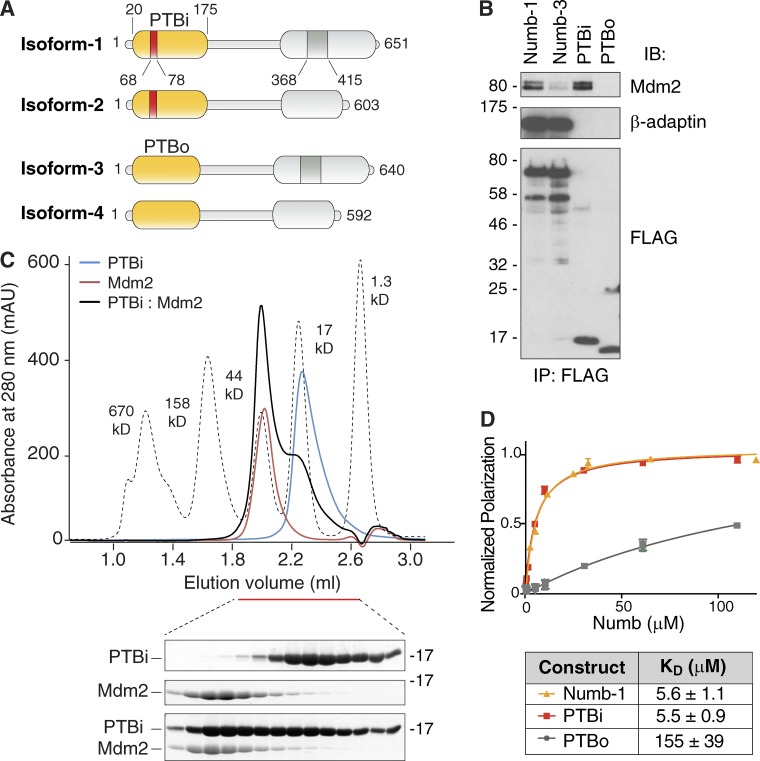
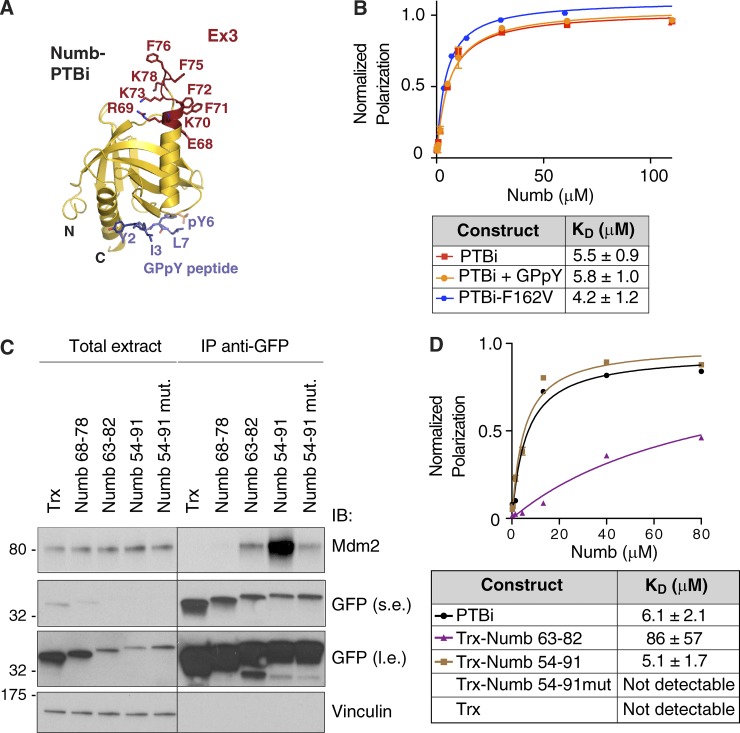
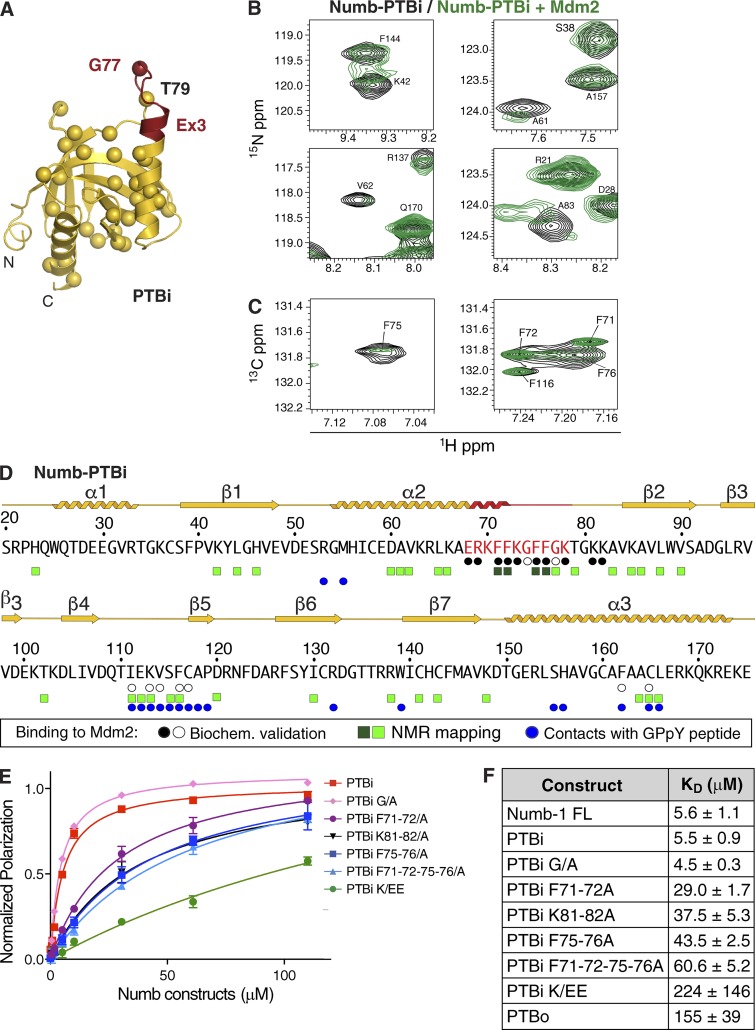
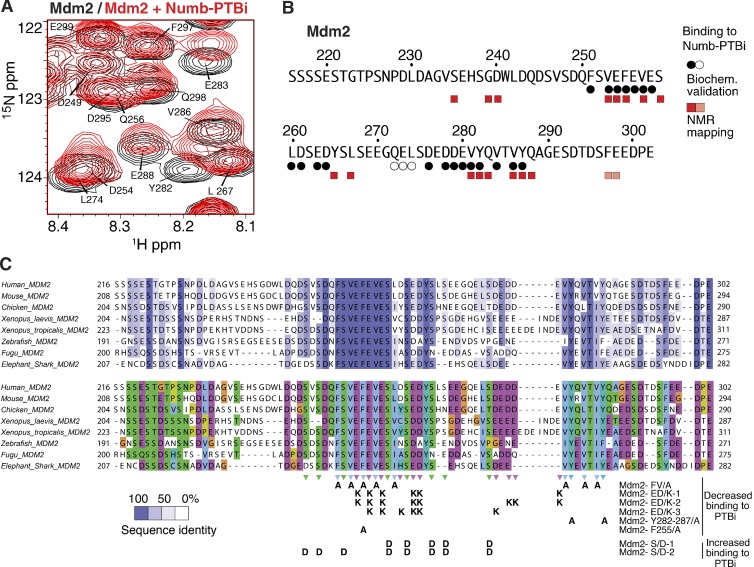
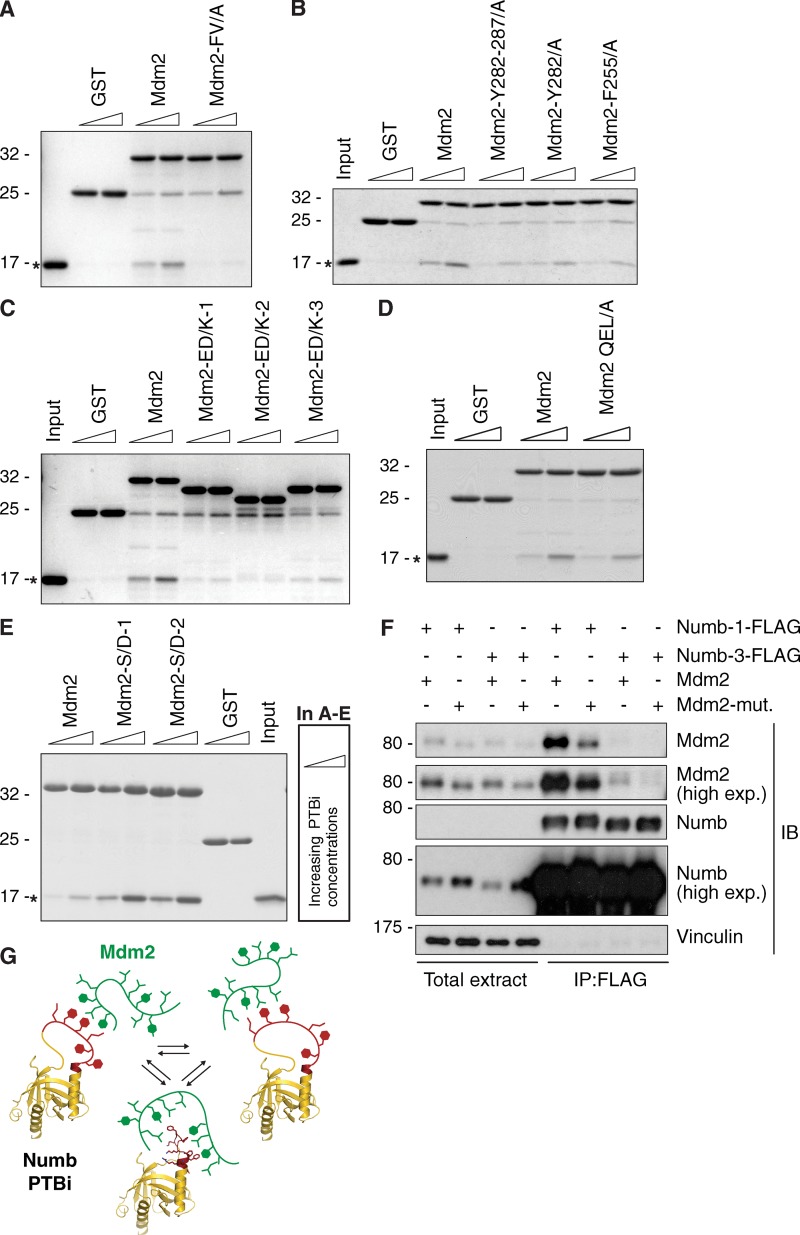
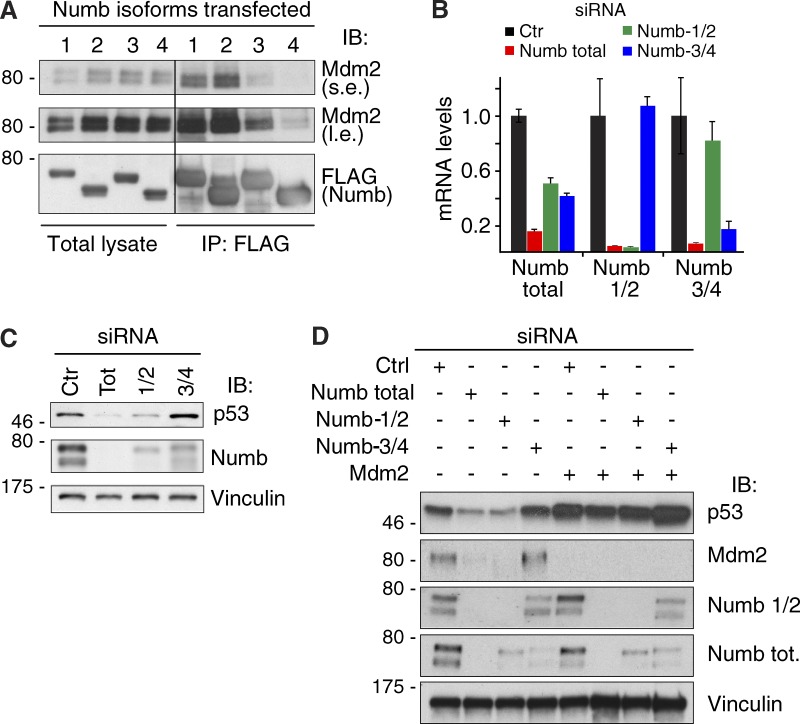
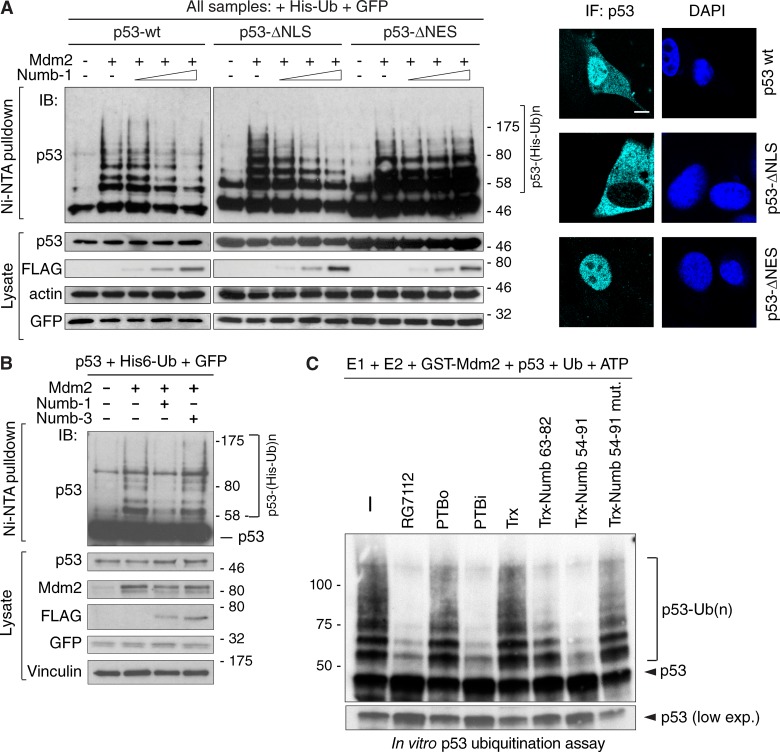
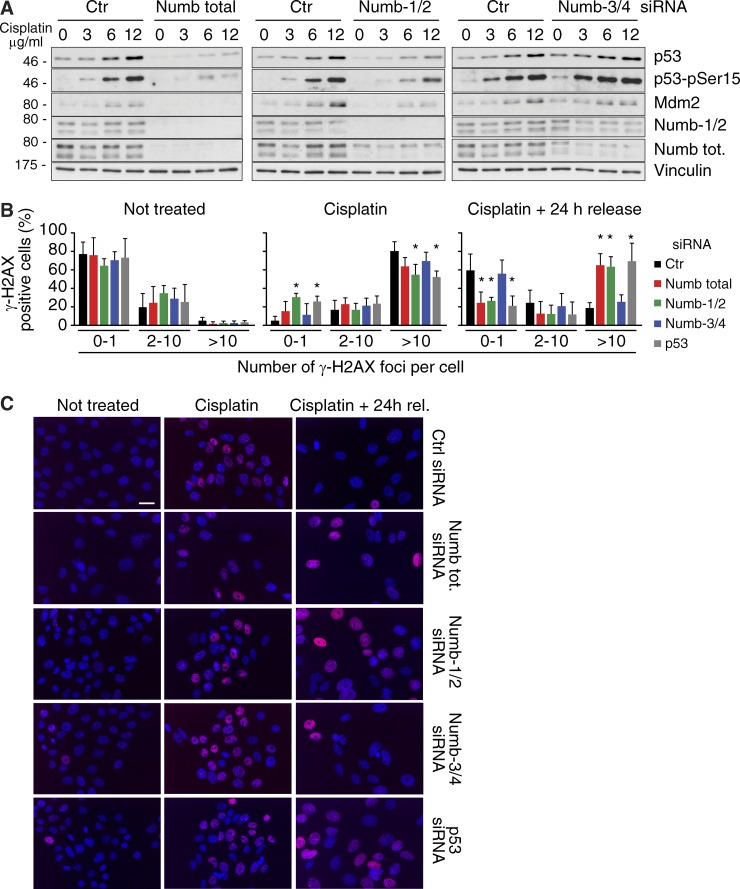
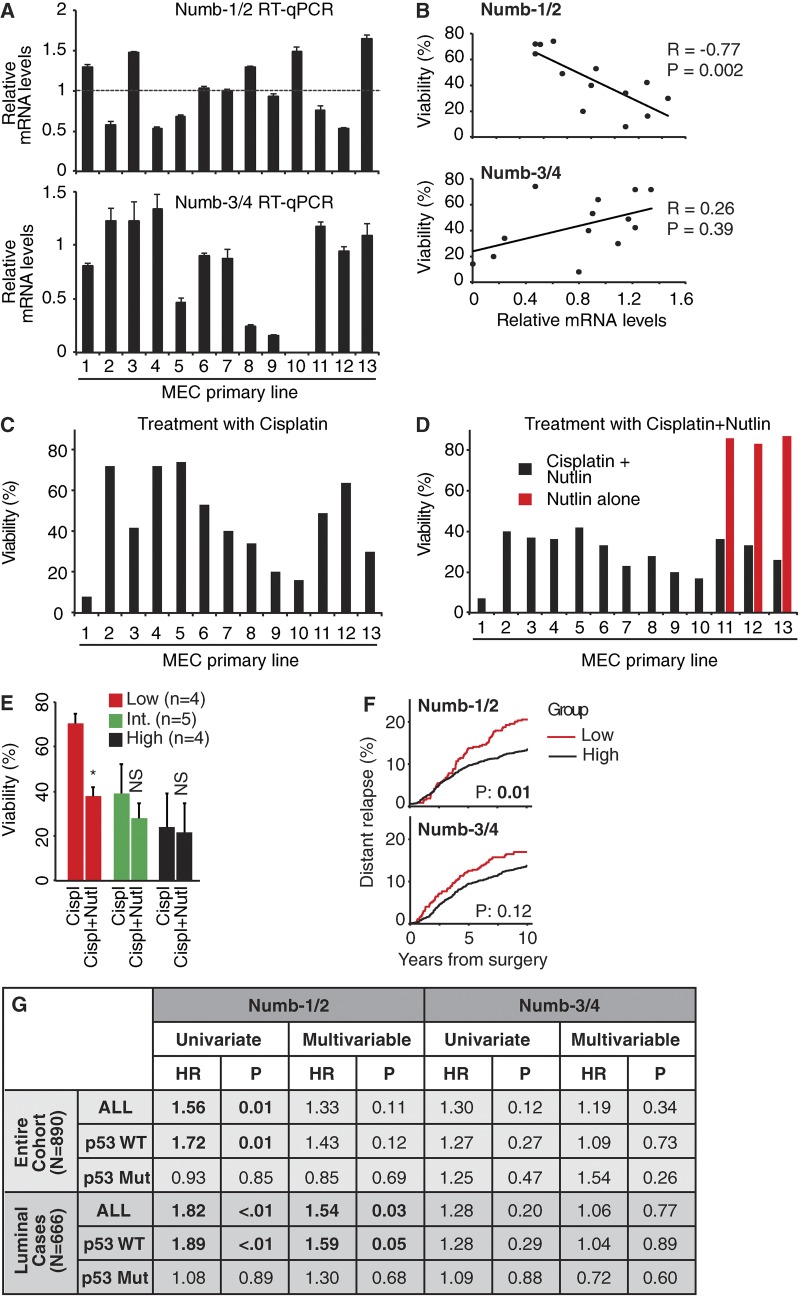
Numb functions as an oncosuppressor by inhibiting Notch signaling and stabilizing p53. This latter effect depends on the interaction of Numb with Mdm2, the E3 ligase that ubiquitinates p53 and commits it to degradation. In breast cancer (BC), loss of Numb results in a reduction of p53-mediated responses including sensitivity to genotoxic drugs and maintenance of homeostasis in the stem cell compartment. In this study, we show that the Numb-Mdm2 interaction represents a fuzzy complex mediated by a short Numb sequence encompassing its alternatively spliced exon 3 (Ex3), which is necessary and sufficient to inhibit Mdm2 and prevent p53 degradation. Alterations in the Numb splicing pattern are critical in BC as shown by increased chemoresistance of tumors displaying reduced levels of Ex3-containing isoforms, an effect that could be mechanistically linked to diminished p53 levels. A reduced level of Ex3-less Numb isoforms independently predicts poor outcome in BCs harboring wild-type p53. Thus, we have uncovered an important mechanism of chemoresistance and progression in p53-competent BCs.


Figures

Figure 1.
Figure 1.
The PTB domain of Numb interacts directly with the acidic domain of Mdm2. (A) HEK293 cells were transfected with siRNA oligonucleotides targeting p53 (+) or control oligonucleotides (−) and after 24 h were further transfected with the catalytically inactive Mdm2-C464A mutant (to avoid p53 degradation) and FLAG–Numb-1. Immunoprecipitates with anti-FLAG or irrelevant IgG were immunoblotted as shown. Extract was 0.01% of the IP. (B) Domain structure of human Numb isoform-1 (Numb-1) and Mdm2. The two regions (Ex3 and Ex9) deriving from differential splicing of exon 3 and 9 are both present in Numb-1. PRR, proline-rich region. (C) Pulldown of endogenous Numb (from 1 mg of MCF-10A lysate) with GST-Mdm2 fragments (0.5 µM). (Top) Numb IB; (bottom) Ponceau staining. Endogenous Numb is frequently resolved as a doublet (top band, Numb-1 and -3; bottom band, Numb-2 and -4). Extract was 0.025% of the IP. (D) The purified GST-Mdm2 fragments shown at the top (0.4 µM) were used to pull down the Numb fragments (from Numb-1; expressed as FLAG-tagged in HEK293 cells; 0.75 mg of lysate) shown at the bottom. Top, FLAG IB; bottom, Ponceau staining. Extract was 0.025% of the IP. (E) Comparative pulldown of Numb fragments as in D with purified GST-Mdm2134–334 (numbering according to UniProtKB/Swiss-Prot: Q00987). FL, full length. (F) The GST-Mdm2 fragments (1 µM) were used to pull down the purified Numb fragment 20–337 and Numb PTBi (bacterially expressed as His fusions; 5 µM). Detection was done by Coomassie staining. Asterisks mark Numb20–337. Molecular masses are given in kilodaltons.
Figure 2.
Figure 2.
The PTBi–Mdm2 interaction requires the Ex3-coded sequence. (A) Schematic representations of the four human Numb isoforms. (B) HEK293 cells were cotransfected with Mdm2 and the indicated FLAG-tagged Numb constructs. Anti-FLAG IPs were analyzed in IB as indicated. β-Adaptin was used as a positive control for binding to full-length Numb-1/3. (C) SEC elution profiles of the NumbPTBi–Mdm2216–302 complex and of individual subunits with corresponding Coomassie-stained SDS-PAGEs of the peak fractions. Species were injected in a Superdex-200 column at a 300-µM concentration. Mdm2216–302 in isolation eluted around the 44-kD molecular weight marker as the NumbPTBi–Mdm2216–302 complex because of its unstructured conformation (see also Fig. S3, A and B). Because of the highly dynamic nature of the interaction, the Numb–Mdm2 complex partially dissociated during the SEC run. Mdm2216–302 stained poorly, likely as a result of its acidic composition. (D) FP measurements of binding affinity between rhodamine-labeled Mdm2216–302 and Numb isoform-1 full-length, Numb-PTBi, and Numb-PTBo. The data (n = 3; means ± SD) were fitted to a curve as described in the Fluorescence polarization (FP) section of Materials and methods. Molecular masses are given in kilodaltons.
Figure 3.
Figure 3.
Characterization of the minimal region of Numb binding to Mdm2. (A) Ribbon model of Numb-PTBi in complex with the GPpY phosphopeptide. The PTBi Ex3 insert is displayed in red as balls and sticks, and the GPpY peptide is shown in blue. (B) FP measurements of binding affinity between rhodamine-labeled Mdm2216–302 and PTBi (reported for comparison; see also Fig. 2 D), PTBi in complex with GPpY (preassembled at a PTBi concentration of 200 µM with a 1.5-molar excess of peptide), and PTBi harboring the F162V mutation. As shown, the binding to Mdm2216–302 was not affected by the presence of GPpY or by the F162V mutation that impairs the binding of PTBi to the GPpY peptide. n = 4. (C) The thioredoxin (Trx)-based constructs (see Fig. 4 D for the amino acid sequence) harboring the fragments of the PTBi indicated at the top (all engineered as GFP fusion proteins; Trx, empty thioredoxin scaffold), were transfected in HEK293 cells together with Mdm2. Anti-GFP IPs were immunoblotted as indicated. The Numb 54–91 mutant construct harbored four mutations, in which R69, K70, K73, and K78 were replaced with glutamic acid. Total extract was 0.005% of the IP. The black line indicates that intervening lanes were spliced out. Molecular masses are given in kilodaltons. l.e., long exposure; s.e., short exposure. (D) FP measurements of binding affinity between rhodamine-labeled Mdm2216–302 and Numb-PTBi or the indicated thioredoxin-Numb fusion proteins (bacterially expressed as His fusions). The data (n = 3; means ± SD) were fitted to a curve as described in the Fluorescence polarization (FP) section of Materials and methods.
Figure 4.
Figure 4.
Characterization of the PTBi–Mdm2 interface on the PTBi side. (A) Cartoon representation of the crystal structure of PTBi colored as in Fig. 3 A. Amides of residues experiencing chemical shift changes upon Mdm2 binding are displayed as spheres colored in red for strongly affected residues in and near the Ex3 insert. (B and C) Selected NMR signals are shown from [1H][15N]HSQC spectra of [15N] uniformly labeled PTBi (B) or for [1H][13C]HSQC spectra recorded with Phe-SAIL–labeled PTBi (C), free (black) and in the presence of 1.1–1.2 equivalents of Mdm2216–302 (green). See also Fig. S3, C and D. (D) Summary of NMR spectral changes in PTBi (CSP or line broadening) upon Mdm2 binding. Residues that show either CSPs or intensity reductions are depicted for >0.15 ppm or >1 SD of mean intensity (light green squares) or >0.3 ppm or >2 SD of mean intensity (dark green squares). Residues whose replacement abrogates or does not affect binding to Mdm2216–302 (by FP or GST pulldown experiments) are labeled with black and white circles, respectively. Residues of the PTBi contacting the GPpY peptide in the crystallographic structures are marked with blue circles. The secondary structure of the PTBi as defined by crystallographic structures and NMR data are indicated above the sequence with the same color code as in A. (E) FP measurements of the binding affinity between rhodamine-labeled Mdm2216–302 and Numb-PTBi WT (PTBi) or mutated as indicated (the PTBi curve is from the same experiment described in Fig. 2 D). The data (n = 6; means ± SD) were fitted to a curve as described in the Fluorescence polarization (FP) section of Materials and methods. (F) Summary of FP experiments (see E and Fig. 2 D) to measure the binding affinities between rhodamine-labeled Mdm2216–302 and the indicated Numb species (means ± SD). FL, full length; PTBi-G/A, G74A-G77A substitutions; PTBi-K/EE, R69E-K70E-K73E-K78E substitutions.
Figure 5.
Figure 5.
Characterization of the PTBi–Mdm2 interface on the Mdm2 side. (A) Region of [1H][15N]HSQC NMR spectra of [15N]-labeled Mdm2216–302 free (black) or in the presence of 1.1 equivalents of PTBi (red). (B) Summary of the NMR spectral changes upon binding of PTBi to Mdm2216–302. Residues which have a corresponding peak shift in the presence of Numb-PTBi are denoted with boxes with pink indicating 0.1–0.2 ppm and red indicating >0.2 ppm (see also Fig. S3 G). Results of the biochemical validation of Mdm2 residues at the interface with Numb-PTBi are shown in circles with the same color code as in Fig. 4 D (see also C and Fig. 6, A–F). (C) Summary of effects on binding to PTBi for all Mdm2 mutants tested. The mutants are shown aligned to a phylogenetic comparison among eight orthologues to evidence residue conservation and chemical nature of the residues. Top: Mdm2 residues are colored according to their conservation, which was calculated based on the alignment of eight orthologues from Homo sapiens, Mus musculus, Gallus gallus, Xenopus laevis, Xenopus tropicalis, Danio rerio (Zebrafish), Takifugu rubripes (Fugu), and Callorhinchus milii (Elephant shark). (Middle: same alignment as above, with colors reflecting the chemical nature of the side chains. Hydrophobic side chains are in blue, negatively charged are in purple, and Ser/Thr/Gln are in green. (Bottom: summary of the Mdm2 mutants used in binding assays of Fig. 6 (A–E) to characterize the Mdm2–Numb-PTBi interface.
Figure 6.
Figure 6.
Biochemical validation of the Mdm2 determinants required for binding to Numb-PTBi. (A–E) Pulldown experiments with the GST proteins indicated on top (1 µM; Mdm2 mutants are graphically shown in Fig. 5 C; in Mdm2 QEL/A, the stretch 272–274 is mutated into three Ala) incubated with increasing concentrations (indicated by triangles, 2 and 4 µM, except for E, in which 1 and 2 µM were used) of PTBi (bacterially expressed and cleaved from the His moiety). Detection was by Coomassie staining. The position of the PTBi is indicated by asterisks. The other bands correspond with the GST fusion proteins. In A–D, Mdm2 mutants were engineered in the Mdm2250–290 background. In E, Mdm2 mutants were engineered in the Mdm2216–302 background so that mutagenesis of Ser246–248 could also be included. In C, the different migration of the Mdm2 mutants was probably caused by the alterations of the charges introduced by mutagenesis. (F) HEK293 cells were transfected with the Mdm2 constructs and FLAG-tagged Numb isoform-1 or -3 as shown on top. Mdm2-mut represents the F255A-Y282A-Y287A mutant carrying mutations in the Tyr and Phe residues important for direct interaction between the acidic domain and the PTBi (see also Fig. S3 G). Lysates were immunoprecipitated with anti-FLAG antibodies and immunoblotted as indicated. As shown, the Mdm2 mutant could not be efficiently coimmunoprecipitated with the PTBi-containing Numb-1. Numb-3 was used as a negative control for the specificity of the observed interactions. Total extract was 0.002% of the IP. Molecular masses are given in kilodaltons. (G) Schematic representation indicating that the PTBi–Mdm2 interaction interface represents a fuzzy complex, where two intrinsically disordered regions in both binding partners interact and retain dynamic and intrinsic disorder in the complex. Multiple negatively charged and hydrophobic motifs of Mdm2216–302 (green) engage the PTBi insert by charge complementarity with Lys residues and stacking interactions with phenylalanines (red).
Figure 7.
Figure 7.
Role of Numb isoforms in the regulation of p53 levels. (A) HEK293 cells were transfected with the indicated FLAG-tagged Numb isoforms and Mdm2. IP (anti-FLAG) and IB were as shown. Total lysate was 0.005% of the IP. The black line indicates that intervening lanes were spliced out. (B and C) MCF-10A cells were silenced with siRNA specific for total Numb, Numb-1/2, or Numb-3/4 and then were analyzed by RT-qPCR (B) or IB (C). For RT-qPCR, each target was analyzed in triplicate, and the means ± SD are shown. (D) MCF-10A cells were silenced as indicated on the top and IB as shown on the right. Numb-1/2 is an antibody against amino acids 66–80 of human Numb isoform-1, which recognizes Numb-1 and Numb-2. Of note, Mdm2 levels are also reduced upon total Numb and Numb-1/2 silencing, making Mdm2 a transcriptional target of p53 in a negative feedback loop (Barak et al., 1993; Haupt et al., 1997; Kubbutat et al., 1997; Wu and Levine, 1997). Molecular masses are given in kilodaltons.
Figure 8.
Figure 8.
Role of Numb isoforms in the regulation of Mdm2 activity. (A) Numb inhibits Mdm2-dependent ubiquitination of p53 in the cytoplasm. Mdm2 and p53 shuttle between the nucleus and the cytoplasm (Roth et al., 1998; Tao and Levine, 1999), whereas the bulk of Numb is cytosolic (Santolini et al., 2000). However, p53 ubiquitination/degradation occurs both at the cytoplasmic and at the nuclear level (Joseph et al., 2003). We therefore overexpressed in H1299 cells two p53 variants with subcellular localizations restricted to the cytoplasm (p53-ΔNLS) or to the nucleus (p53-ΔNES). The p53-ΔNLS construct carries a nonfunctional p53 nuclear localization signal (with mutations of Lys305, Arg306, Lys319, Lys320, and Lys321 to Ala), and the p53-ΔNES construct carries a nonfunctional p53 nuclear export signal (with mutations of Met340, Leu344, Leu348, and Leu350 to Ala). Cells were also cotransfected with Mdm2 and Numb-1 to test the ability of the latter to inhibit in vivo the Mdm2-mediated ubiquitination of p53-WT or of its mutants. The ubiquitination pattern of the different p53 variants revealed that Numb-1 affects p53 ubiquitination only in the cytoplasm, whereas p53 ubiquitination at the nuclear level was unperturbed. Left: Mdm2-mediated p53 in vivo ubiquitination in H1299 cells transfected with the indicated plasmids and increasing concentrations of FLAG-tagged Numb isoform-1 (see also the Biochemical studies section of Materials and methods). GFP was transfected as an internal normalizer for efficiency of transfection. Lysates were subjected to IB as indicated. Right: the cellular localization of the p53 mutants was monitored by IF with anti-p53. Nuclei were counterstained with DAPI. Bar, 10 µM. (B) Mdm2-mediated p53 in vivo ubiquitination in H1299 cells transfected as indicated on the top (see also the Biochemical studies section of Materials and methods). GFP was transfected as an internal normalizer for efficiency of transfection. Lysates were immunoblotted as indicated. (C) p53 in vitro ubiquitination assay with the components and the Numb species indicated on top fused to a thioredoxin scaffold (Trx; see also the Biochemical studies section of Materials and methods). RG7112 is a small molecule belonging to the Nutlin family of Mdm2 inhibitors (designed to occupy the p53-binding pocket of Mdm2) used as control. Molecular masses are given in kilodaltons.
Figure 9.
Figure 9.
Role of Numb isoforms in regulating the p53 response to genotoxic stress. (A) MCF-10A cells silenced for the indicated Numb isoforms were treated with increasing doses of cisplatin for 16 h and IB as indicated. p53-pSer15 represents the form of p53 activated by phosphorylation of Ser15, detected with a specific antibody. Molecular masses are given in kilodaltons. (B) MCF-10A cells silenced as shown on the right were left untreated (left) or treated with 12 µg/ml cisplatin for 15 h (middle) and then released in fresh medium for 24 h (right). IF with antiphosphorylated γ-H2AX was performed. The γ-H2AX foci per cell were counted in at least five random fields for each condition (from two independent experiments). In each field, the percentage of the cells with 0–1, 2–10, and >10 foci per nucleus was evaluated, and the mean of these percentages for each condition was reported in graph with its SD. *, P ≤ 0.01 compared with control in each group. (C) Representative panels of the MCF-10A cells used in B (and silenced as shown on the right) stained with antiphosphorylated γ-H2AX (red) and with DAPI (blue). Bar, 50 µM.
Figure 10.
Figure 10.
Numb isoforms in response to genotoxic stress and prognosis of BCs. (A) RT-qPCR analysis of the mRNA expression of Numb isoforms in tumor primary breast mammary epithelial cells (MECs) derived from 13 patients. Data are from a single experiment run in triplicate and expressed as mean ± SD relative to mRNA levels in MCF-10A cells (=1). (B–E) Survival of primary BC cells treated with cisplatin (18 µg/ml for 9 h) or cisplatin + Nutlin-3 (10 µM) followed by release in fresh medium for 72 h. Data are from a single experiment. In B, the viability of the cells after cisplatin treatment (plus release in fresh medium) is indicated as a function of the mRNA levels of Numb isoforms-1/2 or -3/4 shown in A (normalized to MCF-10A levels). R is the Pearson correlation coefficient calculated for the linear relationship in each graph with the relative p-value (P; two-tailed Student’s t test). The viability of the cells after cisplatin alone (C) or cisplatin + Nutlin-3 (plus release in fresh medium; D) is shown. As control to evaluate the effect of Nutlin-3 on cell viability, BC cells from three patients were also treated with Nutlin-3 alone (D, red bars). In E, data from C and D are shown as a bar graph (means ± SD) combining primary cells displaying high, intermediate (Int.), or low levels of Numb (defined as tertiles of expression). *, P < 0.01 compared with cisplatin alone in each group. (F) Cumulative incidence of distant metastasis in 890 BC patients clustered in quintiles according to the mRNA level of the indicated Numb species. Red, low Numb isoforms (lowest quintile; lowest 20%; n = 178); black, high Numb isoforms (other four quintiles combined; highest 80%; n = 712). P-values from a univariate Cox proportional hazard ratio are shown. See also the RNA purification and quantitative real-time PCR analysis and the Selection of breast cancer patients and statistical analysis sections of Materials and methods for details. (G) Hazard ratio (HR) of distant metastasis (with corresponding p-values) of low versus high Numb (defined as in F) in the entire case cohort (n = 890) or in the luminal subtype of BC (n = 666), further stratified for p53 mutational status (see also Fig. S4, E and F). Univariate and multivariable analyses are shown with corresponding p-values (see the Selection of breast cancer patients and statistical analysis section of Materials and methods). In the entire case cohort (n = 890), multivariable analyses were adjusted for grade, Ki-67, tumor size, number of positive lymph nodes, age at surgery, ERBB2 status, and estrogen/progesterone receptor status, whereas in the luminal subtype of BC (n = 666), multivariable analyses were adjusted for grade, Ki-67, tumor size, number of positive lymph nodes, and age at surgery.

Comment in

  • Rewired Notch/p53 by Numb'ing Mdm2.
    Kim H, Ronai ZA. Kim H, et al. J Cell Biol. 2018 Feb 5;217(2):445-446. doi: 10.1083/jcb.201712007. Epub 2018 Jan 16. J Cell Biol. 2018. PMID: 29339436 Free PMC article.

References

    1. Adams, P.D., Afonine P.V., Bunkóczi G., Chen V.B., Davis I.W., Echols N., Headd J.J., Hung L.-W., Kapral G.J., Grosse-Kunstleve R.W., et al. . 2010. PHENIX: a comprehensive Python-based system for macromolecular structure solution. Acta Crystallogr. D Biol. Crystallogr. 66:213–221. 10.1107/S0907444909052925 - DOI - PMC - PubMed
    1. Bani-Yaghoub, M., Kubu C.J., Cowling R., Rochira J., Nikopoulos G.N., Bellum S., and Verdi J.M.. 2007. A switch in numb isoforms is a critical step in cortical development. Dev. Dyn. 236:696–705. 10.1002/dvdy.21072 - DOI - PubMed
    1. Barak, Y., Juven T., Haffner R., and Oren M.. 1993. mdm2 expression is induced by wild type p53 activity. EMBO J. 12:461–468. - PMC - PubMed
    1. Barlow, W.E. 1994. Robust variance estimation for the case-cohort design. Biometrics. 50:1064–1072. 10.2307/2533444 - DOI - PubMed
    1. Bechara, E.G., Sebestyén E., Bernardis I., Eyras E., and Valcárcel J.. 2013. RBM5, 6, and 10 differentially regulate NUMB alternative splicing to control cancer cell proliferation. Mol. Cell. 52:720–733. 10.1016/j.molcel.2013.11.010 - DOI - PubMed

Publication types

MeSH terms