. 2017 Dec 22;358(6370):eaao5610.
doi: 10.1126/science.aao5610.

Recurrent infection progressively disables host protection against intestinal inflammation

Affiliations

Recurrent infection progressively disables host protection against intestinal inflammation

Won Ho Yang et al. Science. .

Abstract

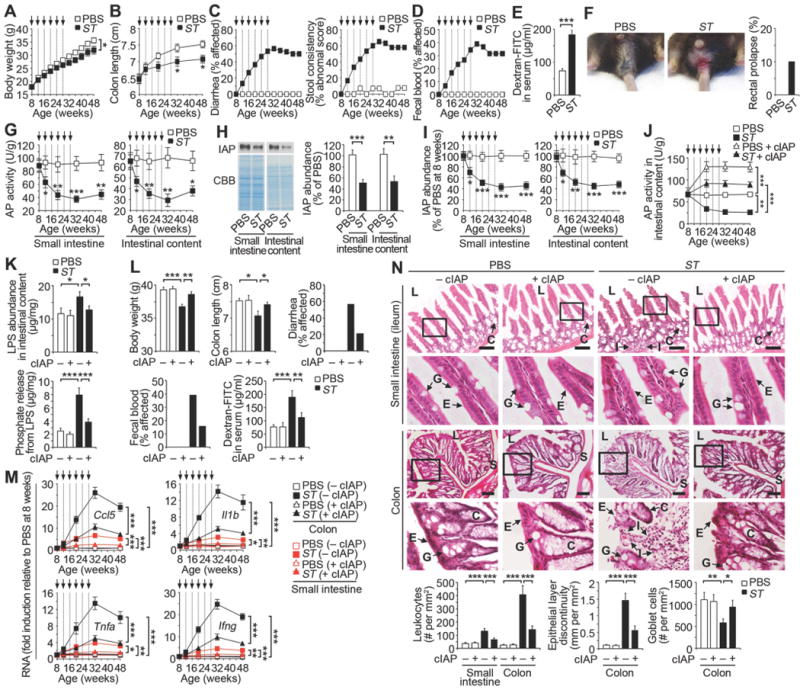
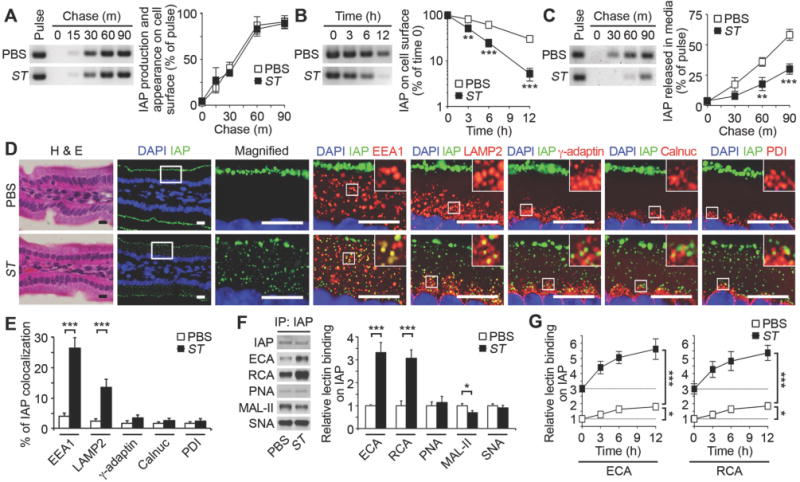
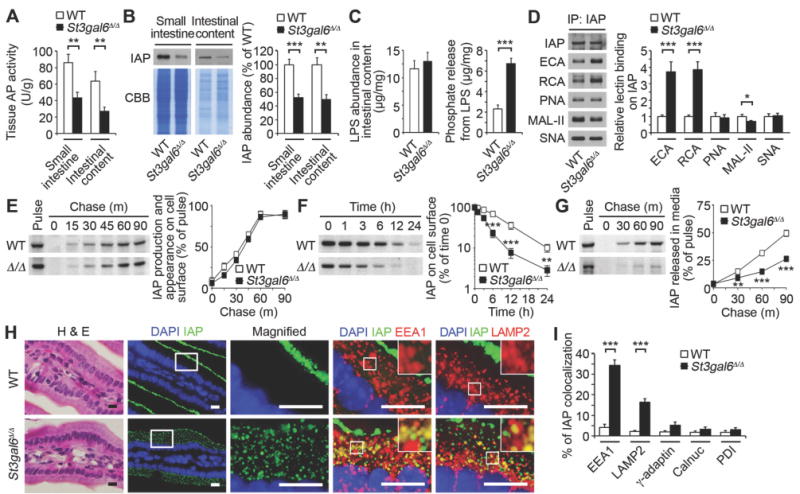
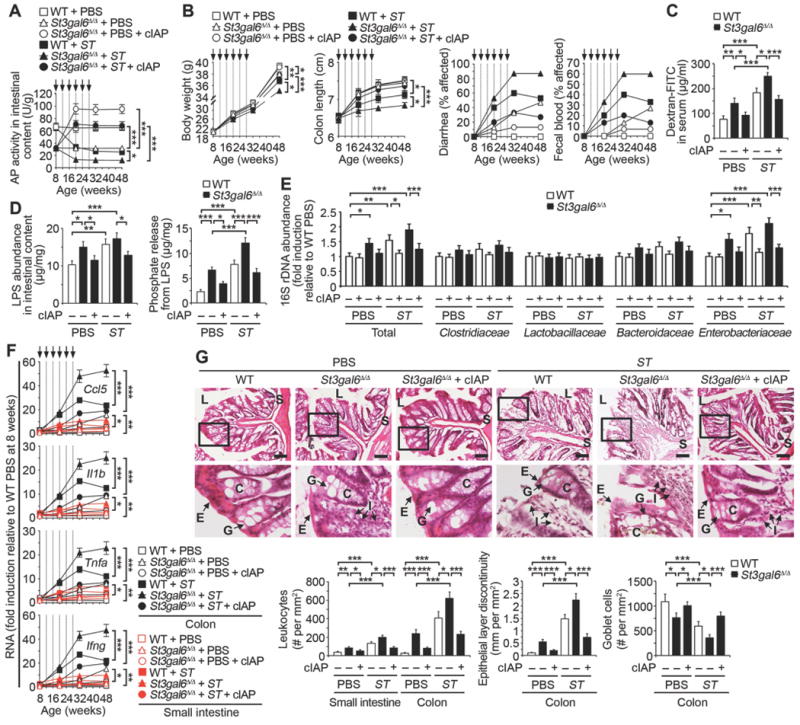
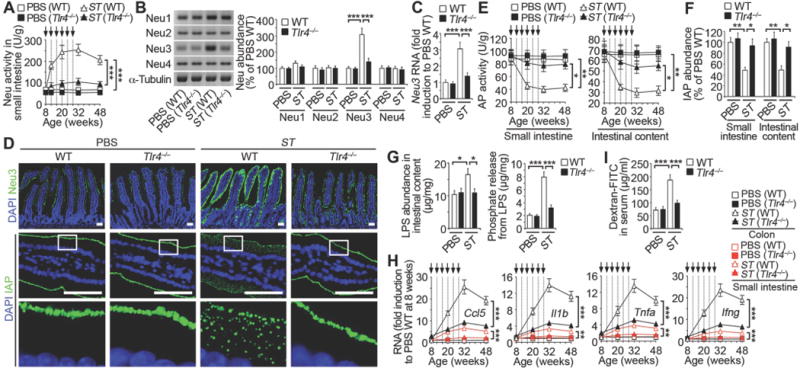
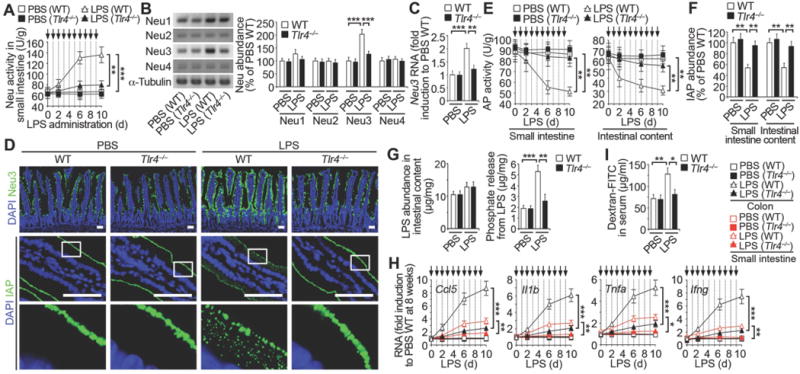
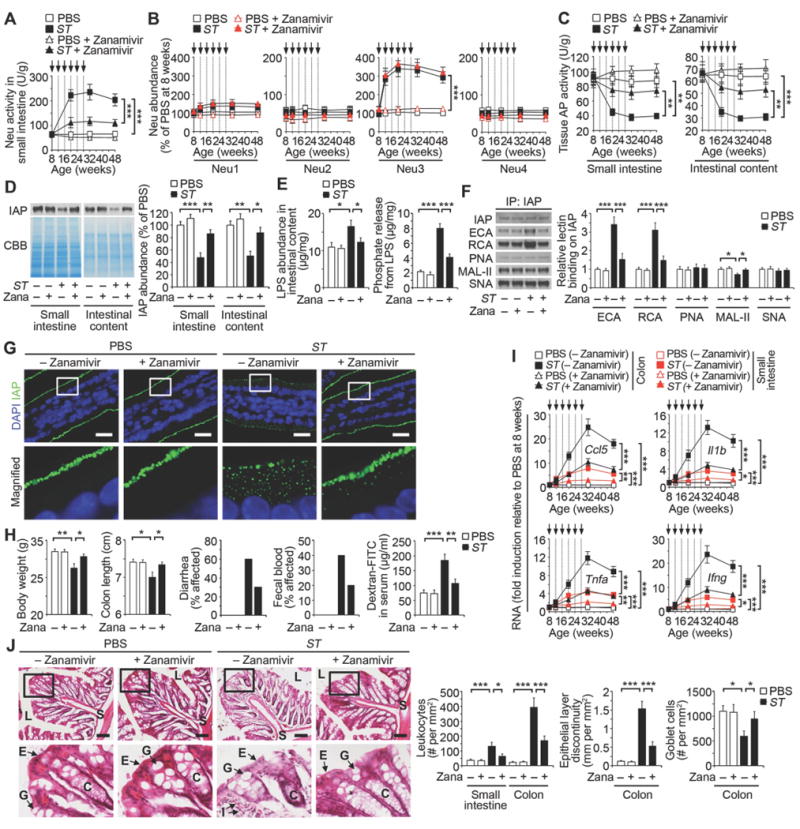
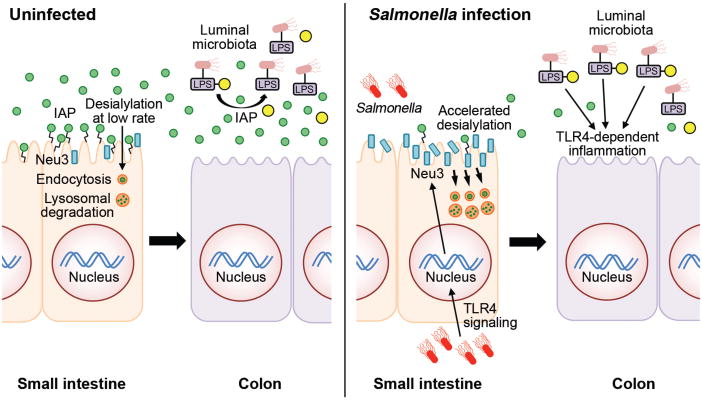
Intestinal inflammation is the central pathological feature of colitis and the inflammatory bowel diseases. These syndromes arise from unidentified environmental factors. We found that recurrent nonlethal gastric infections of Gram-negative Salmonella enterica Typhimurium (ST), a major source of human food poisoning, caused inflammation of murine intestinal tissue, predominantly the colon, which persisted after pathogen clearance and irreversibly escalated in severity with repeated infections. ST progressively disabled a host mechanism of protection by inducing endogenous neuraminidase activity, which accelerated the molecular aging and clearance of intestinal alkaline phosphatase (IAP). Disease was linked to a Toll-like receptor 4 (TLR4)-dependent mechanism of IAP desialylation with accumulation of the IAP substrate and TLR4 ligand, lipopolysaccharide-phosphate. The administration of IAP or the antiviral neuraminidase inhibitor zanamivir was therapeutic by maintaining IAP abundance and function.


Figures

Fig. 1
Fig. 1. Recurrent ST infection diminishes the abundance and protective role of IAP
Wild-type mice were analyzed during a course of recurrent ST infection (2 × 10³ cfu) or uninfected (PBS) at indicated time points (arrows). (A) Body weight (ST, n = 20; PBS, n = 19). (B) Colon length (n = 40 per condition). (C) Diarrhea and stool consistency (ST, n = 19; PBS, n = 13). (D) Fecal blood (ST, n = 19; PBS, n = 13). (E) Intestinal epithelial barrier function (n = 8 per condition) at 20 weeks of age prior to the fourth infection. (F) Rectal prolapse (ST, n = 30; PBS, n = 20) at 32–48 weeks of age, or 4–20 weeks following last ST infection (representative image). (G) AP activity (n = 40 per condition). (H) Immunoblot blot analysis of IAP at 20 weeks of age prior to the fourth infection (n = 8 per condition). (I) Relative IAP abundance (n = 40 per condition). (J) AP activity +/− calf IAP (cIAP) (n = 40 per condition). (K) LPS abundance and phosphate released from LPS (n = 8 per condition) at 20 weeks of age. (L) Body weight (n = 10 per condition), colon length (n = 8 per condition), diarrhea (ST, n = 23; PBS, n = 14; ST + cIAP, n = 19; PBS + cIAP, n = 15), fecal blood (ST, n = 23; PBS, n = 14; ST + cIAP, n = 19; PBS + cIAP, n = 15) at 48 weeks of age (20 weeks following last ST infection), and intestinal epithelial barrier function (n = 8 per condition) at 20 weeks of age prior to the fourth infection. (M) Cytokine mRNA expression (n = 30 per condition). (N) H & E-stained intestinal tissues at 48 weeks of age (20 weeks following last ST infection). L, intestinal lumen; E, epithelial layer; C, crypt; G, goblet cell; S, submucosa; I, infiltration of leukocytes. Graphs are representative of 16 fields of view (4 mice per condition). All scale bars: 100 µm. Error bars, means ± SEM. ***P < 0.001; **P < 0.01; *P < 0.05; Student’s t test (A), (B), (E), (G), (H), and (I) or one-way ANOVA with Tukey’s multiple comparisons test (J) to (N).
Fig. 2
Fig. 2. Mechanism of IAP regulation during recurrent ST infection
(AC) Pulse–chase analyses of IAP synthesis, trafficking and cell-surface half-life among cultured primary enterocytes isolated from wild-type mice at 20 weeks of age (prior to fourth ST infection). (D and E) In situ localization and intracellular co-localization of IAP in duodenum sections stained with H & E or with fluorescent antibodies to IAP (green) and intracellular compartment proteins (red) including early endosomes (EEA1), lysosomes (LAMP2), trans-Golgi (γ-adaptin), cis-Golgi (Calnuc), or the endoplasmic reticulum (PDI), depicting the percentage of IAP co-localization (yellow). Graphs are representative of ten fields of view (four mice per condition). Scale bars: 10 µm. (F) Lectin blot of IAP from small intestine. (G) Lectin binding of IAP on cultured enterocytes following cell-surface biotinylation. (AG) Wild-type mice at 20 weeks of age prior to fourth infection. (AC and G) n = 6 per condition. (F) n = 8 per condition. Error bars, means ± SEM. ***P < 0.001; **P < 0.01; *P < 0.05; Student’s t test (A), (B), (C), (E), and (F) or one-way ANOVA with Tukey’s multiple comparisons test (G).
Fig. 3
Fig. 3. Mechanism of IAP regulation by ST3Gal6 sialylation
(A) AP activity. (B) IAP protein abundance. (C) LPS abundance and phosphate released from LPS of intestinal content. (D) Lectin blot of IAP from small intestine. (E–G) Pulse–chase of IAP synthesis and trafficking and IAP cell-surface half-life among cultured primary enterocytes isolated from uninfected ST3Gal6-deficient mice and wild-type littermates at 8–10 weeks of age. (H and I) In situ localization and intracellular co-localization of IAP in duodenum, depicting the percentage of IAP co-localization (yellow). Graphs are representative of ten fields of view (4 mice per genotype). Scale bars, 10 µm. (AI) ST3Gal6-deficient mice and wild-type littermates at 8–10 weeks of age, uninfected. (AD) n = 8 per condition. (EG) n = 6 per condition. Error bars, means ± SEM. ***P < 0.001; **P < 0.01; *P < 0.05; Student’s t test (A) to (G) and (I).
Fig. 4
Fig. 4. ST3Gal6 sialylation of IAP in preventing intestinal inflammation
Indicated genotypes following ST re-infection (arrows) were analyzed in absence or presence of cIAP. (A) AP activity (n = 32 per condition). (B) Body weight (n = 10 per condition), colon length (n = 32 per condition), diarrhea (n = 30 per condition), and fecal blood (n = 30 per condition). (C) Intestinal epithelial barrier function. (D) LPS abundance and phosphate released from LPS of intestinal content. (E) Commensal microbiome 16S rDNA in intestinal content (n = 10 per condition). (F) Inflammatory cytokine RNA in colon and small intestine (n = 24 per condition). (G) H & E-stained colon sections. Graphs are representative of ten fields of view (four mice per condition). Scale bars: 100 µm. (C and D) Data were acquired from mice 20 weeks of age prior to fourth infection. (EG) Data were acquired from mice 32 weeks of age and 4 weeks following the last infection. (C and D) n = 8 per condition. Error bars, means ± SEM. ***P < 0.001; **P < 0.01; *P < 0.05; one-way ANOVA with Tukey’s multiple comparisons test (A) to (G).
Fig. 5
Fig. 5. Host neuraminidase induction by Tlr4 during recurrent ST infection
Wild-type and Tlr4-deficient mice were analyzed following ST re-infection or LPS administration (arrows). (A) Neuraminidase (Neu) activity (n = 30 per condition). (B) Neu1, 2, 3 and 4 protein abundance in small intestine. (C) Neu3 mRNA expression in small intestine. (D) In situ localization of Neu3 and IAP in duodenum. Images are representative of ten fields of view (4 mice per condition). Scale bars: 50 µm. (E) AP activity (n = 24 per condition). (F) IAP protein abundance. (G) LPS abundance and phosphate released from LPS of intestinal content. (H) Inflammatory cytokine RNA abundance (n = 16 per condition). (I) Intestinal epithelial barrier function. (B, C, F, G, and I) n = 6 per condition. (B, C, F, G, and I) Animals were 20 weeks of age and prior to the fourth infection. Error bars, means ± SEM. ***P < 0.001; **P < 0.01; *P < 0.05; one-way ANOVA with Tukey’s multiple comparisons test (A) to (I).
Fig. 6
Fig. 6. Host neuraminidase induction by Tlr4 and LPS
(A) Neu activity in mice at 8 weeks of age prior to repeated LPS administrations (arrows). (B and C) Neu protein abundance and Neu3 RNA expression in small intestine. (D) In situ localization of Neu3 and IAP in duodenum sections, representative of ten fields of view (four mice per condition). Scale bars: 50 µm. (E) AP activity prior to repeated LPS administrations (arrows). (F) IAP protein abundance. (G–I) Phosphate released from LPS of intestinal content, inflammatory cytokine RNA abundance and intestinal epithelial barrier function. (A and E) n = 24 per condition. (B, C, F, G, and I) n = 6 per condition. (H) n = 16 per condition. (B, C, F, G, and I) Mice on day 6 following LPS administration. Error bars, means ± SEM. ***P < 0.001; **P < 0.01; *P < 0.05; one-way ANOVA with Tukey’s multiple comparisons test (A) to (I).
Fig. 7
Fig. 7. Effects of neuraminidase inhibitor Zanamivir on intestinal inflammation
Wild-type mice were analyzed at indicated ages prior to ST re-infection (arrows) in absence or presence of Zanamivir (Zana) (0.5 mg/ml) provided in drinking water immediately after first infection. (A) Neu activity. (B) Neu1, 2, 3 and 4 protein abundance in small intestine. (C) AP activity. (D) IAP protein abundance. (E) LPS abundance and phosphate released from LPS of intestinal content. (F) Lectin blotting of IAP protein from small intestine. (G) In situ localization of IAP in duodenum, representative of ten fields of view (four mice per condition). Scale bars, 20 µm. (H) Body weight (n = 10 per condition), colon length (n = 8 per condition), diarrhea (n = 10 per condition) and fecal blood (n = 10 per condition) at 32 weeks of age and intestinal epithelial barrier function (n = 8 per condition) at 20 weeks of age. (I) Inflammatory cytokine RNA abundance. (J) H & E-stained colon sections at 32 weeks of age. Graphs are representative of ten fields of view (four mice per condition). Scale bars: 100 µm. (D–G) Mice at 20 weeks of age. (A and C) n = 32 per condition. (B and I) n = 30 per condition. (DF) n = 6 per condition. Error bars, means ± SEM. ***P < 0.001; **P < 0.01; *P < 0.05; one-way ANOVA with Tukey’s multiple comparisons test (A) to (J).
Fig. 8
Fig. 8. Model of intestinal inflammation due to recurrent Gram-negative ST infection
In the absence of infection of the small intestine, the anti-inflammatory GPI–linked IAP glycoprotein (green circles) is highly expressed on the enterocyte cell surface. IAP is eventually released into the lumen and travels through the intestinal tract to the colon where it detoxifies LPS-phosphate produced by Gram-negative and commensal bacteria via dephosphorylation (yellow circles). Nascent IAP at the enterocyte cell surface undergoes a low rate of desialylation linked to the rate of internalization and degradation involving a normal mechanism of IAP aging and turnover. Enterocytes of the small intestine respond to LPS-phosphate and ST infection by activating Tlr4 function, which induces host Neu3 neuraminidase (blue bars) on the enterocyte surface. Increased neuraminidase activity accelerates the rate of IAP de-sialylation and internalization (orange circles), reducing IAP abundance and resulting in increased levels of LPS-phosphate in the colon where Tlr4 activation elicits inflammation and disease.

Comment in

References

    1. Khor B, Gardet A, Xavier RJ. Genetics and pathogenesis of inflammatory bowel disease. Nature. 2011;7351:307–317. doi: 10.1038/nature10209. - DOI - PMC - PubMed
    1. Kaser A, Zeissig S, Blumberg RS. Inflammatory bowel disease. Annu Rev Immunol. 2010;28:573–621. doi: 10.1146/annurev-immunol-030409-101225. - DOI - PMC - PubMed
    1. Sansonetti PJ. War and peace at mucosal surfaces. Nat Rev Immunol. 2004;4:953–964. doi: 10.1038/nri1499. - DOI - PubMed
    1. Knights D, Lassen KG, Xavier RJ. Advances in inflammatory bowel disease pathogenesis: linking host genetics and the microbiome. Gut. 2013;62:1505–1510. doi: 10.1136/gutjnl-2012-303954. - DOI - PMC - PubMed
    1. Halfvarson J. Genetics in twins with Crohn’s disease: less pronounced than previously believed? Inflamm Bowel Dis. 2011;17:6–12. doi: 10.1002/ibd.21295. - DOI - PubMed

Publication types

MeSH terms