. 2017 Dec 21;8(1):2237.
doi: 10.1038/s41467-017-02386-3.

Promoter-enhancer interactions identified from Hi-C data using probabilistic models and hierarchical topological domains

Affiliations

Promoter-enhancer interactions identified from Hi-C data using probabilistic models and hierarchical topological domains

Gil Ron et al. Nat Commun. .

Abstract

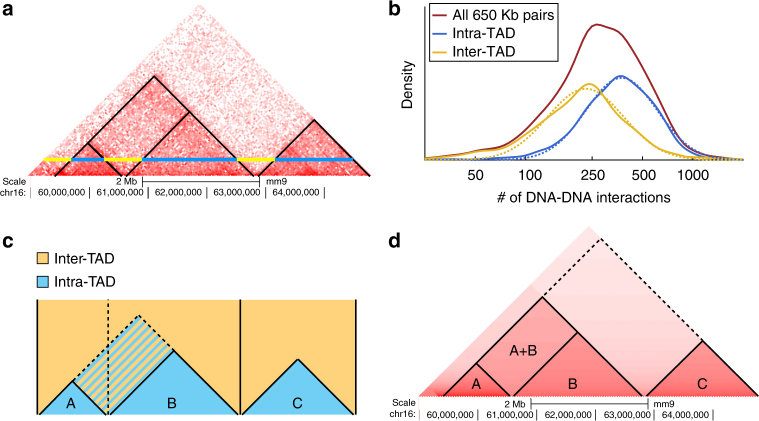
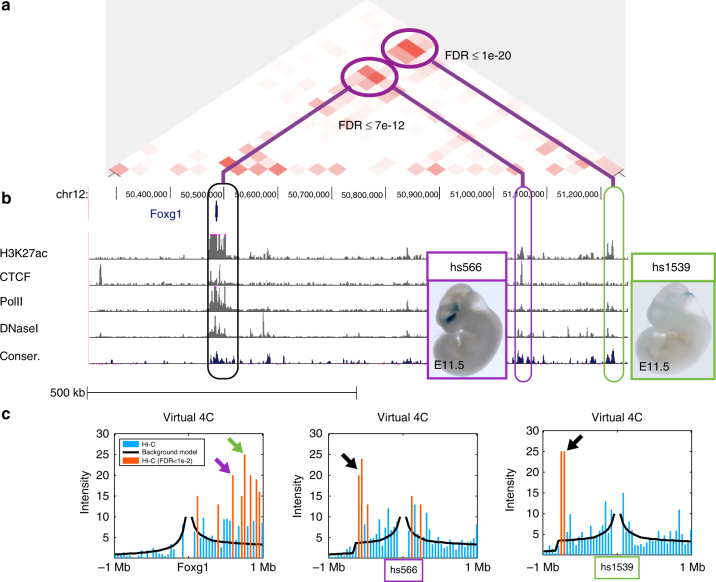
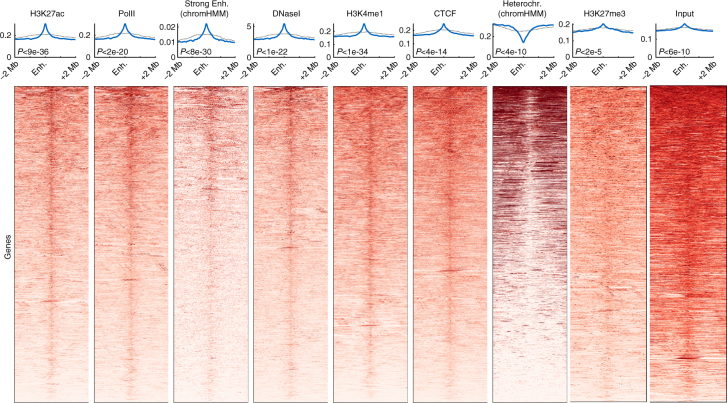
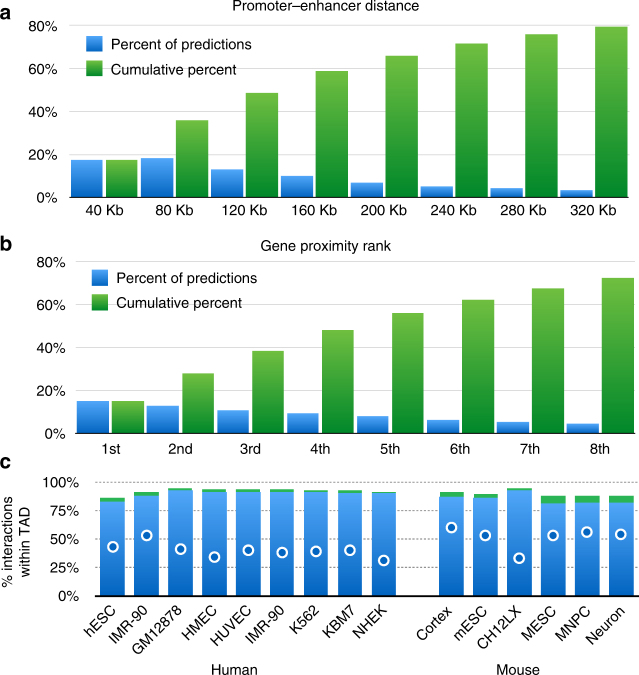
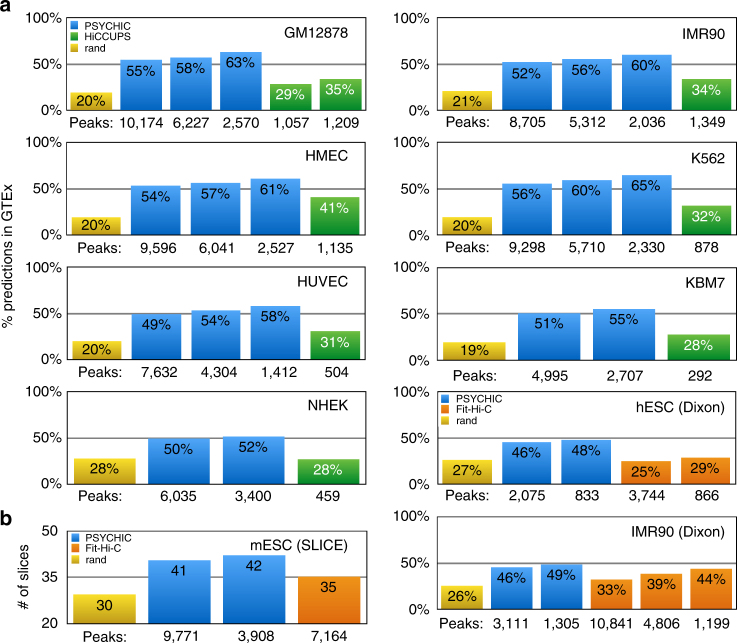
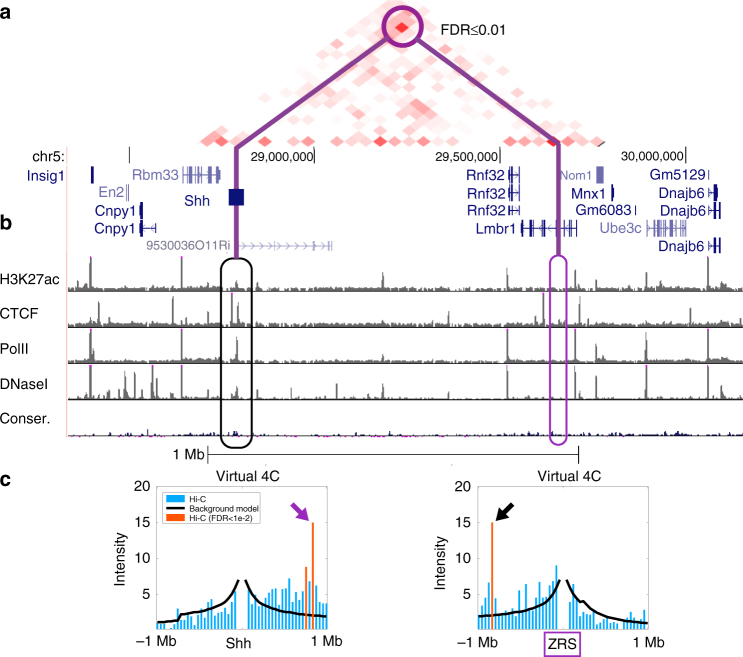
Proximity-ligation methods such as Hi-C allow us to map physical DNA-DNA interactions along the genome, and reveal its organization into topologically associating domains (TADs). As the Hi-C data accumulate, computational methods were developed for identifying domain borders in multiple cell types and organisms. Here, we present PSYCHIC, a computational approach for analyzing Hi-C data and identifying promoter-enhancer interactions. We use a unified probabilistic model to segment the genome into domains, which we then merge hierarchically and fit using a local background model, allowing us to identify over-represented DNA-DNA interactions across the genome. By analyzing the published Hi-C data sets in human and mouse, we identify hundreds of thousands of putative enhancers and their target genes, and compile an extensive genome-wide catalog of gene regulation in human and mouse. As we show, our predictions are highly enriched for ChIP-seq and DNA accessibility data, evolutionary conservation, eQTLs and other DNA-DNA interaction data.


Conflict of interest statement

The authors declare no competing financial interests.

Figures

Fig. 1
Fig. 1
Overview of the PSYCHIC algorithm. a Example of Hi-C interaction map (rotated in 45°), from mouse cortex (chr16, 59–65 Mb). Blue and yellow horizontal lines correspond to DNA–DNA pairs, 650 Kb apart, within and across domains. b Histograms show the empirical abundance of these DNA–DNA interactions, either within domains (blue) or across domains (yellow), and demonstrate the enrichment of intra-TAD interactions. Dotted lines show a log-Normal distribution fitted to these empirical data. c. PSYCHIC first uses a two-component probabilistic mixture model to estimate the number of intra-TAD (blue) and inter-TAD (yellow) DNA–DNA interactions. For example, shown is segmentation into three domains A–C (delineated by vertical lines). An alternative segmentation, where A and B domains are unified now consider the striped rectangle as intra-TAD. PSYCHIC uses a log-posterior ratio score with a Dynamic Programming algorithm to identify the optimal (Viterbi) segmentation of the chromosome into domains. d. PSYCHIC then iteratively merges similar neighboring domains (here, A + B) into hierarchical structures. For example, dotted lines marks a possible 2nd–order merge between the merged (A + B) domain and domain C. PSYCHIC then fits a bi-linear power-law model for each TAD or merge to reconstruct a domain-specific background model (shown by different shades of red). This allows for the identification of over-represented DNA–DNA pairs, including putative promoter–enhancer interactions
Fig. 2
Fig. 2
Analysis of mouse cortex Hi-C data by PSYCHIC. PSYCHIC analysis of the Foxg1 locus in adult mouse cortex Hi-C data identifies two putative enhancer bins enriched with Foxg1. a Residual map for the Foxg1 locus (chr12, 50.3–51.2 Mb) shows the measured Hi-C map after the subtraction of the background model fitted by PSYCHIC, with two significantly enriched Hi-C cells, connecting Foxg1 with two putative enhancer bins. b ChIP-seq and evolutionary conservation data matching active enhancers, within the two putative enhancer regions. c Virtual 4C plots centered at Foxg1 (left) and the two enhancer loci (hs599 and hs1539), comparing measured Hi-C data (bars) vs. the fitted background model as reconstructed by PSYCHIC (black line). Statistically significant DNA–DNA interactions (FDR < 0.01) are marked by orange bars. Arrows show significant interactions between Foxg1, hs566 and the hs1539 orthologous regions. Inset images (hs566, hs1539) from the VISTA Enhancer Browser by Visel et al
Fig. 3
Fig. 3
Chromatin marks surrounding predicted enhancer regions. Chromatin marks at 4 Mb windows centered around 17,788 putative enhancer regions, predicted using PSYCHIC (FDR < 1e-2) for adult mouse cortex Hi-C data. Shown are typical enhancer marks (H3K27ac, H3K4me1), along with PolII and CTCF ChIP-seq, chromHMM classifications, H3K27me3, and DNaseI hypersensitivity assays. Blue lines mark the average signal over the predicted enhancer Hi-C bins. Black dotted lines mark the signal averaged over a random set of genomic loci, sampled in 2 Mb windows around promoters. The statistical significance of each plot (p value) is calculated by comparing the average signal at putative enhancers with their >500 Kb surrounding
Fig. 4
Fig. 4
Promoter–enhancers interactions. a. Distribution (blue) and cumulative distribution (green) of promoter–enhancer interactions for mouse cortex data, as predicted form PSYCHIC (FDR < 1e-2). b Same as (A), reporting the proximity rank of genes associated with predicted enhancer bins. c Most putative enhancers reside within the same TAD as their targets. For each of the 15 human and mouse Hi-C experiments analyzed, the Y-axis shows the percent of predicted DNA–DNA pairs to fall within the same topological domain. Green supplements show the percent of additional pairs falling within 1st level of TAD–TAD hierarchical merges. Blue dots show percent of “random” enhancers residing within the same TAD
Fig. 5
Fig. 5
Promoter–enhancer predictions are supported by ChIP-seq data, DNA accessibility, evolutionary conservation, and chromHMM “Strong Enhancer” loci. Shown are the average signal for ChIP-seq and additional genomic data, over predicted enhancer regions using PSYCHIC (FDR < 1e-2, blue), HiCCUPS (green), Fit-Hi-C (value < 1e-10 for IMR90 and hES, q < 1e-4 for mCO, orange) or random interactions (yellow). Notably, PSYCHIC predictions are generally more enriched for all enhancer-related data, while HiCCUPS and Fit-Hi-C predictions are more enriched for CTCF and Insulator marks. No chromHMM data was found for mES
Fig. 6
Fig. 6
PSYCHIC predictions are enriched for eQTLs and ultra-thin nuclear cryo-sectioning slices. a The majority of PSYCHIC’s promoter–enhancer interactions are supported by eQTL data from the Genotype-Tissue Expression (GTEx) Project. Shown is a comparison of the percentage of predicted interactions using various methods with eQTL data, including random promoter-proximal interactions (yellow), PSYCHIC predictions (blue, using FDR thresholds of 1e-2 and 1e-4. Results with FDR < 1e-10 are also shown for first 5 cell lines), HiCCUPS (green), or Fit-Hi-C (orange; value thresholds of 1e-10, 1e-20, and for IMR90 also 1e-40), for various cell lines and tissues in human and mouse. Below each bar, we mark the number of predicted promoter–enhancer interactions. b Comparison of random (yellow), PSYCHIC (blue; FDR < 1e-2 and FDR < 1e-4) and Fit-Hi-C (orange; value <1e-20) predictions, with regard to the sequencing of genomic DNA content in ultra-thin cryo-sectioning slices in mES cells. Y-axis marks the number of slices in which both the enhancer and the promoter regions were co-sequenced
Fig. 7
Fig. 7
Shh–ZRS interaction in adult mouse cortex. Significantly enriched promoter–enhancer interactions (in adult mouse cortex) between Shh and inactive limb-specific enhancer ZRS (chr5:28.3–30.2 Mb). a Residual map (measured Hi-C data after subtraction of background model fitted by PSYCHIC) identifies over-represented DNA–DNA interactions between the Shh locus and its limb-specific enhancer ZRS. b Genome-wide ChIP-seq and accessibility data from adult mouse cortex show no active enhancer marks for this enhancer. c. Virtual 4C plots for the Shh (left) and the ZRS (right) loci, comparing Hi-C interactions with the local background model reconstructed by PSYCHIC. Arrows mark significant between Shh and ZRS

References

    1. Visel A, Rubin EM, Pennacchio LA. Genomic views of distant-acting enhancers. Nature. 2009;461:199–205. doi: 10.1038/nature08451. - DOI - PMC - PubMed
    1. Bickmore WA, van Steensel B. Genome architecture: domain organization of interphase chromosomes. Cell. 2013;152:1270–1284. doi: 10.1016/j.cell.2013.02.001. - DOI - PubMed
    1. Rowley MJ, Corces VG. The three-dimensional genome: principles and roles of long-distance interactions. Curr. Opin. Cell. Biol. 2016;40:8–14. doi: 10.1016/j.ceb.2016.01.009. - DOI - PMC - PubMed
    1. Van Steensel B, Dekker J. Genomics tools for unraveling chromosome architecture. Nat. Biotechnol. 2010;28:1089–1095. doi: 10.1038/nbt.1680. - DOI - PMC - PubMed
    1. Dekker J, Mirny L. The 3D genome as moderator of chromosomal communication. Cell. 2016;164:1110–1121. doi: 10.1016/j.cell.2016.02.007. - DOI - PMC - PubMed

Publication types