. 2017 Dec 7:8:2084.
doi: 10.3389/fpls.2017.02084. eCollection 2017.

Variations of Histone Modification Patterns: Contributions of Inter-plant Variability and Technical Factors

Affiliations

Variations of Histone Modification Patterns: Contributions of Inter-plant Variability and Technical Factors

Sylva Brabencová et al. Front Plant Sci. .

Abstract

Inter-individual variability of conspecific plants is governed by differences in their genetically determined growth and development traits, environmental conditions, and adaptive responses under epigenetic control involving histone post-translational modifications. The apparent variability in histone modifications among plants might be increased by technical variation introduced in sample processing during epigenetic analyses. Thus, to detect true variations in epigenetic histone patterns associated with given factors, the basal variability among samples that is not associated with them must be estimated. To improve knowledge of relative contribution of biological and technical variation, mass spectrometry was used to examine histone modification patterns (acetylation and methylation) among Arabidopsis thaliana plants of ecotypes Columbia 0 (Col-0) and Wassilewskija (Ws) homogenized by two techniques (grinding in a cryomill or with a mortar and pestle). We found little difference in histone modification profiles between the ecotypes. However, in comparison of the biological and technical components of variability, we found consistently higher inter-individual variability in histone mark levels among Ws plants than among Col-0 plants (grown from seeds collected either from single plants or sets of plants). Thus, more replicates of Ws would be needed for rigorous analysis of epigenetic marks. Regarding technical variability, the cryomill introduced detectably more heterogeneity in the data than the mortar and pestle treatment, but mass spectrometric analyses had minor apparent effects. Our study shows that it is essential to consider inter-sample variance and estimate suitable numbers of biological replicates for statistical analysis for each studied organism when investigating changes in epigenetic histone profiles.

Keywords: Arabidopsis thaliana; ecotype; epigenetics; histone; mass spectrometry; post-translational modifications.


Figures
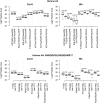
FIGURE 1
FIGURE 1
Inter-plant variability of selected histone mark levels in A. thaliana Col-0 and Ws ecotypes grown from seeds collected from a single parent plant (Single) and a set of parent plants (Mixed), after aggregation of technical replicates. For each ecotype and histone, the distribution of normalized log2-transformed peptide precursor XIC peak areas is represented by a pair of boxplots: Mixed (left) and Single (right). Abundances of peptides with missed enzyme cleavages (e.g., QLATKAAR and KQLATKAAR) were summed. The boxplots show extremes, interquartile ranges and medians obtained from analyses of samples of eight plants (averages of three technical batches). Differences in variances in abundances of individual peptides between Mixed and Single samples were compared by F-tests, p-values are indicated.
FIGURE 2
FIGURE 2
Contributions of biological and technical components to the total variance of observed histone mark levels in A. thaliana Col-0 and Ws ecotypes grown from seeds collected from a single parent plant (Single) and a set of parent plants (Mixed). In each case, the total variance (Sum) of the abundance of selected individual H3 and H4 histone peptide forms (N = 13) was decomposed into variance related to plant cultivation and sample preparation (biological, denoted Plant + Prep.) and variance related to measurement by the LC-MS/MS system (technical, denoted LC-MS/MS) by LMM. Medians are indicated by horizontal bars and numbers.
FIGURE 3
FIGURE 3
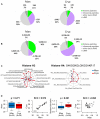
Comparison of the quality of histone protein extracts obtained by manual plant tissue homogenization (Man) and using a cryomill (Cryo). (A) Differences in protein yield, (B) distributions of identified proteins (means and SD, N = 3) and (C) Venn diagrams displaying the number of overlapping protein groups identified in biological triplicates.
FIGURE 4
FIGURE 4
Comparison of the quality of histone peptides obtained by manual plant tissue homogenization (Man) and using a cryomill (Cryo). Differences in qualitative (A) and quantitative (B) distributions of identified peptides (merged data, N = 3). (C) Radar charts showing RAs of histone H3 and H4 peptide forms (ratios of XIC peak areas of peptides with given PTMs to the sum of peak areas of all forms of H3 or H4 peptides, respectively, in percentages). Y-values are binary logarithms, with zero at the center of each chart. (D) Box-plots and scatter-plots of the means and standard deviations of abundances of histone H3 and H4 peptide forms detected in the samples. The boxplots show extremes, interquartile ranges and medians (N = 28). Means and standard deviations were compared by Mann–Whitney tests (p-values) and calculating Spearman’s correlation coefficients (SCC values).

References

    1. Aebersold R., Mann M. (2016). Mass-spectrometric exploration of proteome structure and function. Nature 537 347–355. 10.1038/nature19949 - DOI - PubMed
    1. Al Shweiki M. R., Mönchgesang S., Majovsky P., Thieme D., Trutschel D., Hoehenwarter W. (2017). Assessment of label-free quantification in discovery proteomics and impact of technological factors and natural variability of protein abundance. J. Proteome Res. 16 1410–1424. 10.1021/acs.jproteome.6b00645 - DOI - PubMed
    1. Bates D., Mächler M., Bolker B., Walker S. (2015). Fitting linear mixed-effects models using lme4. J. Stat. Softw. 67 1–48. 10.18637/jss.v067.i01 - DOI
    1. Bennett K. L., Wang X., Bystrom C. E., Chambers M. C., Andacht T. M., Dangott L. J., et al. (2015). The 2012/2013 ABRF proteomic research group study: assessing longitudinal intralaboratory variability in routine peptide liquid chromatography tandem mass spectrometry analyses. Mol. Cell. Proteomics 14 3299–3309. 10.1074/mcp.O115.051888 - DOI - PMC - PubMed
    1. Birney E., Stamatoyannopoulos J. A., Dutta A., Guigó R., Gingeras T. R., Margulies E. H., et al. (2007). Identification and analysis of functional elements in 1% of the human genome by the ENCODE pilot project. Nature 447 799–816. 10.1038/nature05874 - DOI - PMC - PubMed

LinkOut - more resources