. 2017 Dec 15:10:37.
doi: 10.1186/s13040-017-0156-2. eCollection 2017.

Cluster ensemble based on Random Forests for genetic data

Affiliations

Cluster ensemble based on Random Forests for genetic data

Luluah Alhusain et al. BioData Min. .

Abstract

Background: Clustering plays a crucial role in several application domains, such as bioinformatics. In bioinformatics, clustering has been extensively used as an approach for detecting interesting patterns in genetic data. One application is population structure analysis, which aims to group individuals into subpopulations based on shared genetic variations, such as single nucleotide polymorphisms. Advances in DNA sequencing technology have facilitated the obtainment of genetic datasets with exceptional sizes. Genetic data usually contain hundreds of thousands of genetic markers genotyped for thousands of individuals, making an efficient means for handling such data desirable.

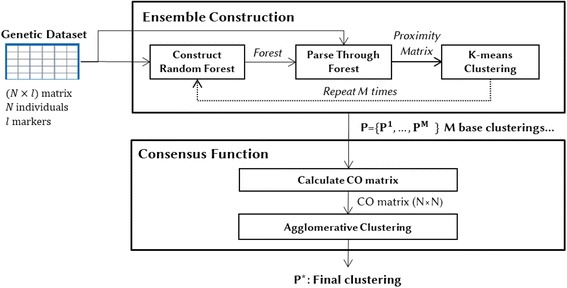
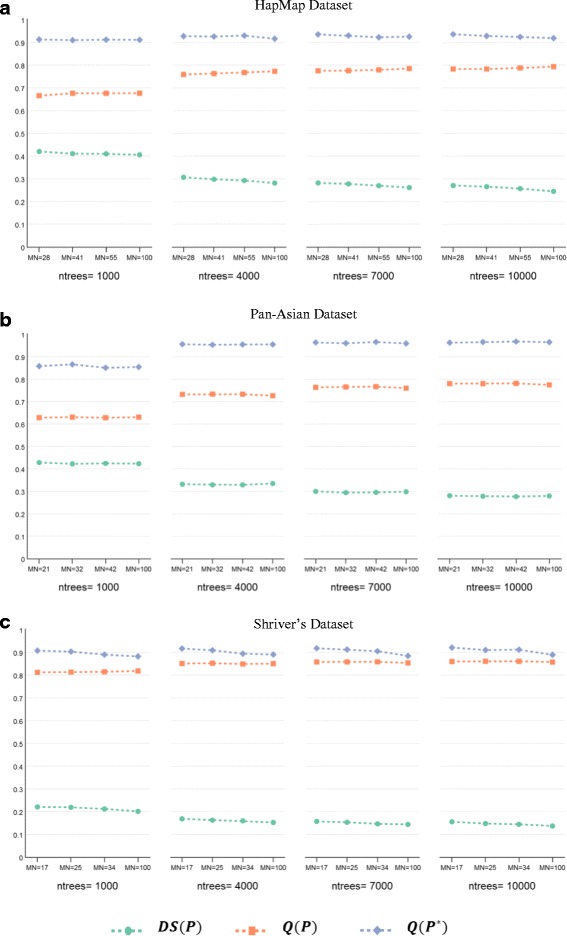
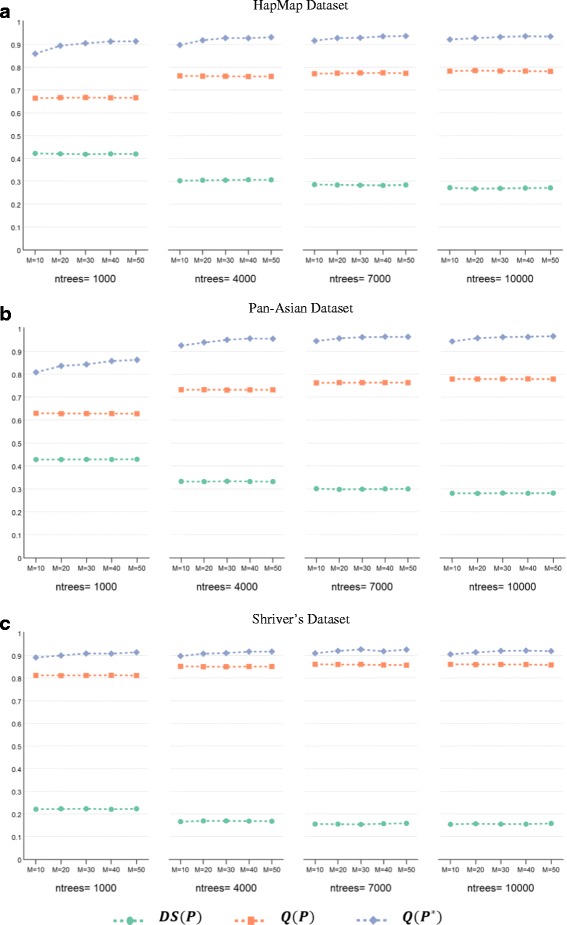
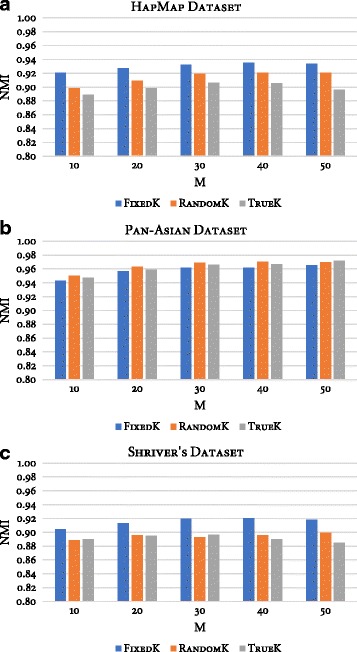
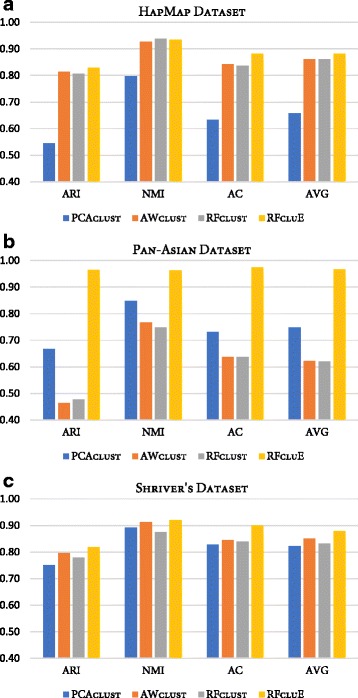
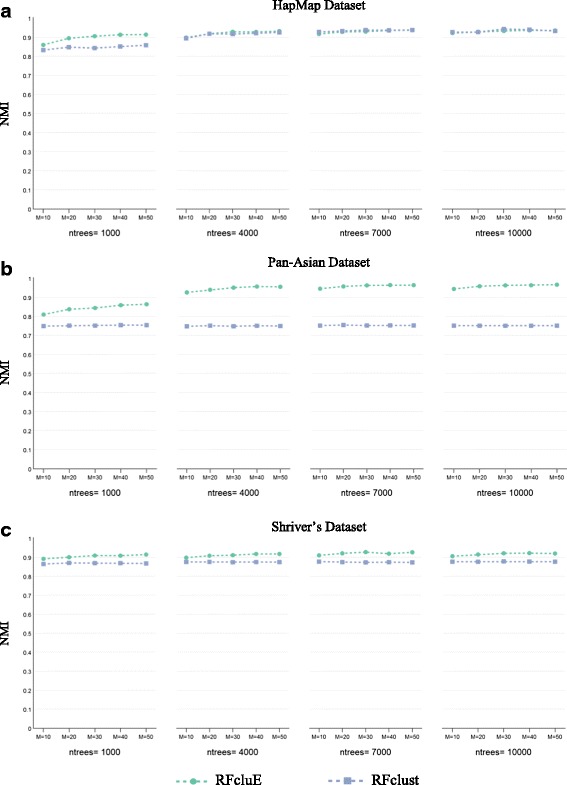
Results: Random Forests (RFs) has emerged as an efficient algorithm capable of handling high-dimensional data. RFs provides a proximity measure that can capture different levels of co-occurring relationships between variables. RFs has been widely considered a supervised learning method, although it can be converted into an unsupervised learning method. Therefore, RF-derived proximity measure combined with a clustering technique may be well suited for determining the underlying structure of unlabeled data. This paper proposes, RFcluE, a cluster ensemble approach for determining the underlying structure of genetic data based on RFs. The approach comprises a cluster ensemble framework to combine multiple runs of RF clustering. Experiments were conducted on high-dimensional, real genetic dataset to evaluate the proposed approach. The experiments included an examination of the impact of parameter changes, comparing RFcluE performance against other clustering methods, and an assessment of the relationship between the diversity and quality of the ensemble and its effect on RFcluE performance.

Conclusions: This paper proposes, RFcluE, a cluster ensemble approach based on RF clustering to address the problem of population structure analysis and demonstrate the effectiveness of the approach. The paper also illustrates that applying a cluster ensemble approach, combining multiple RF clusterings, produces more robust and higher-quality results as a consequence of feeding the ensemble with diverse views of high-dimensional genetic data obtained through bagging and random subspace, the two key features of the RF algorithm.

Keywords: Cluster ensemble; Ensemble diversity; Genetic population; High-dimensional data; Normalized mutual information; Population structure analysis; Random Forest proximity; Random Forests; Single nucleotide polymorphism.


Conflict of interest statement

Not applicable.Not applicable.The authors declare that they have no competing interests.Springer Nature remains neutral with regard to jurisdictional claims in published maps and institutional affiliations.

Figures

Fig. 1
Fig. 1
Random Forest cluster Ensemble (RFcluE) approach
Fig. 2
Fig. 2
The impact of the change of RF parameters on the performance of the RFcluE approach. The figure shows the impact of the number of trees (ntrees) and the tree size controlled by the maximum number of leaf nodes (MN) on the performance of the RFcluE approach measured using the diversity and quality of the base clusterings along with the quality of the ensemble’s final clustering, where M = 40. a HapMap Dataset. b Pan-Asian Dataset. c Shriver’s Dataset
Fig. 3
Fig. 3
The impact of ensemble size on the performance of the RFcluE approach. The figure shows the impact of the ensemble size (M) on the performance of the RFcluE approach, across a different number of trees(ntrees), measured using the diversity and quality of the base clusterings along with the quality of the ensemble’s final clustering, where MN =N. a HapMap Dataset. b Pan-Asian Dataset. c Shriver’s Dataset
Fig. 4
Fig. 4
Performance of three schemes for selecting the number of clusters produced by the base clustering method of RFcluE. The figure shows a plot that compares the performance of three schemes—FixedK, RandomK, and TrueK—for selecting the number of clusters produced by the base clustering method in the RFcluE approach over different ensemble sizes, where ntrees = 10,000 and MN = N. a HapMap Dataset. b Pan-Asian Dataset. c Shriver’s Dataset
Fig. 5
Fig. 5
The impact of utilizing different association measures in the consensus function on the performance of the RFcluE. The figures show the NMI of RFcluE when the similarity between partitions is measured using CO, CTS, SRS, and ASRS in the consensus function. a HapMap Dataset. b Pan-Asian Dataset. c Shriver’s Dataset
Fig. 6
Fig. 6
The impact of utilizing different clustering techniques in the consensus function on the performance of the RFcluE. The figure shows the NMI of the RFcluE when applying K-means, spectral clustering, and Ward’s algorithm in the consensus function. a HapMap Dataset. b Pan-Asian Dataset. c Shriver’s Dataset
Fig. 7
Fig. 7
Performance of PCAclust, AWclust, RFclust, and RFcluE evaluated using ARI, AC, and NMI. The figure shows a plot that compares the performance of PCAclust, AWclust, RFclust, and RFcluE, measured using three measures—ARI, AC, and NMI—along with the average of these measures. a HapMap Dataset. b Pan-Asian Dataset. c Shriver’s Dataset
Fig. 8
Fig. 8
The impact of the change of RF parameters on the performance of RFclust vs. RFcluE. The figure shows the impact of the number of trees (ntrees) and the tree size controlled by the maximum number of leaf nodes (MN) om the performance of RFclust and RFcluE measured using NMI. a HapMap Dataset. b Pan-Asian Dataset. c Shriver’s Dataset
Fig. 9
Fig. 9
The impact of the change of the number of forests on the performance of RFclust vs. RFcluE. The figure shows the impact of the number of forests (nforests) on the performance of RFclust and RFcluE, which represents the ensemble size in RFcluE, measured using NMI across different numbers of trees (ntrees). a HapMap Dataset. b Pan-Asian Dataset. c Shriver’s Dataset

References

    1. Marchini J, Cardon LR, Phillips MS, Donnelly P. The effects of human population structure on large genetic association studies. Nat Genet. 2004;36:512–517. doi: 10.1038/ng1337. - DOI - PubMed
    1. Kidd KK, Pakstis AJ, Speed WC, Grigorenko EL, Kajuna SL, Karoma NJ, Kungulilo S, Kim J-J, Lu R-B, Odunsi A. Developing a SNP panel for forensic identification of individuals. Forensic Sci Int. 2006;164:20–32. doi: 10.1016/j.forsciint.2005.11.017. - DOI - PubMed
    1. Gao X, Starmer J. Human population structure detection via multilocus genotype clustering. BMC Genet. 2007;8:34. doi: 10.1186/1471-2156-8-34. - DOI - PMC - PubMed
    1. Patterson N, Price AL, Reich D. Population structure and eigenanalysis. PLoS Genet. 2006;2:e190. doi: 10.1371/journal.pgen.0020190. - DOI - PMC - PubMed
    1. Reich DE, Cargill M, Bolk S, Ireland J, Sabeti PC, Richter DJ, Lavery T, Kouyoumjian R, Farhadian SF, Ward R, Lander ES. Linkage disequilibrium in the human genome. Nature. 2001;411:199–204. doi: 10.1038/35075590. - DOI - PubMed