Review
. 2017 Oct 4;4(12):1700323.
doi: 10.1002/advs.201700323. eCollection 2017 Dec.

Photogating in Low Dimensional Photodetectors

Affiliations
Review

Photogating in Low Dimensional Photodetectors

Hehai Fang et al. Adv Sci (Weinh). .

Abstract

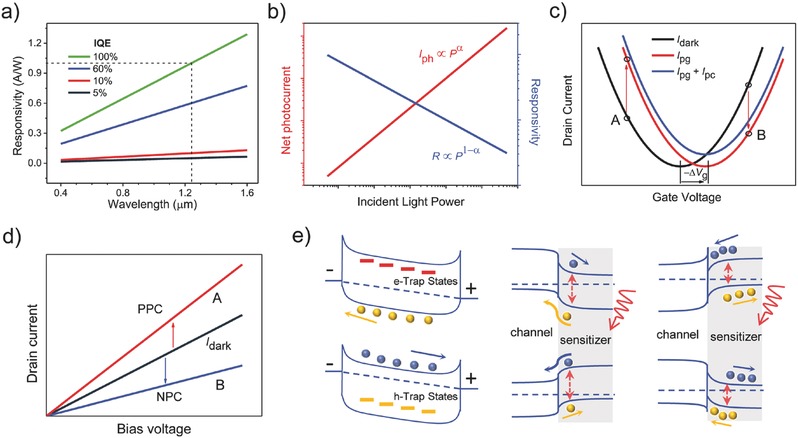
Low dimensional materials including quantum dots, nanowires, 2D materials, and so forth have attracted increasing research interests for electronic and optoelectronic devices in recent years. Photogating, which is usually observed in photodetectors based on low dimensional materials and their hybrid structures, is demonstrated to play an important role. Photogating is considered as a way of conductance modulation through photoinduced gate voltage instead of simply and totally attributing it to trap states. This review first focuses on the gain of photogating and reveals the distinction from conventional photoconductive effect. The trap- and hybrid-induced photogating including their origins, formations, and characteristics are subsequently discussed. Then, the recent progress on trap- and hybrid-induced photogating in low dimensional photodetectors is elaborated. Though a high gain bandwidth product as high as 109 Hz is reported in several cases, a trade-off between gain and bandwidth has to be made for this type of photogating. The general photogating is put forward according to another three reported studies very recently. General photogating may enable simultaneous high gain and high bandwidth, paving the way to explore novel high-performance photodetectors.

Keywords: infrared; low dimensional; photodetectors; photogating; phototransistors.


Figures

Figure 1
Figure 1
Identification of photogating. a) Wavelength dependence of responsivity at different internal quantum efficiency when the gain is ignored. b) Power law: nonlinear light power dependence of net photocurrent and responsivity (0 < α < 1). c) I dsV g trace shift after illumination. Dark line, red line, and blue line represent the dark current, photocurrent of photogating effect, photocurrent of photogating and photoconductive effect, respectively. ΔV g is the photoinduced local gate voltage as mentioned in the main text. Because the trace shift direction and photovoltage have an opposite sign, here we use −ΔV g to denote the trace shift direction. d) I dsV d curves of points A and B in panel (c) in dark and under illumination. e) Schematic diagrams of band alignments of trap‐ and hybrid‐induced photogating. Left panel: p‐type material with electron‐trap states (top part) and n‐type material with hole‐trap states (bottom part); Middle panel: e–h pairs are generated in the sensitizer and electrons remain in the gating layer whereas holes get into the channel (top part), or holes remain in the gating layer whereas electrons get into the channel (bottom part); Right panel: e–h pairs are generated in the sensitizer and electrons are accumulated at the interface (top part), or holes are accumulated at the interface (bottom part).
Figure 2
Figure 2
Nanowire (NW) surface band bending and its impact on photoconductance. a) Diameter dependence of conduction and valance band shapes in an n‐type NW with hole‐trap surface states. Left panel: small surface band bending and full depletion of NW at small diameters; Middle panel: surface band bending and full depletion of NW at critical diameter; Right panel: the NW is not fully depleted for larger diameters. When under illumination, photogenerated electrons and holes are separated under built‐in field. φB is the recombination barrier. Reproduced with permission.69 Copyright 2005, American Chemical Society. b) Left panel: photogating‐induced negative photoconductance in InAs NWs. The blue light trace indicates an illumination with much higher photon energy than the bandgap of InAs, and the black dashed box represents the recombination between the photogenerated holes and free electrons. Right panel: because of the accumulated electrons on the NW surface (this could be achieved by high‐energy photon illumination at low temperature), the InAs NW core is nearly fully depleted. Subsequently, an infrared light (with lower photon energy as depicted in red light trace) could cause the positive photoconductance.
Figure 3
Figure 3
Ferroelectric field enhanced NIR InP nanowire photodetector. a) Schematic diagram of the device structure. b) I dsV ds curves in dark and under illumination before ferroelectric polarization (left panel) and after negative polarization (right panel). Reproduced with permission.17 Copyright 2016, American Chemical Society.
Figure 4
Figure 4
a) Schematic diagram of photogating dominated core/shell like InAs nanowire (NW) phototransistor. Reproduced with permission.38 b) Gate voltage pulse controlled drain current in low temperature InAs NW memory. Reproduced with permission.65 Copyright 2015, American Chemical Society. c) Schematic diagram of visible light‐assisted infrared InAs NW photodetector. Reproduced with permission.75 Copyright 2016, American Chemical Society. d) Gate pulse controlled recover process of drain current after illumination in oxide thin‐film transistor. Reproduced with permission.71 Copyright 2012, Nature Publishing Group.
Figure 5
Figure 5
Photogating and photoconductive effect in monolayer MoS2 photodetector. a) Schematic diagram of density‐of‐states (DOS) and simplified energy band diagram with features of charge trapping model. b) Photocurrent versus optical modulation frequency. The slow component which quenches at high frequency is dominated by photogating. Reproduced with permission.37 Copyright 2014, American Chemical Society.
Figure 6
Figure 6
a) Crystal structure of In2Se3. b) Photocurrent versus incident power at different gate voltages. Reproduced with permission.47 Copyright 2015, American Chemical Society.
Figure 7
Figure 7
Photogating enhanced mid‐infrared black phosphorus photodetector. a) Schematic view of the device structure. b) Maximum photocurrent under various incident powers achieved at around the maximum transconductance. c) Photocurrent amplitude versus optical modulation frequency under various incident powers. Reproduced with permission.29 Copyright 2016, American Chemical Society.
Figure 8
Figure 8
QD/2D material hybrid photodetectors. a) Schematic view of hybrid graphene–quantum dot phototransistors. Reproduced with permission.31 Copyright 2012, Nature Publishing Group. b) Side view of the photogating enhanced graphene/QD imaging sensor and the underlying read‐out circuit. Reproduced with permission.87 Copyright 2017, Nature Publishing Group. c) Transfer curves of MoS2/PbS QDs device before and after inserting a TiO2 insulating layer between QDs and MoS2. Reproduced with permission.86 Copyright 2016, American Chemical Society.
Figure 9
Figure 9
Graphene‐based hybrid photodetectors. a) Device structure of hybrid graphene–MoS2 photodetector. Reproduced with permission.32 Copyright 2013, Nature Publishing Group. b) Working principle of sandwiched graphene/Ta2O5/graphene hybrid MIR photodetector. Reproduced with permission.91 Copyright 2014, Nature Publishing Group. c) I dsV g trace shifts of hybrid graphene/carbon nanotube photodetector under different incident light powers. Reproduced with permission.39 Copyright 2015, Nature Publishing Group. d) Schematic diagram of the hybrid graphene/perovskite photodetector. Reproduced with permission.89
Figure 10
Figure 10
Three cases of general photogating. a) Left panel: the simulated relationship between gain and frequency for the PVFET, and photoconductors and photo‐FETs (inset: schematic diagram of the PVFET). Right panel: temporal response of the PVFET. Reproduced with permission.40 Copyright 2017, Nature Publishing Group. b) Graphene photodetector based on interfacial gating and its energy band explanation. Reproduced with permission.44 Copyright 2016, Optical Society of America. c) Schematic view and circuit diagram of an individual pyroelectric graphene bolometer. Reproduced with permission.95 Copyright 2017, Nature Publishing Group.
Figure 11
Figure 11
Responsivity and response time of part current state‐of‐the‐art low dimensional photodetectors.17, 31, 32, 39, 40, 44, 47, 67, 99, 100, 101, 102, 103, 104 The blue line represents a typical magnitude order of GBP for traditional high‐performance thin‐film photodetectors. Red symbol indicates that this is a photogating enhanced photodetector.

References

    1. Hawkins A. R., Wu W., Abraham P., Streubel K., Bowers J. E., Appl. Phys. Lett. 1997, 70, 303.
    1. Kang Y., Liu H.‐D., Morse M., Paniccia M. J., Zadka M., Litski S., Sarid G., Pauchard A., Kuo Y.‐H., Chen H.‐W., Zaoui W. S., Bowers J. E., Beling A., McIntosh D. C., Zheng X., Campbell J. C., Nat. Photonics 2008, 3, 59.
    1. Gao Y., Cansizoglu H., Polat K. G., Ghandiparsi S., Kaya A., Mamtaz H. H., Mayet A. S., Wang Y. A., Zhang X. Z., Yamada T., Devine E. P., Elrefaie A. F., Wang S. Y., Islam M. S., Nat. Photonics 2017, 11, 301.
    1. Rogalski A., Infrared Phys. Technol. 2002, 43, 187.
    1. Kinch M. A., Borrello S. R., Infrared Phys. 1975, 15, 111.