. 2018 Apr;39(4):1532-1554.
doi: 10.1002/hbm.23929. Epub 2017 Dec 21.

Networks of myelin covariance

Affiliations

Networks of myelin covariance

Lester Melie-Garcia et al. Hum Brain Mapp. 2018 Apr.

Abstract

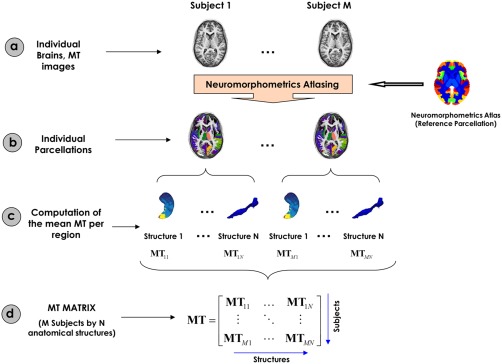
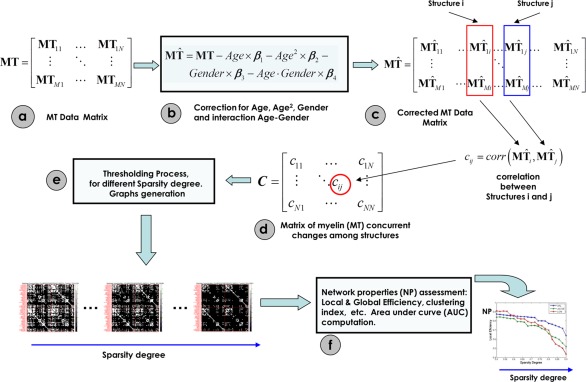
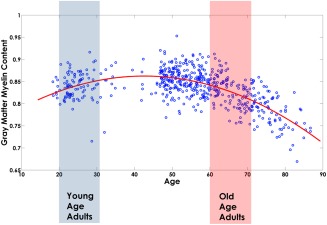
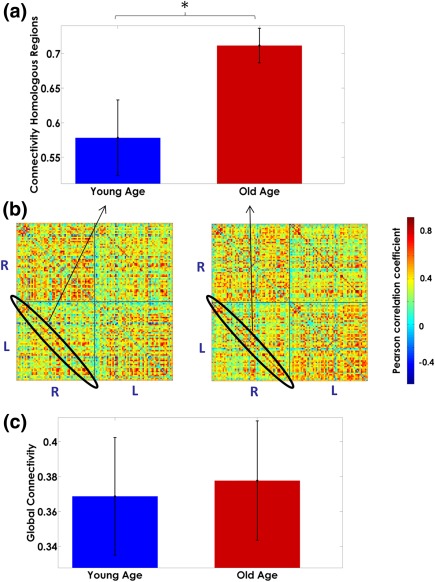
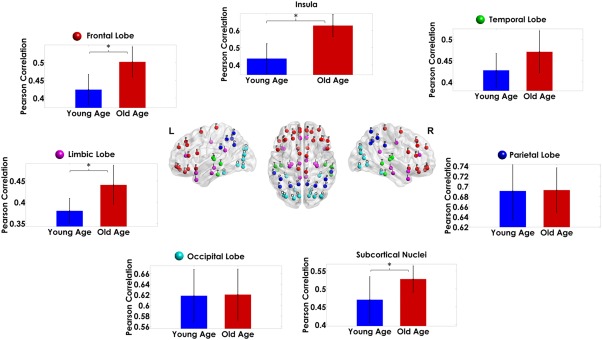
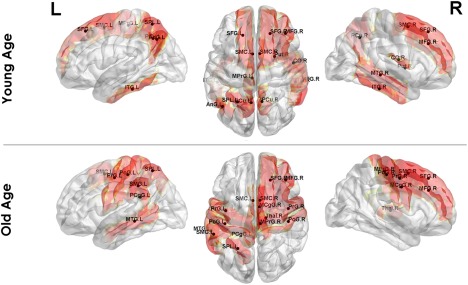
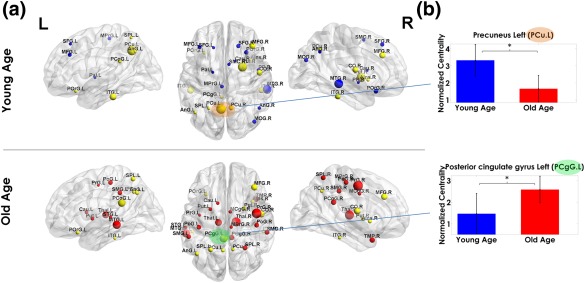
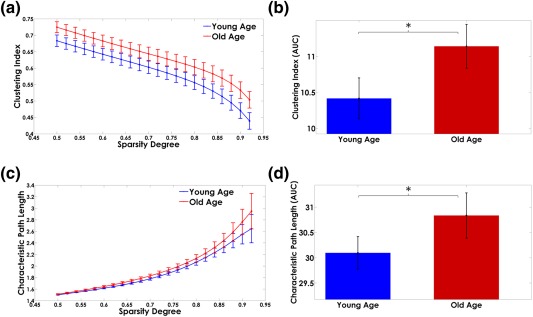
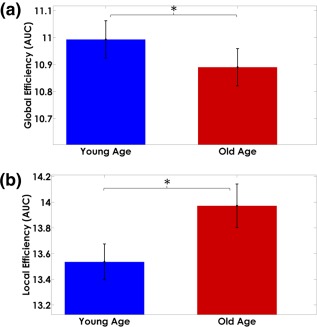
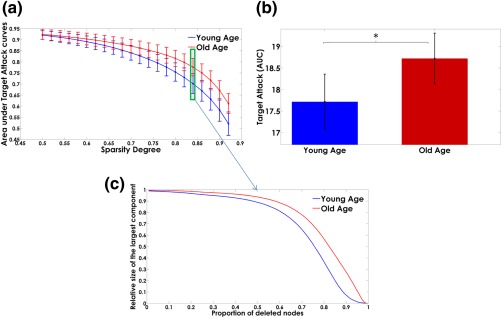
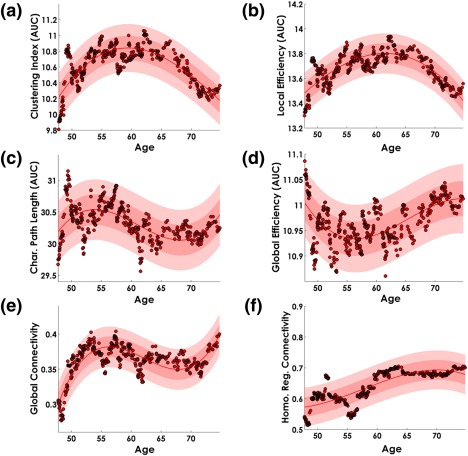
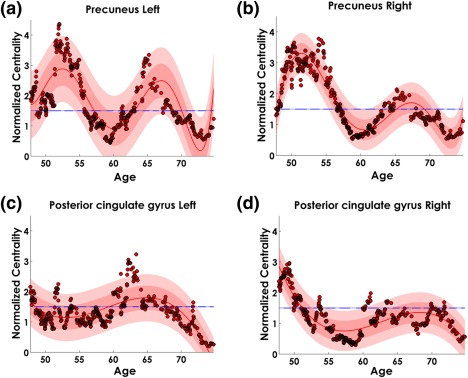
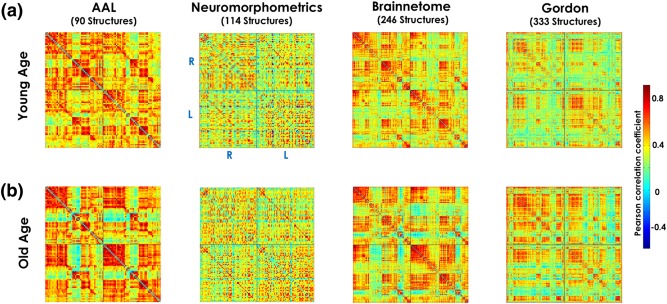
Networks of anatomical covariance have been widely used to study connectivity patterns in both normal and pathological brains based on the concurrent changes of morphometric measures (i.e., cortical thickness) between brain structures across subjects (Evans, ). However, the existence of networks of microstructural changes within brain tissue has been largely unexplored so far. In this article, we studied in vivo the concurrent myelination processes among brain anatomical structures that gathered together emerge to form nonrandom networks. We name these "networks of myelin covariance" (Myelin-Nets). The Myelin-Nets were built from quantitative Magnetization Transfer data-an in-vivo magnetic resonance imaging (MRI) marker of myelin content. The synchronicity of the variations in myelin content between anatomical regions was measured by computing the Pearson's correlation coefficient. We were especially interested in elucidating the effect of age on the topological organization of the Myelin-Nets. We therefore selected two age groups: Young-Age (20-31 years old) and Old-Age (60-71 years old) and a pool of participants from 48 to 87 years old for a Myelin-Nets aging trajectory study. We found that the topological organization of the Myelin-Nets is strongly shaped by aging processes. The global myelin correlation strength, between homologous regions and locally in different brain lobes, showed a significant dependence on age. Interestingly, we also showed that the aging process modulates the resilience of the Myelin-Nets to damage of principal network structures. In summary, this work sheds light on the organizational principles driving myelination and myelin degeneration in brain gray matter and how such patterns are modulated by aging.

Keywords: aging; brain connectivity; graph theory; magnetization transfer; myelin; myelination; precuneus; quantitative MRI; structural network.


Conflict of interest statement

The authors have declared that no conflict of interests exists.

Figures

Figure 1
Figure 1
Flowchart of the MT matrix construction. (a) Representation of the individual MT maps for all subjects. (b) Neuromorphometrics Atlasing processing for the parcellation of the individual MT maps. (c) Mean MT values are computed for all anatomical structures. (d) The local MT values were organized in a “Myelin Data” matrix [Color figure can be viewed at http://wileyonlinelibrary.com]
Figure 2
Figure 2
Steps for the assessment of the Myelin correlation matrices (Myelin Nets). (a) MT data matrix. (b) The MT original data matrix is substituted by residuals of the linear regression represented in (c). (c) Effects of age, age2, gender, and age–gender interaction were regressed out. (d) Correlation matrix representing the myelin concurrent changes among all pairs of anatomical structures. (e) Thresholding process at different sparsity degrees to generate binary graphs. (f) Assessment of the network properties for all binary graphs obtained in (e) [Color figure can be viewed at http://wileyonlinelibrary.com]
Figure 3
Figure 3
Global gray matter MT values versus age for the 562 subjects of the cohort. The MT values (blue scatter plot) followed an inverted‐U shape trajectory that was fitted with a second‐order polynomial model (red plot). The blue and red boxes highlight the age range of the Young and Old Age categories that were used in the covariance analysis [Color figure can be viewed at http://wileyonlinelibrary.com]
Figure 4
Figure 4
Age modulation of the correlation strength between homologous regions (Panel a). Panel b depicts the correlation matrices for each group. The global myelination correlation strength in both Young‐Age and Old‐Age groups is represented in panel c. The bar's height represents the mean magnitude of the correlation, and the error bars represent their standard deviations. In panel b, the “R–R” and “L–L” quadrants represent the intrahemispheric myelin correlations in the right and left hemispheres, respectively. The “R–L” and “L–R” quadrants depict the interhemispheric interactions. The diagonal of the “L–R” quadrant, highlighted in black shows the correlations in myelination between homologous structures across hemispheres. The asterisk denotes significant differences between groups [Color figure can be viewed at http://wileyonlinelibrary.com]
Figure 5
Figure 5
Modulation of the strength in myelination correlation by age within the brain lobes and the subcortical nuclei. The height of the bars represents the mean magnitude of the correlations and the error bars their standard deviation. The asterisks denote significant differences between groups. For reference, we show at the center of the figure the distribution of the nodes in different colors for each lobe [Color figure can be viewed at http://wileyonlinelibrary.com]
Figure 6
Figure 6
Top 15 regions with the largest myelin covariance (most connected) in the Myelin‐Nets for the Young and Old Age Groups [Color figure can be viewed at http://wileyonlinelibrary.com]
Figure 7
Figure 7
Hub regions in Young‐Age and Old‐Age groups (Panel a). Panel b shows the modulation of the normalized betweenness centrality (NBC) by age in the Precuneus left (PCu.L, orange shaded) and Left Posterior cingulate gyrus (PCgG.L, green shaded): the regions with the highest NBC Young and Old Age groups, respectively. The sphere diameter denotes the NBC values. Spheres in yellow are hubs common in both groups. The blue and red hubs are those unique to the Young and Old age groups, respectively. In panel b, the bar heights represent the mean magnitude of the NBCs and the error bars represent their standard deviation. The asterisks denote significant differences between groups [Color figure can be viewed at http://wileyonlinelibrary.com]
Figure 8
Figure 8
Panels (a) and (c) show the network attributes trajectory for different sparsity degrees. The area under the curves (AUC) of the Myelin‐Net's global properties are represented in panels (b) and (d). The bar heights represent the mean of the network properties and the error bars are their standard deviation. The asterisks denote significant differences between groups (p < .05) [Color figure can be viewed at http://wileyonlinelibrary.com]
Figure 9
Figure 9
Area under the curve measures of Myelin‐Net (a) global and (b) local efficiencies. The bar heights represent the mean of the network properties and the error bars are their standard deviation. The Young‐Age group showed higher global efficiency (p < .05) and the Old‐Age higher local efficiency (p < .05) [Color figure can be viewed at http://wileyonlinelibrary.com]
Figure 10
Figure 10
Panel (a) shows the dependence of the “area under targeted attack” on the sparsity degree. The error bars represent the standard deviation over the bootstrap samples. The areas under the “targeted attack” curves are represented in panel (b). The bar heights represent the mean values for the Young‐Age and Old‐Age groups and the error bars the standard deviations. The asterisks denote significant differences between groups. The Old‐Age group showed higher resilience after “simulated attacks” of the Myelin‐Net hubs (p < .05). Panel (c) represents the trajectories of the relative size of the largest components as the principal nodes are “deleted” (“attacked”) for the sparsity degree highlighted in panel a (green box) [Color figure can be viewed at http://wileyonlinelibrary.com]
Figure 11
Figure 11
Age trajectory of the MyelinNets Global Network properties. The Myelin‐Nets segregation topological measures are represented in panel (a). clustering index, and panel (b), local efficiency. The integration topological measures: characteristic path length and global efficiency are represented in panels (c) and (d), respectively. Panel (e) shows the global connectivity and panel (f), the connectivity strength between homologous regions. The continuous line in red represents the polynomial fitted function. The light red shaded area symbolizes the confidence interval of the polynomial fitted function, and the dark shaded area the standard deviation of the error in predicting a future observation. Dots in red and black represent the topological network property values for each “age”—taken as the median age of the participants in the window. In all cases the best fitted polynomial order, based on the AIC criterion, was n = 3, with coefficients statistically significant (p < .05) [Color figure can be viewed at http://wileyonlinelibrary.com]
Figure 12
Figure 12
Age trajectory of the normalized betweenness centrality (NBC) in the Precuneus (PCu) (panels a and b) and Posterior cingulate gyri (PCgG) (panels c and d) structures. The continuous line in red represents the polynomial fitted function. In all cases the polynomial coefficients were statistically significant (p < .05). The light red shaded area shows the confidence interval of the polynomial fit, and the dark shaded area the standard deviation of the error in predicting a future observation. Dots in red and black represent the NBC values for each “age”—taken as the median age of the participants in the particular window. Line in blue at NBC = 1.5 shows the NBC threshold for which a region is considered as hub [Color figure can be viewed at http://wileyonlinelibrary.com]
Figure 13
Figure 13
Correlation matrices associated to Myelin‐Nets for the Young Age (panel a) and Old Age (panel b) groups for the different gray matter parcellations (AAL, Neuromorphometrics, Brainnetome and Gordon atlases). In panel a (similar to all plotted correlation matrices), the “R–R” and “L–L” quadrants represent the intrahemispheric myelin correlations in the right and left hemispheres, respectively. The “R–L” and “L–R” quadrants depict the interhemispheric interactions. The diagonal of the “L–R” quadrant shows the correlations in myelination between homologous structures across hemispheres. The color bar on the right represents the scale of the Pearson correlation coefficients using a “jet” color map [Color figure can be viewed at http://wileyonlinelibrary.com]

References

    1. Achard, S. , & Bullmore, E. (2007). Efficiency and cost of economical brain functional networks. PLoS Computational Biology, 3, e17. - PMC - PubMed
    1. Achard, S. , Salvador, R. , Whitcher, B. , Suckling, J. , & Bullmore, E. (2006). A resilient, low‐frequency, small‐world human brain functional network with highly connected association cortical hubs. Journal of Neuroscience, 26, 63–72. - PMC - PubMed
    1. Alexander‐Bloch, A. , Giedd, J. N. , & Bullmore, E. (2013). Imaging structural co‐variance between human brain regions. Nature Reviews. Neuroscience, 14, 322–336. - PMC - PubMed
    1. Andrews‐Hanna, J. R. , Snyder, A. Z. , Vincent, J. L. , Lustig, C. , Head, D. , Raichle, M. E. , & Buckner, R. L. (2007). Disruption of large‐scale brain systems in advanced aging. Neuron, 56, 924–935. - PMC - PubMed
    1. Andrews, T. J. , Halpern, S. D. , & Purves, D. (1997). Correlated size variations in human visual cortex, lateral geniculate nucleus, and optic tract. Journal of Neuroscience, 17, 2859–2868. - PMC - PubMed

Publication types