. 2018 Aug;80(2):538-547.
doi: 10.1002/mrm.27052. Epub 2017 Dec 21.

Yet more evidence that myelin protons can be directly imaged with UTE sequences on a clinical 3T scanner: Bicomponent T2* analysis of native and deuterated ovine brain specimens

Affiliations

Yet more evidence that myelin protons can be directly imaged with UTE sequences on a clinical 3T scanner: Bicomponent T2* analysis of native and deuterated ovine brain specimens

Shu-Juan Fan et al. Magn Reson Med. 2018 Aug.

Abstract

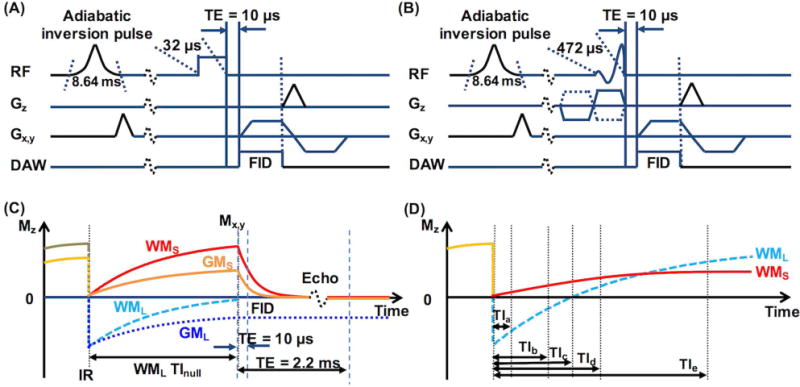
Purpose: UTE sequences with a minimal nominal TE of 8 µs have shown promise for direct imaging of myelin protons (T2 , < 1 ms). However, there is still debate about the efficiency of 2D slice-selective UTE sequences in exciting myelin protons because the half excitation pulses used in these sequences have a relatively long duration (e.g., 0.3-0.6 ms). Here, we compared UTE and inversion-recovery (IR) UTE sequences used with either hard or half excitation pulses (durations 32 µs or 472 µs, respectively) for imaging myelin in native and deuterated ovine brain at 3T.

Methods: Freshly frozen ovine brains were dissected into ∼2 mm-thick pure white matter and ∼3 to 8 mm-thick cerebral hemisphere specimens, which were imaged before and/or after different immersion time in deuterium oxide.

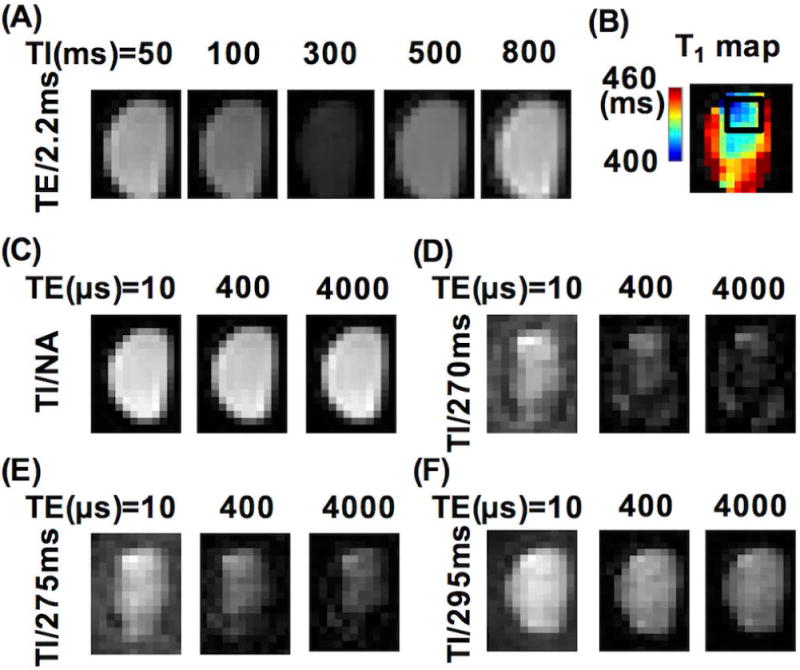
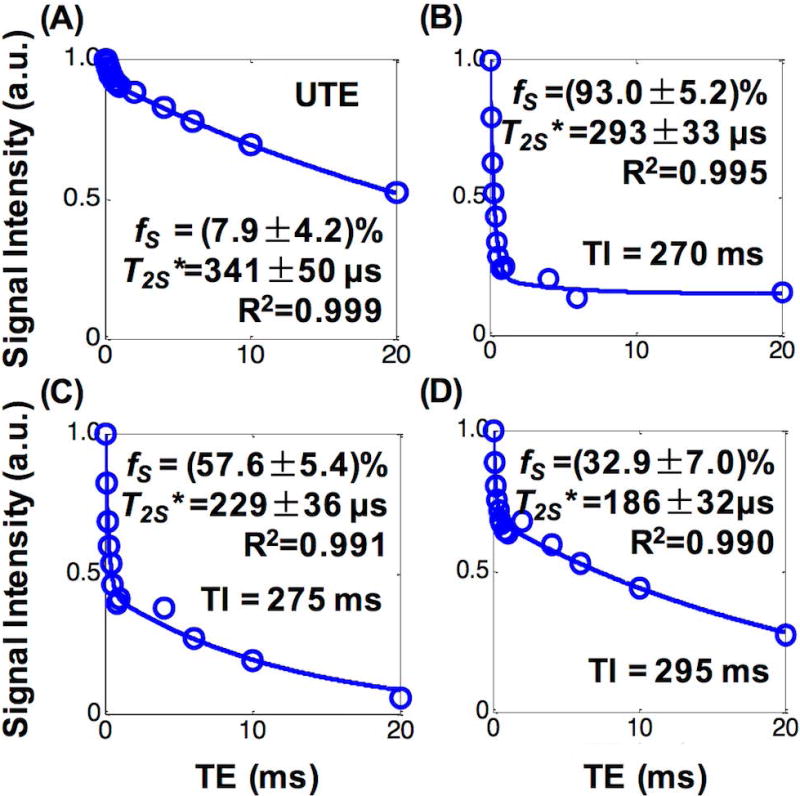
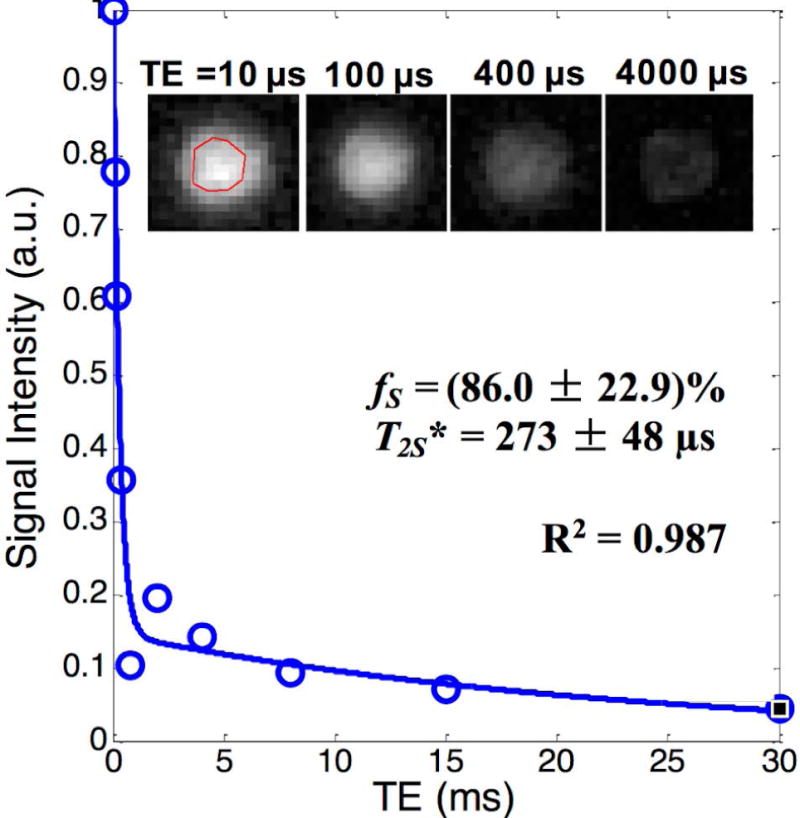
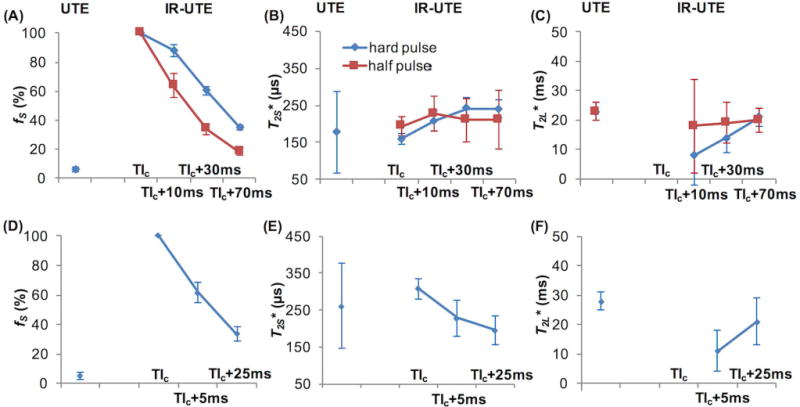
Results: Bicomponent T2* analysis of UTE signals obtained with hard excitation pulses detected an ultrashort T2 component (STC) fraction (fS ) of 0% to 10% in native specimens, and up to ∼86% in heavily deuterated specimens. fS values were significantly affected by the TIs used in IR-UTE sequences with either hard or half excitation pulses in native specimens but not in heavily deuterated specimens. The STC T2* was in the range of 150 to 400 µs in all UTE and IR-UTE measurements obtained with either hard or half excitation pulses.

Conclusion: Our results further support myelin protons as the major source of the ultrashort T2* signals seen on IR-UTE images and demonstrate the potential of IR-UTE sequences with half excitation pulses for directly imaging myelin using clinical scanners. Magn Reson Med 80:538-547, 2017. © 2017 International Society for Magnetic Resonance in Medicine.

Keywords: T2*; UTE; bicomponent; inversion recovery; myelin; white matter.


Figures

Figure 1
Figure 1
Diagrams of the 2D IR-UTE pulse sequences with a TE of 10 µs used with (A) a short hard excitation pulse (rectangular shape, duration 32 µs, bandwidth = 8.2 kHz) followed by 2D radial ramp sampling, and (B) a half excitation pulse (duration 472 µs, bandwidth = 2.7 kHz) followed by 2D radial ramp sampling. (C) Illustration of the contrast mechanism for imaging ultrashort T2 components in white matter (WMS) using IR-UTE with the inversion time (TI) set for nulling of signals from the long T2 components (WML), with the TI termed as WML TInull. In magnitude IR-UTE images, the signal in white matter quickly decays to zero with increasing TE, while the signal in grey matter is still high at TE = 2.2 ms because it is dominated by long T2 components (GML). (D) MZ of WML and WMS plotted against different TIs at the time UTE acquisition starts. At TIc, signals from WML are nulled. At TIa, which is much shorter than TIc, signal in the image is dominated by WML. At TIb, which is only slightly shorter than TIc, signal from WMS is cancelled out by that from WML. At TId and TIe, signals from WMS and WML coexist in the image but with different fractions. Note that the time parameters in the diagrams were not proportionally illustrated.
Figure 2
Figure 2
Representative magnitude images (acquired with hard excitation pulses) of one native WM short block. (A) Images obtained with varying inversion times (TIs) at TE = 2.2 ms. (B) T1 map calculated from the images in (A) showing a relatively homogeneous center and a rim with a slightly longer T1. The black box shows the region of interest (ROI) used for quantitative T2* analyses. (C) Images obtained with different TEs and without inversion recovery preparation (labeled as ‘TI/NA (not applicable)’). (D-F) Images obtained with different TEs and varying TIs. There was an obvious signal intensity decrease with the increase of TE in the images at TIs = 270 ms and 275 ms, but not at TI = 295 ms.
Figure 3
Figure 3
Representative bi-component T2* fitting curves of one native WM short block. (A) Measurement with hard excitation pulses and no IR preparation. (B-D) Measurements with hard excitation pulses and varying TIs. All measurements provided different ultrashort T2 component fractions (fS) but similar T2* (T2S*) values.
Figure 4
Figure 4
Bi-component T2* analysis of images acquired with hard excitation pulse and no IR preparation from a WM short block after a 27-hr 4-pass D2O exchange, showing a much higher ultrashort T2 component fraction with similar T2* (i.e., fS and T2S*) compared with a native WM short block shown as in Fig.3A. Inserts are the images of the WM short block after 27-hr D2O exchange which showed fast signal decay with the increase in TE.
Figure 5
Figure 5
T2* fitting results from the ~8-mm thick hemisphere slab imaged using both hard and half excitation pulse sequences (A–C) and the average results from three pure white matter short blocks imaged using hard excitation pulse sequence (D–F). IR-UTE images were acquired with TI = WML TInull (labeled as TIc, equivalent to that in Fig. 1D, on the x-axes of the figures) and 5-70 ms longer. The ultrashort T2 component fraction (fS) was very low when measured with UTE (<10%), much higher when measured with IR-UTE at WML TInull, and decreased as TI increased from WML TInull. The UTE sequence used with half pulse excitation did not detect the ultrashort T2 component in this native specimen. fS was consistently lower when measured with half pulse excitation than with hard pulse excitation at various TIs greater than WML TInull (A&D). The ultrashort T2 component T2* (T2S*) values were all in the range of 150 – 250 µs (B&E), and the long T2 component T2* (T2L*) changed significantly with the increase in TI when hard pulse excitation was used (C&F). At WML TInull, the T2* signal followed a single component decay (R2 > 0.99) (F). These results demonstrated the efficiency of the half pulse UTE and IR-UTE sequences in measuring T2S* and detecting fS changes in the presence of different proportions of LTC signals.
Figure 6
Figure 6
T2* fitting curves of UTE and IR-UTE signals (all half excitation pulses) from three pure white matter long segments that were subject to 1-hr (left column, No.1), 2-hr (middle column, No.2) and 27-hr (right column, No.3) exchange with D2O, respectively. (A) The UTE sequence detected an increase of fS from ~9.5% to ~47.1% with D2O exchange time in specimens No.1 to No.3. (B) The IR-UTE images obtained at WML TInull showed single component T2* signal decay, which changed little with D2O exchange time. (C) The IR-UTE images obtained at 85 ms longer than WML TInull (labled as “WML TInull + 85 ms” in figure) showed bi-component T2* signal decays in specimens after 1-hr and 2-hr D2O exchange, and single component T2* signal decay in the specimen after 27-hr D2O exchange. fS, ultrashort T2 component fraction; T2S*, ultrashort T2 component T2*.

References

    1. Laule C, Vavasour IM, Kolind SH, Li DK, Traboulsee TL, Moore GR, MacKay AL. Magnetic resonance imaging of myelin. Neurotherapeutics. 2007;4(3):460–484. - PMC - PubMed
    1. Alexander AL, Hurley SA, Samsonov AA, Adluru N, Hosseinbor AP, Mossahebi P, Tromp do PM, Zakszewski E, Field AS. Characterization of cerebral white matter properties using quantitative magnetic resonance imaging stains. Brain Connect. 2011;1(6):423–446. - PMC - PubMed
    1. Montagne A, Barnes SR, Sweeney MD, Halliday MR, Sagare AP, Zhao Z, Toga AW, Jacobs RE, Liu CY, Amezcua L, Harrington MG, Chui HC, Law M, Zlokovic BV. Blood-brain barrier breakdown in the aging human hippocampus. Neuron. 2015;85(2):296–302. - PMC - PubMed
    1. Wardlaw JM, Farrall A, Armitage PA, Carpenter T, Chappell F, Doubal F, Chowdhury D, Cvoro V, Dennis MS. Changes in background blood-brain barrier integrity between lacunar and cortical ischemic stroke subtypes. Stroke. 2008;39(4):1327–1332. - PubMed
    1. Starr JM, Farrall AJ, Armitage P, McGurn B, Wardlaw J. Blood-brain barrier permeability in Alzheimer’s disease: a case-control MRI study. Psychiatry Res. 2009;171(3):232–241. - PubMed

Publication types