Factors influencing accuracy of cortical thickness in the diagnosis of Alzheimer's disease
- PMID: 29271096
- PMCID: PMC5897897
- DOI: 10.1002/hbm.23922
Factors influencing accuracy of cortical thickness in the diagnosis of Alzheimer's disease
Abstract
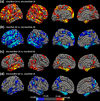
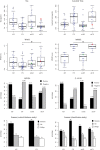
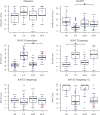
There is great value to use of structural neuroimaging in the assessment of Alzheimer's disease (AD). However, to date, predictive value of structural imaging tend to range between 80% and 90% in accuracy and it is unclear why this is the case given that structural imaging should parallel the pathologic processes of AD. There is a possibility that clinical misdiagnosis relative to the gold standard pathologic diagnosis and/or additional brain pathologies are confounding factors contributing to reduced structural imaging classification accuracy. We examined potential factors contributing to misclassification of individuals with clinically diagnosed AD purely from cortical thickness measures. Correctly classified and incorrectly classified groups were compared across a range of demographic, biological, and neuropsychological data including cerebrospinal fluid biomarkers, amyloid imaging, white matter hyperintensity (WMH) volume, cognitive, and genetic factors. Individual subject analyses suggested that at least a portion of the control individuals misclassified as AD from structural imaging additionally harbor substantial AD biomarker pathology and risk, yet are relatively resistant to cognitive symptoms, likely due to "cognitive reserve," and therefore clinically unimpaired. In contrast, certain clinical control individuals misclassified as AD from cortical thickness had increased WMH volume relative to other controls in the sample, suggesting that vascular conditions may contribute to classification accuracy from cortical thickness measures. These results provide examples of factors that contribute to the accuracy of structural imaging in predicting a clinical diagnosis of AD, and provide important information about considerations for future work aimed at optimizing structural based diagnostic classifiers for AD.
Keywords: Alzheimer's disease; cortical thickness; magnetic resonance imaging; support vector machines; white matter hyperintensity.
© 2017 Wiley Periodicals, Inc.
Figures


References
-
- Aguilar, C. , Westman, E. , Muehlboeck, J.‐S. , Mecocci, P. , Vellas, B. , Tsolaki, M. , … Wahlund, L.‐O. (2013). Different multivariate techniques for automated classification of MRI data in Alzheimer's disease and mild cognitive impairment. Psychiatry Research, 212, 89–98. 10.1016/j.pscychresns.2012.11.005 - DOI - PubMed
-
- Arnold, S. E. , Hyman, B. T. , Flory, J. , Damasio, A. R. , & Van Hoesen, G. W. (1991). The topographical and neuroanatomical distribution of neurofibrillary tangles and neuritic plaques in the cerebral cortex of patients with Alzheimer's disease. Cerebral Cortex, 1, 103–116. - PubMed
Publication types
MeSH terms
Grants and funding
LinkOut - more resources
Full Text Sources
Other Literature Sources
Medical

