. 2017 Dec 22;13(12):e1007143.
doi: 10.1371/journal.pgen.1007143. eCollection 2017 Dec.

Parallel evolution of the POQR prolyl oligo peptidase gene conferring plant quantitative disease resistance

Affiliations

Parallel evolution of the POQR prolyl oligo peptidase gene conferring plant quantitative disease resistance

Thomas Badet et al. PLoS Genet. .

Abstract

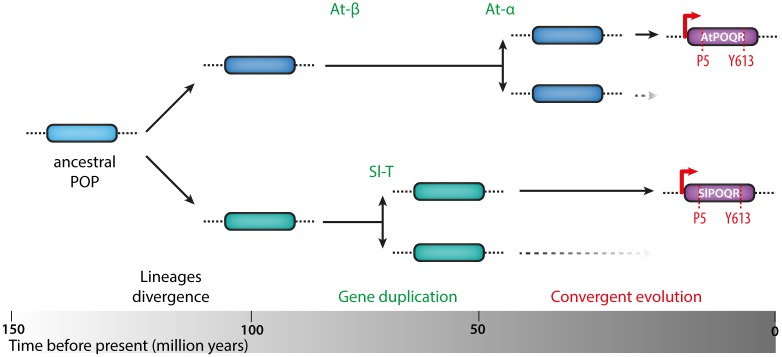
Plant pathogens with a broad host range are able to infect plant lineages that diverged over 100 million years ago. They exert similar and recurring constraints on the evolution of unrelated plant populations. Plants generally respond with quantitative disease resistance (QDR), a form of immunity relying on complex genetic determinants. In most cases, the molecular determinants of QDR and how they evolve is unknown. Here we identify in Arabidopsis thaliana a gene mediating QDR against Sclerotinia sclerotiorum, agent of the white mold disease, and provide evidence of its convergent evolution in multiple plant species. Using genome wide association mapping in A. thaliana, we associated the gene encoding the POQR prolyl-oligopeptidase with QDR against S. sclerotiorum. Loss of this gene compromised QDR against S. sclerotiorum but not against a bacterial pathogen. Natural diversity analysis associated POQR sequence with QDR. Remarkably, the same amino acid changes occurred after independent duplications of POQR in ancestors of multiple plant species, including A. thaliana and tomato. Genome-scale expression analyses revealed that parallel divergence in gene expression upon S. sclerotiorum infection is a frequent pattern in genes, such as POQR, that duplicated both in A. thaliana and tomato. Our study identifies a previously uncharacterized gene mediating QDR against S. sclerotiorum. It shows that some QDR determinants are conserved in distantly related plants and have emerged through the repeated use of similar genetic polymorphisms at different evolutionary time scales.


Conflict of interest statement

The authors have declared that no competing interests exist.

Figures

Fig 1
Fig 1. Genome wide association mapping in a European A. thaliana population associates At1g20380 with quantitative disease resistance against S. sclerotiorum.
(A) Distribution of disease severity index (DSI) at 6 days after inoculation by S. sclerotiorum in 84 A. thaliana European accessions. Values shown are averages for 6 to 16 plants per genotype, with error bars showing standard deviation. Points are colored from blue to red according to average DSI. (B) Geographic origin of the accessions used in this work, in relation with their average DSI (same color code as in A). Points are sized according to DSI standard deviation. (C) Manhattan plot of GWAS results for DSI after S. sclerotiorum inoculation. Dotted green lines show false discovery rate thresholds, the red line show the position of the POQR locus. Chr., chromosome. (D) Close-up of the major association peak centered on POQR locus. Only SNPs with association score greater than 1.25 are shown.
Fig 2
Fig 2. POQR confers enhanced quantitative disease resistance against S. sclerotiorum.
(A) Representative pictures of area colonized by S. sclerotiorum expressing GFP, 24 hours after inoculation. Bar = 2.5 mm. (B) Measure of leaf area colonized by S. sclerotiorum 24 hours after inoculation. Values are shown for n = 7 to 17 individual plants per genotype from two independent biological experiments. Significance of the difference from Col-0 was assessed by a Student’s t test with Benjamini-Hochberg correction for multiple testing (p-values indicated above boxes). (C) Pictures of representative symptoms on A. thaliana leaves 10 days after inoculation by X. campestris pv. campestris. (D) Proportion of plants presenting a disease severity index of 1, 2, 3 or 4 at 10 days after inoculation (dpi) by X. campestris pv. campestris. Counts from n = 32 to 48 individual plants per genotype from three independent biological experiments.
Fig 3
Fig 3. Natural diversity at POQR locus in A. thaliana associates sequence and expression polymorphism with QDR.
(A) Distribution of disease severity index for accessions harboring either a C or a T at position 7061677 of chromosome 1, corresponding respectively to a proline or serine at POQR amino acid position 5 (*** Student’s t test p-value<0.01). (B) Maximum likelihood phylogenetic tree of POQR protein sequences in 46 A. thaliana accessions. Identical sequences were collapsed; nodes are sized proportionally to the number of accessions with identical POQR isoform, and colored according to the average disease severity index after S. sclerotiorum inoculation, indicated at the center of each node. Nodes are labeled with accessions forming the corresponding group. Portions of the network corresponding to clades A, S and R are highlighted with colored background. Branches carrying POQR isoforms with a proline at position 5 are shown as bold dotted lines. Support corresponding to an SH-like approximate likelihood-ratio test is shown for major branches. (C) Distribution of disease severity index 6 days after S. sclerotiorum inoculation in major POQR clades (*** Student’s t test p-value<0.01).
Fig 4
Fig 4. Parallel sequence evolution of POQR homologs in multiple plant lineages.
(A) Maximum likelihood phylogenetic tree including the 75 best POQR homologs from 40 plant species. Terminal nodes are colored and labeled according to plant species, following the legend shown around the tree. Species belonging to a genus for which S. sclerotiorum infection has not been reported are shown with dotted nodes and labeled in grey (data from https://nt.ars-grin.gov/fungaldatabases/). Support corresponding to an SH-like approximate likelihood-ratio test is shown for major branches. Branches are colored according to amino acid in position 5 of POQR sequences. POQR homologs from Sphagnum fallax, Arabidopsis thaliana, Solanum lycopersicum, Salix purpurea and Oryza sativa are labeled with corresponding identifiers from the Phytozome database. (B) Multiple sequence alignment of POQR homologs from Sphagnum fallax, Arabidopsis thaliana, Solanum lycopersicum, Salix purpurea and Oryza sativa showing diversity at position 5 (triangle) and conservation of the catalytic triad (stars). (C) Measure of leaf area colonized by S. sclerotiorum 24 hours after inoculation in wild type tomato plants, plants silenced for POQR by virus induced gene silencing (VIGS) and plants carrying the empty viral vector (e.v.). Values are shown for n = 16 individual plants per genotype from two independent biological experiments. Significance of the difference from wild type was assessed by a Student’s t test with Benjamini-Hochberg correction for multiple testing (p-values indicated above boxes).
Fig 5
Fig 5. Parallel evolution of POQR gene induction upon S. sclerotiorum infection in A. thaliana and S. lycopersicum.
(A) Maximum likelihood phylogenetic tree of A. thaliana (green) and S. lycopersicum (purple) prolyl-oligopeptidase (POP) family. Support corresponding to an SH-like approximate likelihood-ratio test is shown for major branches. Stars indicate gene duplication events. (B) Expression of A. thaliana and S. lycopersicum POP genes upon inoculation by S. sclerotiorum. Values show average log2 fold change (LFC) compared to mock-treated plants from three independent biological replicates, error bars show s.e.m. (C) Distribution of duplicated gene pairs according to their difference in LFC. Distribution is shown for duplicated gene pairs from A. thaliana (green, 1083 pairs) and genes duplicated both in A. thaliana and S. lycopersicum (red, 216 pairs of pairs). (D) Distribution of 21 clusters of gene duplicated both in A. thaliana and S. lycopersicum according to the delta LFC in A. thaliana gene pair (X-axis) and S. lycopersicum gene pair (Y-axis). The color code shows median of the two highest LFCs in a cluster. Labels refer to clusters commented in the text.
Fig 6
Fig 6. A model for convergent evolution of the POQR gene in A. thaliana and S. lycopersicum.
Our analyses suggest that a single POQR ancestral gene was inherited by A. thaliana and S. lycopersicum ancestors when lineages diverged, about 120 million years ago (Mya). The ancestral POQR gene then duplicated in parallel in A. thaliana lineage between 88 and 44 Mya (At-β and At-α events) and S. lycopersicum lineage about 64 Mya (Sl-T event). After duplication, POQR ancestral genes underwent parallel amino acid substitutions, notably leading to the emergence of proline 5 (P5) and tyrosine 613 (Y613), and parallel gain or gene induction upon S. sclerotiorum infection (red arrow) in A. thalina and S. lycopersicum lineages.

References

    1. Dodds PN, Rathjen JP (2010) Plant immunity: towards an integrated view of plant–pathogen interactions. Nature Reviews Genetics 11: 539–548. doi: 10.1038/nrg2812 - DOI - PubMed
    1. Takken FL, Goverse A (2012) How to build a pathogen detector: structural basis of NB-LRR function. Current opinion in plant biology 15: 375–384. doi: 10.1016/j.pbi.2012.05.001 - DOI - PubMed
    1. Le Roux C, Huet G, Jauneau A, Camborde L, Trémousaygue D, et al. (2015) A receptor pair with an integrated decoy converts pathogen disabling of transcription factors to immunity. Cell 161: 1074–1088. doi: 10.1016/j.cell.2015.04.025 - DOI - PubMed
    1. Poland JA, Balint-Kurti PJ, Wisser RJ, Pratt RC, Nelson RJ (2009) Shades of gray: the world of quantitative disease resistance. Trends in plant science 14: 21–29. doi: 10.1016/j.tplants.2008.10.006 - DOI - PubMed
    1. Roux F, Voisin D, Badet T, Balagué C, Barlet X, et al. (2014) Resistance to phytopathogens e tutti quanti: placing plant quantitative disease resistance on the map. Molecular Plant Pathology 15: 427–432. doi: 10.1111/mpp.12138 - DOI - PMC - PubMed

Publication types

MeSH terms