Comparative Study
. 2018 Apr 1;35(4):837-854.
doi: 10.1093/molbev/msx326.

Complex Relationships between Chromatin Accessibility, Sequence Divergence, and Gene Expression in Arabidopsis thaliana

Affiliations
Comparative Study

Complex Relationships between Chromatin Accessibility, Sequence Divergence, and Gene Expression in Arabidopsis thaliana

Cristina M Alexandre et al. Mol Biol Evol. .

Erratum in

Abstract

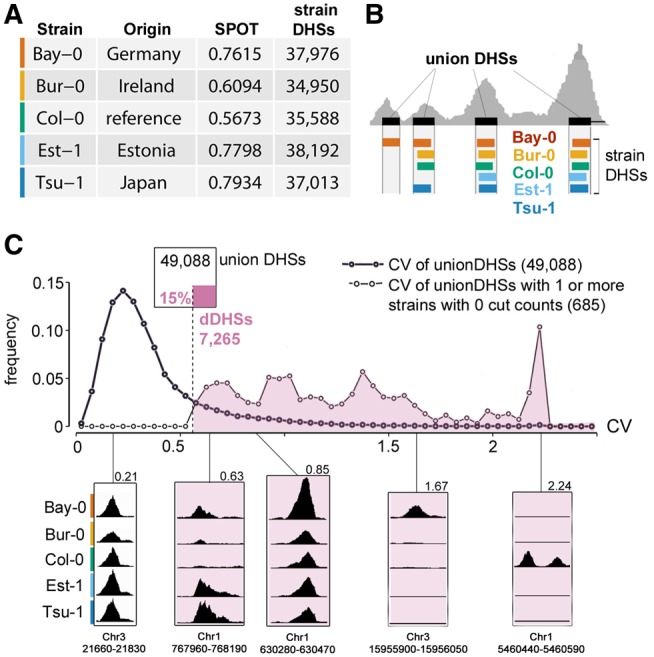
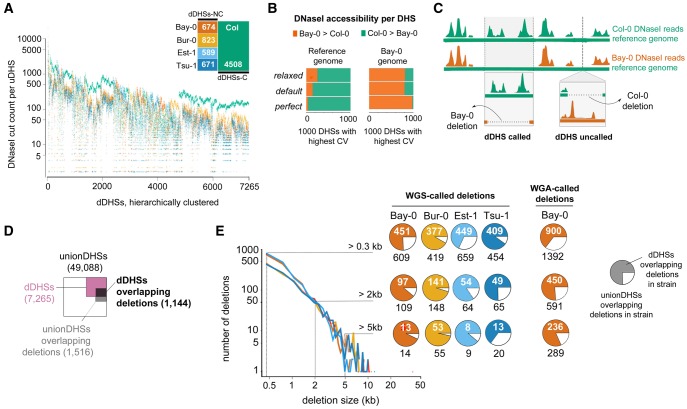
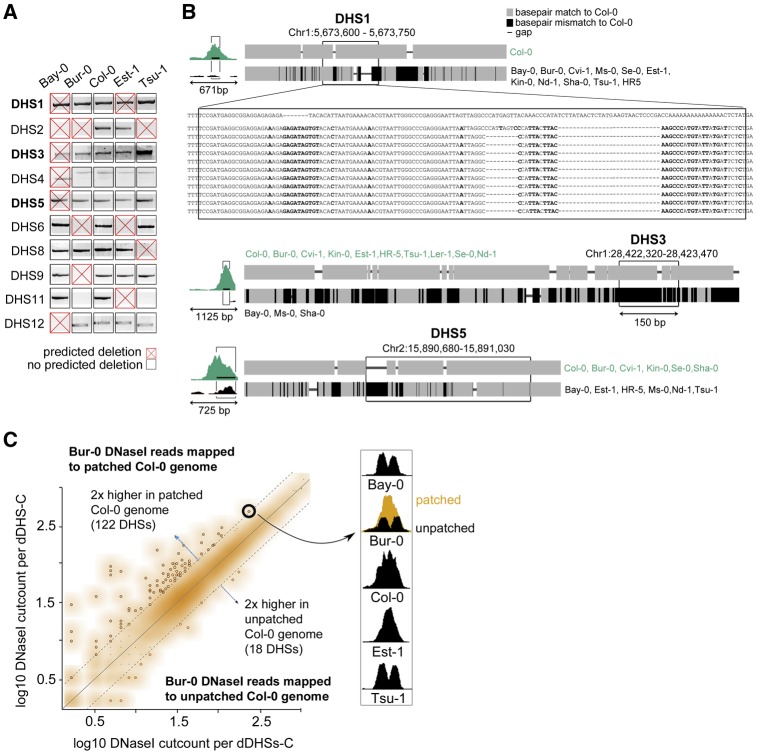
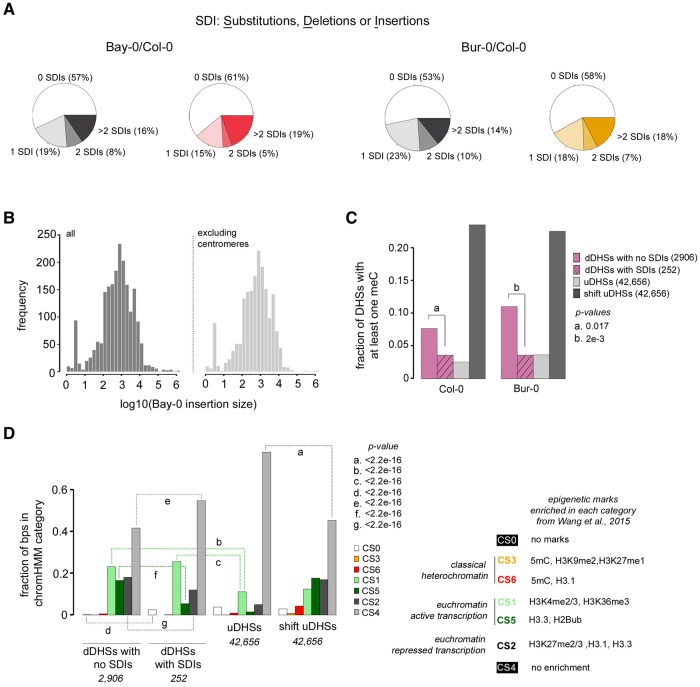
Variation in regulatory DNA is thought to drive phenotypic variation, evolution, and disease. Prior studies of regulatory DNA and transcription factors across animal species highlighted a fundamental conundrum: Transcription factor binding domains and cognate binding sites are conserved, while regulatory DNA sequences are not. It remains unclear how conserved transcription factors and dynamic regulatory sites produce conserved expression patterns across species. Here, we explore regulatory DNA variation and its functional consequences within Arabidopsis thaliana, using chromatin accessibility to delineate regulatory DNA genome-wide. Unlike in previous cross-species comparisons, the positional homology of regulatory DNA is maintained among A. thaliana ecotypes and less nucleotide divergence has occurred. Of the ∼50,000 regulatory sites in A. thaliana, we found that 15% varied in accessibility among ecotypes. Some of these accessibility differences were associated with extensive, previously unannotated sequence variation, encompassing many deletions and ancient hypervariable alleles. Unexpectedly, for the majority of such regulatory sites, nearby gene expression was unaffected. Nevertheless, regulatory sites with high levels of sequence variation and differential chromatin accessibility were the most likely to be associated with differential gene expression. Finally, and most surprising, we found that the vast majority of differentially accessible sites show no underlying sequence variation. We argue that these surprising results highlight the necessity to consider higher-order regulatory context in evaluating regulatory variation and predicting its phenotypic consequences.


Figures

<sc>Fig</sc>. 1.
Fig. 1.
Identifying regions of differential chromatin accessibility among five A. thaliana ecotypes. (A) Data and data quality for the five ecotypes examined. SPOT score, a metric of data quality, describes fraction of cuts within hotspots (Sullivan et al. 2015). Colors indicate specific ecotypes throughout manuscript (palette is colorblind-accessible [Wong 2011]; Bay-0, vermillion; Bur-0, orange; Col-0, bluish green; Est-1, sky blue; Tsu-1, blue). (B) Schematic depiction of deriving uDHSs for subsequent analysis. (C) Distribution of CV among uDHSs (bold line). Distribution of CV among the subset of uDHSs for which at least one ecotype has no cut counts (lighter line). A CV threshold of 0.56 (dashed line) was chosen to include all uDHSs in the latter category. This approach categorized 15% of all uDHSs as differentially accessible (see inset diagram, dDHSs in reddish-purple). See supplementary figure S2, Supplementary Material online, for further details on the rationale for CV as a metric for identifying dDHSs. Examples of individual uDHSs with respective chromosome coordinates and CVs are shown below CV distribution.
<sc>Fig</sc>. 2.
Fig. 2.
Structural variation contributes to profound reference bias and explains a sizable minority of differential DHSs. (A) DNase I-cut counts for each of 7,265 dDHS across all five ecotypes (color-coded dots, see inset) are shown. dDHSs are displayed hierarchically clustered with each column representing a given DHS. dDHSs in which the reference Col-0 (green) shows more cut counts than any of the other ecotypes (dDHSs-C) are most common. (B) The reference bias in (A) arises through use of the Col-0 reference genome for DNase I read alignment. Two different reference genomes, Col-0 (green, top) and Bay-0 (vermillion, bottom), were compared for alignment at different stringencies. Replacing the Col-0 reference genome with the Bay-0 draft genome for read alignments, resulted in a Bay-0 specific bias, that is, now the majority of dDHSs was most accessible in Bay-0. The 1000 dDHSs with the highest CV were used for analysis. Requiring perfect alignment (no mismatches) between DNase I read and reference genome enhanced this effect, while relaxing alignment parameters dampened this effect in the Sanger-sequenced Col-0 genome. (see Materials and Methods for details). (C) Schematic outlining the consequences of missing sequence in Col-0, the reference ecotype, versus missing sequence in a nonCol-0 ecotype for bias in calling dDHSs. In our analysis, DNase I reads from each ecotype were aligned to the Col-0 reference sequence (depicted by green horizontal bar). If a Col-0 sequence corresponding to a DHS was missing in Bay-0, this DHS would appear inaccessible in Bay-0 and called as a dDHS-C (i.e., most accessible in Col-0). However if a Bay-0 sequence corresponding to a DHS was missing in Col-0, the DHS would not be included in the uDHS set and not be counted as a dDHS-NC (i.e., most accessible in a nonCol-0 ecotype). (D) Overlap between WGS-called deletions, uDHSs and dDHSs shows that differential DHSs are enriched for ecotype-specific deletions; areas are proportional to the size of each category. (E) Size distribution of WGS sequence-called deletions in each ecotype was similar, with few deletions over 20 kb. Pie charts indicate the fraction of uDHSs overlapping ecotype-specific WGS-called deletions of various minimum sizes that were characterized as differential DHSs (see adjacent key). For comparison, see the fraction of uDHSs overlapping Bay-0 deletions of various minimum sizes called by WGA (whole-genome alignment) of the Bay-0 draft genome to the Col-0 reference genome (see Materials and Methods).
<sc>Fig</sc>. 3.
Fig. 3.
Hypervariable sequence coinciding with DHSs poses a challenge for sequence alignment but does not significantly contribute to reference bias. (A) PCR confirmed seven out of ten predicted deletions in at least one ecotype through decreased size or absence of diagnostic PCR product. Predicted deletions are denoted as red X. In some instances, ecotypes carried a deletion that was not predicted (black box, DHS9 in Bur-0 and Tsu-1, false negatives). (B) For the three wrongly predicted deletions coinciding with DHS1, DHS3, and DHS5, Sanger-sequenced PCR-products from 12 A. thaliana ecotypes revealed that ecotypes carried either a homozygous Col-like sequence allele or a homozygous nonCol-like allele with dramatically different sequence but approximately equal length. Alignments are represented as thumbnails, Col-like sequence in gray and mismatches to Col-0 in black. Col-0 coordinates for these three hypervariable loci are Chr1: 5,673,357–5,674,171; Chr1: 28,422,395–28,423,622; and Chr2: 15,890,369–15,891,184, respectively. For DHS1, the base pair resolution multiple sequence alignment is shown. For full base pair resolution multiple alignments of DHS1, DHS3 and DHS5, see supplementary figure S5AC, Supplementary Material online. (C) Scatterplot of Bur-0 DNase I reads aligned to either patched or unpatched Col-0 sequence. The patched Col-0 genome was generated by replacing DHS-sequences with locally-assembled sequence from Bur-0 WGS reads (see Materials and Methods). Dotted lines indicate 2-fold higher cut counts for respective DHSs with either patched or unpatched genome. The majority of DHSs was not affected (orange cloud). At right, an example of false positive differential DHS for which patching resulted in higher numbers of aligned DNase I reads such that “patched” cut count approximated that of the Col-0 DHS. The similarity of DHS pattern between Bur-0, Bay-0 and Tsu-1 suggests that the differential DHS in the two latter ecotypes is also a false positive due to sequence hypervariability.
<sc>Fig</sc>. 4.
Fig. 4.
DHSs alleles with high sequence divergence tend to reside near genes with different expression levels. (A) Fraction of DHSs residing within 5 kb of a differentially expressed gene by DHS sets in a pairwise comparison of Col-0 and Bur-0 (deleted DHSs = del DHSs; hypervariable differentially accessible DHSs = hyp/d DHSs; hypervariable nondifferentially accessible DHSs = hyp/nd DHSs; differentially accessible DHSs = d DHSs; Col-0/Bur-0 uDHSs = uCB DHSs). DHSs were subsampled to sets of 50 to allow comparisons among the examined DHSs sets, which occurred at vastly different frequency (see Materials and Methods). (B) For the three previously-identified hypDHSs (DHS1, DHS3, and DHS5, see fig. 3A and B), the DHS-allele (Col-like C-allele in green, nonCol-like NC-allele in black) determined by Sanger-sequencing predicted the expression level of a neighboring gene in eleven ecotypes with publicly available expression data (Lempe et al. 2005) with one exception (Ms-0 in DHS5, red dot). At left, screenshots showing altered DHS accessibility at these sites (see also fig. 3B); at right, gene expression (as log2(intensity ratio), Lempe et al. 2005) for ecotypes carrying either the DHS C-allele (green) or the DHS NC-allele (black). For DHS1 (At1G116590), we also show expression for Bur-0 (orange) compared with Col-0 (green) from Gan et al. (2011).
<sc>Fig</sc>. 5.
Fig. 5.
Altered DHS accessibility among ecotypes may have condition-dependent effects on expression of nearby genes. (A, Top) A DHS deletion (black box) in Bur-0 neighbors one gene with similar expression in Bur-0 (orange) and Col-0 (green, expressed in FPKM) (Gan et al. 2011) and one gene with vastly different expressions in Bur-0 and Col-0 (blue shading). (A, Bottom) A DHS deletion in Bur-0 (denoted as above) neighbors two genes with similar expression levels in Bur-0 and Col-0. (B) On average, genes with differential expression in response to heat-shock, dark-to-light transition, brassinosteroid treatment of dark-grown seedlings, and auxin treatment are flanked by significantly more DHSs than all genes (e.g., on average, ∼3 DHSs reside 5 kb upstream of a gene). P values of t-tests comparing (1) mean number of DHSs in specified region for genes with differing expression at test versus control conditions to (2) mean number of DHSs for genes with similar expression at both conditions (a) (5 kb upstream; 1.5 kb downstream), (b) (<2.2e-16; 3.6e-13), (c) (<2.2e-16; <2.2e-16), (d) (<2.2e-16; <2.2e-16), (e) (2.7e-10; 1.6e-09. (C, Left) Gel images confirming DHS deletions near genes annotated as conditionally-expressed. The first example represents an insertion in Bur-0 rather than a deletion. (C, Right) Evidence of ecotype-specific conditional expression (highlighted in blue are the largest significant differences measured, with effect size indicated in bold and P-value of difference [paired t-test] in italics) associated with a DHS deletion or insertion near AT1G50460, AT2G16280, and AT5G54470. cDNA preparations of Bur-0/Col-0 pairs with substantially higher levels of gene expression, presumably due to some batch effect, are given as filled circles. (D, Top Left) DNase I screenshot for the region containing AT5G54470 in Col-0 and Bur-0. (D, Top Right) Schematic alignment of the 2,138-bp region upstream of AT5G54470 (Chr5: 22,115,538–22,117,675). Boxes denote DHSs. (D, Bottom) Base pair alignment of a 348-bp window (Chr5: 22,115,738–22,116,085) containing the second and most accessible DHS upstream of AT5G54470. TF binding motifs are underlined in blue and indels and/or mismatches between Col-0 and Bur-0 (bold letters) are indicated. Various combinations of these motifs are required for response to cold (Mikkelsen and Thomashow 2009). PhastCons scores were taken from (Zheng et al. 2010; Li et al. 2012).
<sc>Fig</sc>. 6.
Fig. 6.
Most differential DHSs are not explained by sequence divergence. (A) Total single nucleotide SDIs per DHS between Bay-0 and Col-0 were derived from whole genome alignment of the Bay-0 draft genome sequence and Col-0 reference genome sequence (see Materials and Methods). The majority of DHSs have zero SDI. Left, comparison between Bay-0 and Col-0, shades of gray, uDHSs; shades of red, differential DHSs; Right, comparison between Bur-0 and Col-0, shades of gray, uDHSs; shades of orange, differential DHSs (B) Histogram of Bay-0 insertion sizes over the entire genome (left), and excluding the centromere (right). (C) The fraction of DHSs of different types that contain at least one meC in the Col-0 genome (left) and Bur-0 genome (right). P-values for important comparisons (a and b) are displayed. (D) The fraction of base pairs within DHSs of different types in chromatin states (CS0-CS6), as defined by Wang et al. (2015). P-values for important comparisons (a–g) are displayed to the right. All P-values in (C) and (D) were calculated using a proportions test (prop.test).

References

    1. 1001 Genomes Consortium. 2016. 1,135 genomes reveal the global pattern of polymorphism in Arabidopsis thaliana. Cell 1662:481–491.10.1016/j.cell.2016.05.063 - DOI - PMC - PubMed
    1. Anders S, Huber W.. 2010. Differential expression analysis for sequence count data. Genome Biol. 1110:R106.. - PMC - PubMed
    1. Arnold CD, Gerlach D, Stelzer C, Boryń ŁM, Rath M, Stark A.. 2013. Genome-wide quantitative enhancer activity maps identified by STARR-seq. Science 3396123:1074–1077. - PubMed
    1. Beadle George W. 1972. The Mystery of Maize. In Joyce Zibro, editor. Field Museum of Natural History Bulletin, p. 212–221.
    1. Bläsing OE, Gibon Y, Günther M, Höhne M, Morcuende R, Osuna D, Thimm O, Usadel B, Scheible W-R, Stitt M.. 2005. Sugars and circadian regulation make major contributions to the global regulation of diurnal gene expression in Arabidopsis. Plant Cell 1712:3257–3281. - PMC - PubMed

Publication types

Substances

LinkOut - more resources