. 2017 Dec 21;68(6):1023-1037.e15.
doi: 10.1016/j.molcel.2017.11.030.

Genomic and Proteomic Resolution of Heterochromatin and Its Restriction of Alternate Fate Genes

Affiliations

Genomic and Proteomic Resolution of Heterochromatin and Its Restriction of Alternate Fate Genes

Justin S Becker et al. Mol Cell. .

Abstract

Heterochromatin is integral to cell identity maintenance by impeding the activation of genes for alternate cell fates. Heterochromatic regions are associated with histone 3 lysine 9 trimethylation (H3K9me3) or H3K27me3, but these modifications are also found in euchromatic regions that permit transcription. We discovered that resistance to sonication is a reliable indicator of the heterochromatin state, and we developed a biophysical method (gradient-seq) to discriminate subtypes of H3K9me3 and H3K27me3 domains in sonication-resistant heterochromatin (srHC) versus euchromatin. These classifications are more accurate than the histone marks alone in predicting transcriptional silence and resistance of alternate fate genes to activation during direct cell conversion. Our proteomics of H3K9me3-marked srHC and functional screens revealed diverse proteins, including RBMX and RBMXL1, that impede gene induction during cellular reprogramming. Isolation of srHC with gradient-seq provides a genome-wide map of chromatin structure, elucidating subtypes of repressed domains that are uniquely predictive of diverse other chromatin properties.

Keywords: DBRs; H3K27me3; H3K9me3; chromatin organization; gene repression; gradient-seq; heterochromatin; hiHep; proteomics; reprogramming.


Figures

Figure 1
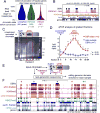
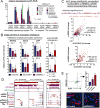
Figure 1. H3K9me3-marked heterochromatin impedes direct reprogramming and is resistant to sonication
(A) Violin plots showing levels of gene activation during hiHep reprogramming. Microarray data (Huang et al., 2014) was filtered for genes silent in fibroblasts and expressed in cultured hepatocytes. These genes were classified by whether they overlapped at least 50% with fibroblast H3K9me3 or H3K27me3 domains (Table S1; ChIP-seq from GSE16368). RNA levels in hiHep cells (n=3) were plotted on a relative scale ranging from fibroblast levels (0%) to hepatocyte levels (100%), using log2-transformed values. White circles indicate median values. P values by Wilcoxon rank sum test, compared to unmarked genes. (B) Differentially Bound Regions (DBRs, black bars) (Soufi et al., 2012) compared to H3K9me3 ChIP-seq in IMR90 fibroblasts (GSM469974) with and without input-subtraction (GSM521926). Red arrows: depletion in input signal. (C) Agarose gel of purified DNA isolated from sucrose gradient, after loading with crosslinked, sonicated chromatin from BJ fibroblasts. Boxes indicate fractions pooled in later analyses. (D) qPCR on sucrose gradient fractions (as in C), with equal DNA loading per PCR, using validated qPCR sites in DBR and non-DBR chromatin (Soufi et al., 2012) (see text and STAR Methods). Error bars: SEM, two biological replicates. (E) Diagram of samples used for DNA sequencing. (F) Browser view of sequencing signal for srHC and euchromatin (“euchr.”) fractions compared to histone mark ChIP-seq and mRNA-seq. “srHC+H3K9me3” denotes H3K9me3 IP performed from srHC fraction. H3K27me3 data from GSE16368 (n=3); all other data generated in this study (n=2 per track, average shown). Horizontal bars above each track indicate domains enriched in that sample. Arrows: srHC domains marked by H3K9me3 alone (black), H3K27me3 alone (green), or both marks (red). See also Figure S1.
Figure 2
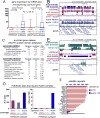
Figure 2. Gradient-seq maps the H3K9me3- and H3K27me3-marked forms of repressive heterochromatin
(A) Spearman correlation and unsupervised clustering of ChIP- and Gradient-seq datasets, using input-normalized tag density per 10-kb sliding window. Data from the Epigenomics Roadmap is labeled with “(R)”. (B) ChIP-seq levels for fibroblast histone marks (Bernstein et al., 2010; Chandra et al., 2012), normalized for input, plotted over the width of srHC domains (average of 28,807 domains weighted by domain length). An additional 15 acetyl marks depleted in srHC (see STAR Methods) are not shown. (C) Overlap of H3K9me3 and H3K27me3 domains with chromatin categories defined by Gradient-seq. (D) Fibroblast mRNA-seq tag counts, normalized by DESeq2 and divided by gene length, for genes in each chromatin category (whiskers: 5th and 95th percentiles). (E) Top 15 non-redundant Gene Ontology categories of Refseq genes inside srHC domains (Table S2 for full list). FDR by Benjamini-Hochberg. (F) Frequency with which each CpG is methylated, by whole-genome bisulfite sequencing (GSM1127120). Whiskers: 10th and 90th percentiles among CpGs. The thousands (“K”) or millions (“M”) of CpGs per category are indicated. P values by Wilcoxon rank sum test.
Figure 3
Figure 3. A subset of H3K9me3 and H3K27me3 domains are structurally euchromatic and permissive to transcription
(A) Boxplots show mRNA-seq tag counts (normalized by DESeq2, divided by gene length) for genes inside each kind of domain (whiskers: 5th and 95th percentiles). Labels: “euchr” for euchromatin, “int” for intermediate. Parentheses denote number of genes per category. P values by Wilcoxon rank sum test. (B) Browser view of euchromatic H3K9me3 domains over expressed ZNF gene family cluster, which is depleted from srHC. The Gradient-seq track is shown as the difference in sequencing signal between the srHC and euchromatin fractions. The “euchr + K9 IP” track shows the H3K9me3 ChIP from the euchromatic (“euchr”) fraction of the gradient. (C) Non-redundant gene categories (InterPro database) significantly enriched for the euchromatic subtypes of H3K9me3 and H3K27me3 domains. FDR by Benjamini-Hochberg. See also Table S3, S4. (D) Genomic sites reported to lose H3K9me3 after depletion of the HUSH complex/SETDB1 (Tchasovnikarova et al., 2015). (E) Browser view of euchromatic H3K27me3 (“K27”) domain over HOXA gene cluster. (F) Fraction of satellite repeat types overlapping with srHC versus euchromatic H3K9me3 domains. Asterisks indicate significant enrichment (FDR < 0.05) in srHC (red) or euchromatic H3K9me3 (blue) based on 1000 simulations of randomly shuffled domains. See also Figure S2.
Figure 4
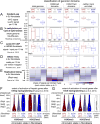
Figure 4. Classification of chromatin by sonication resistance and histone mark predicts diverse properties of heterochromatin
(A-G) Gradient-seq was used to classify fibroblast chromatin into three categories: srHC, intermediate (“int”), and euchromatin (“euchr”). Here we use diverse datasets to compare these categories on a genome-wide basis (“total genome”) and also for the regions inside H3K9me3 domains, inside H3K27me3 domains, or outside of both (“neither mark enriched”). Asterisks: P<0.05 by Wilcoxon rank sum test. Whiskers: 5th and 95th percentiles, unless specified below. (A) Gradient-seq data per 10-kb window plotted as the sequencing signal in the srHC fraction divided by that of euchromatin fraction. This data was used to classify the domains and serves as a reference for comparison to the other panels. (B) The frequency of DNA methylation per CpG (Bernstein et al., 2010) at CpG islands (whiskers: 10th and 90th percentiles among CpGs). Data on far left is also shown in Figure 2F, left. See also Figure S3. (C) Lamin B1 ChIP-seq signal (Dou et al., 2015), divided by corresponding input signal, per 10-kb window. (D) DNase-seq reads (Thurman et al., 2012) per million mapped per 10-kb window (n.s., not significant). (E) Timing of DNA replication. For each cell cycle phase, the number of Repli-seq reads (Pope et al., 2014) in each domain category was normalized for sequencing depth and expressed as a fraction of the total signal for that domain type, so that each column sums to 1. (F) Extent of gene activation during hiHep reprogramming. Microarray data (Huang et al., 2014) was curated for genes expressed in native hepatocytes more than fibroblasts (“hepatic genes”), and hiHep expression levels (log2-transformed) are plotted on a relative scale between fibroblast and hepatocyte levels. Violin plots use width to show where values are concentrated; median is indicated by white circles. (G) As in F, but for neuronal (hiCN) reprogramming (Liu et al., 2013), with genes filtered for those expressed in spinal cord over fibroblasts (“neural genes”).
Figure 5
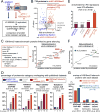
Figure 5. Proteomic analysis of purified H3K9me3-marked heterochromatin
(A) Strategy for quantitative proteomics study of 3 purified fractions. (B) Proteins with a higher average rank in the srHC+H3K9me3 sample than the gradient top sample (x-axis) and a significance less than 0.05 (y-axis) were classified as “H3K9me3 heterochromatin proteins”. See also Table S5. (C) (left) List of selected H3K9me3 heterochromatin proteins that were previously shown to contribute to heterochromatin and/or gene repression; (right) the 172 H3K9me3 heterochromatin proteins were sorted and plotted by their fold-enrichment in the srHC+H3K9me3 (relative to gradient top), with the selected proteins on the left indicated by orange dots. RBMX and RBMXL1, a focus of subsequent studies, are indicated in red (RBMXL1 is srHC-enriched but not one of the 172 H3K9me3 heterochromatin proteins). References: (van Dijk et al., 2010; Dong et al., 2009; Hayashihara et al., 2010; Mathur et al., 2001; Thompson et al., 2015; Vermeulen et al., 2010). (D) Percentage of each proteomic category (eg, H3K9me3 heterochromatin proteins) that is found in each published dataset. The raw number of proteins found in common is listed below the bars. Significance was computed relative to the background overlap for the total set of 3,097 MS-detected proteins: *p<0.05, **p<0.001. (E) Protein categories from proteomics analysis were compared to lists of iPS repressors (knockdown increases reprogramming) and iPS effectors (knockdown inhibits reprogramming) from a genome-wide screen (Toh et al., 2016). The ratio of repressors to effectors is plotted (numbers above the bar). Asterisk indicates P < 0.05 by simulation test. See also Figure S4. (F) The 172 H3K9me3 heterochromatin proteins were sorted and plotted by their fold-enrichment in the srHC+H3K9me3 (relative to gradient top), with proteins recurrently mutated in ALS (Cirulli et al., 2015) indicated in green. (G) Percentage of proteins that overlap with each dataset, for all H3K9me3 heterochromatin proteins and those with RNA-binding activity according to (Gerstberger et al., 2014).
Figure 6
Figure 6. A screen of heterochromatin proteins reveals functional impediments to gene activation
(A) Browser views comparing fibroblast (“fib.”) and liver chromatin state at hepatic genes monitored for functional screen. All ChIP-seq data (n=2 for fib. H3K9me3, otherwise n=3) and mRNA-seq data (n=1) were obtained from the Epigenomics Roadmap. Red arrows indicate liver-specific mRNA-seq signal. (B) Experimental setup of siRNA screen. (C) Heatmap showing fold-upregulation of indicated transcripts after siRNA treatment in the presence of hepatic TFs (average of two siRNAs and two replicates), relative to control siRNA and GAPDH endogenous control. See also Figure S5, Table S6. (D) Fold-change in expression of hepatic genes in fibroblast H3K9me3 domains (DSC2, NR1H4, and CRP) in siRNA screen performed in the presence of hepatic TFs. Each dot indicates a different siRNA targeting one of the 50 screened genes (two siRNAs per gene) or targeting the H3K9me3 methyltransferases SUV39H1 or SETDB1. Fold-changes are calculated relative to an average of negative control siRNAs, and the axes compare the effect seen in two independent screen replicates. Red dots indicate significant upregulation by T-test in the two replicates of that siRNA compared to control. Labeling is applied selectively to significant siRNAs of interest. Indicated “RBMX” siRNAs co-target both RBMX and RBMXL1.
Figure 7
Figure 7. RBMX and RBMXL1 maintain the sonication resistance and reprogramming resistance of hepatic genes in heterochromatin
(A) RT-PCR for hepatic genes marked by H3K9me3 in fibroblasts, after two cycles of siRNA transfection, in fibroblasts expressing hepatic TFs (left) or not (right). Error bars, SEM of two biological replicates; P values by Student’s T test. (B) Relative enrichment of sequences in gel-extracted srHC DNA versus sonication-sensitive DNA, by qPCR, after treatment with the indicated siRNA. PCR sites include gene promoters in srHC domains (left) and euchromatic sites (far right; primers: 1-Ch3_nonDBR_1 and 2-Chr20_nonDBR_3). Error bars: SD of two biological replicates. See also Figure S6. (C) Comparison of expression fold-changes induced by SUV39H1 siRNA versus RBMX/L1 siRNA, in the presence of hiHep factors, at genes inside srHC domains, by mRNA-seq (n=2 per condition). See also Table S7. (D) Browser views of genes in srHC that are upregulated by si-SUV39H1 and si-RBMX/L1 in the presence (left) or absence (far right) of hepatic factors. (E) Top: flow cytometry comparison of hiHep reprogramming efficiency at day 14 (percent of cells double-positive for albumin and alpha-1-antitrypsin/AAT) after indicated siRNA treatments (*p<0.05, **p<0.005, Student’s T test, n=2, error bars: SD). Bottom: representative immunofluorescence of siRNA-treated hiHeps at day 10 of reprogramming. See also Figure S7.

Comment in

References

    1. Amlie-Wolf A, Ryvkin P, Tong R, Dragomir I, Suh E, Xu Y, Van Deerlin VM, Gregory BD, Kwong LK, Trojanowski JQ, et al. Transcriptomic Changes Due to Cytoplasmic TDP-43 Expression Reveal Dysregulation of Histone Transcripts and Nuclear Chromatin. PLoS One. 2015;10:e0141836. - PMC - PubMed
    1. Auerbach RK, Euskirchen G, Rozowsky J, Lamarre-Vincent N, Moqtaderi Z, Lefrancois P, Struhl K, Gerstein M, Snyder M. Mapping accessible chromatin regions using Sono-Seq. Proc Natl Acad Sci U S A. 2009;106:14926–14931. - PMC - PubMed
    1. Bao X, Wu H, Zhu X, Guo X, Hutchins AP, Luo Z, Song H, Chen Y, Lai K, Yin M, et al. The p53-induced lincRNA-p21 derails somatic cell reprogramming by sustaining H3K9me3 and CpG methylation at pluripotency gene promoters. Cell Res. 2015;25:80–92. - PMC - PubMed
    1. Becker JS, Nicetto D, Zaret KS. H3K9me3-Dependent Heterochromatin: Barrier to Cell Fate Changes. Trends Genet. 2016;32:29–41. - PMC - PubMed
    1. Beisel C, Paro R. Silencing chromatin: comparing modes and mechanisms. Nat Rev Genet. 2011;12:123–135. - PubMed

Publication types

MeSH terms