. 2017 Dec 21;68(6):1067-1082.e12.
doi: 10.1016/j.molcel.2017.11.026.

AP-1 Transcription Factors and the BAF Complex Mediate Signal-Dependent Enhancer Selection

Affiliations

AP-1 Transcription Factors and the BAF Complex Mediate Signal-Dependent Enhancer Selection

Thomas Vierbuchen et al. Mol Cell. .

Abstract

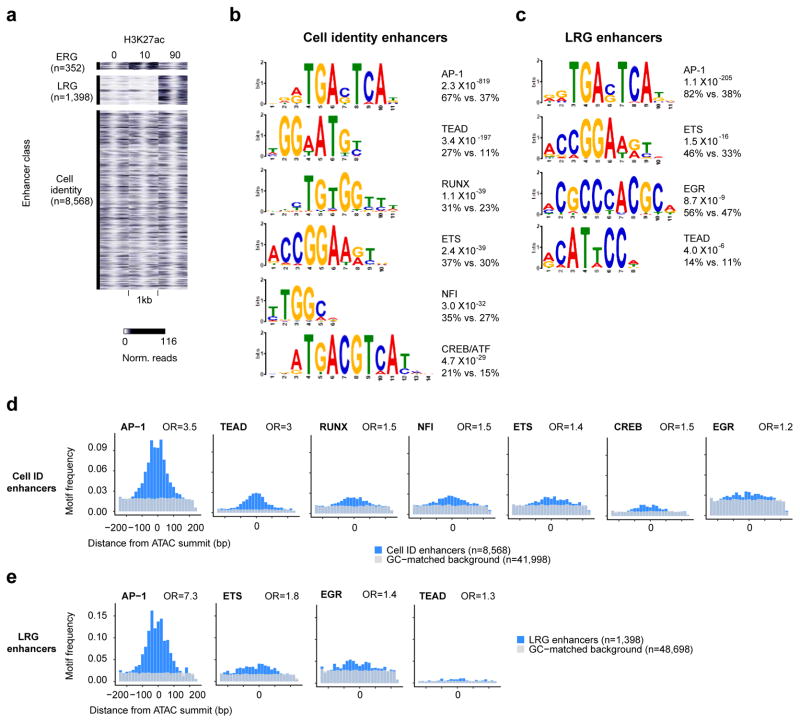
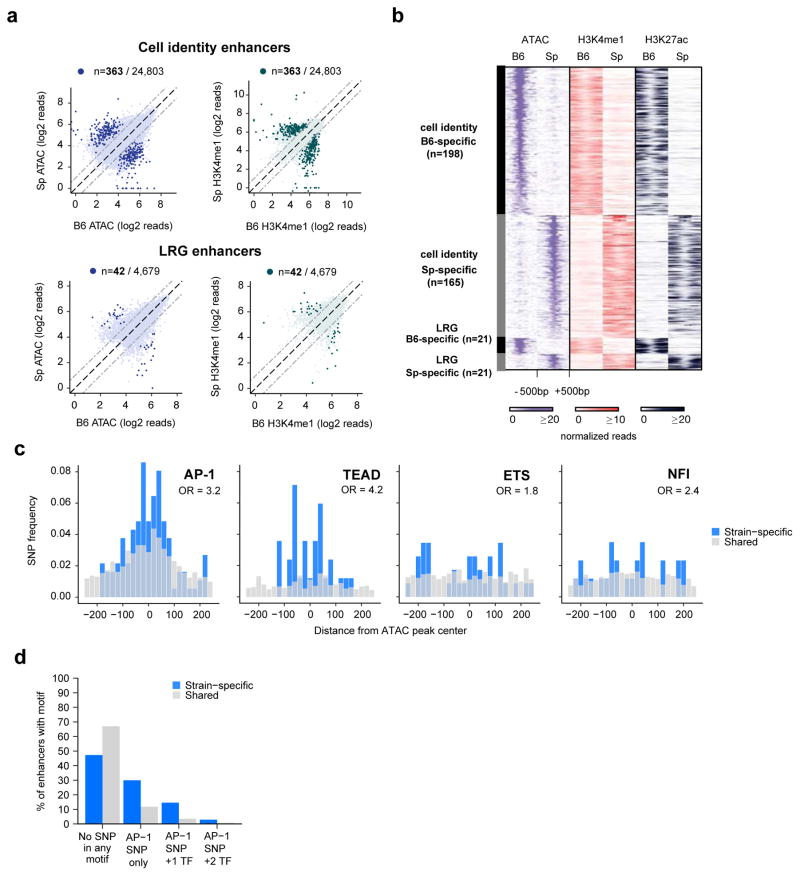
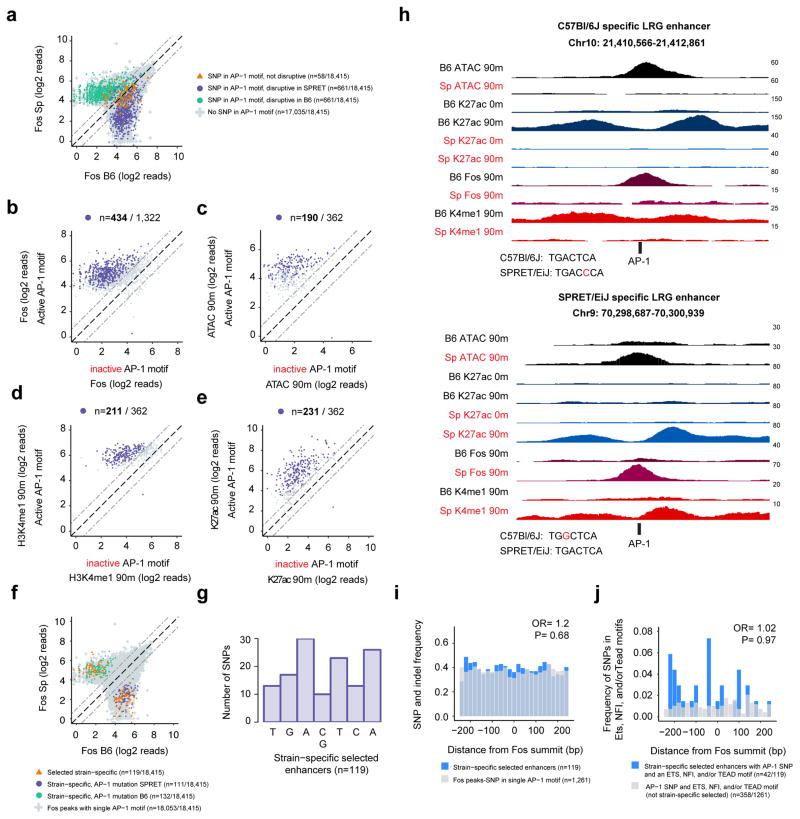
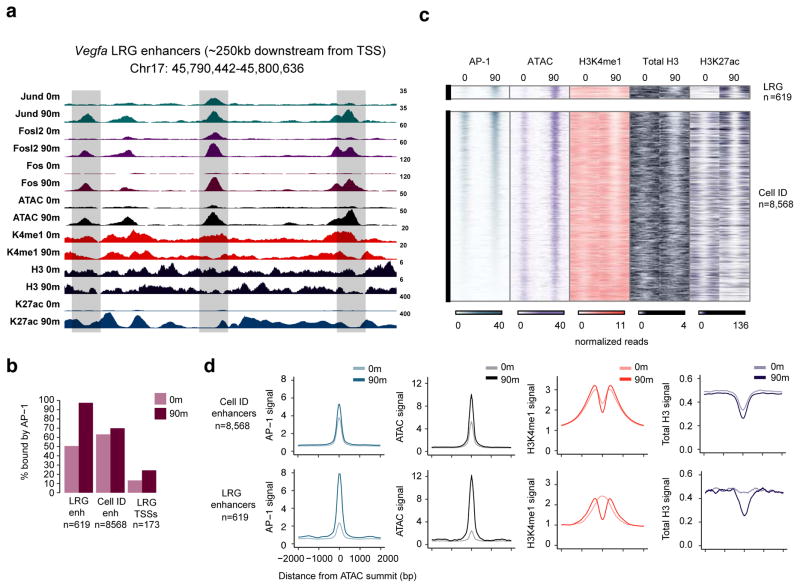
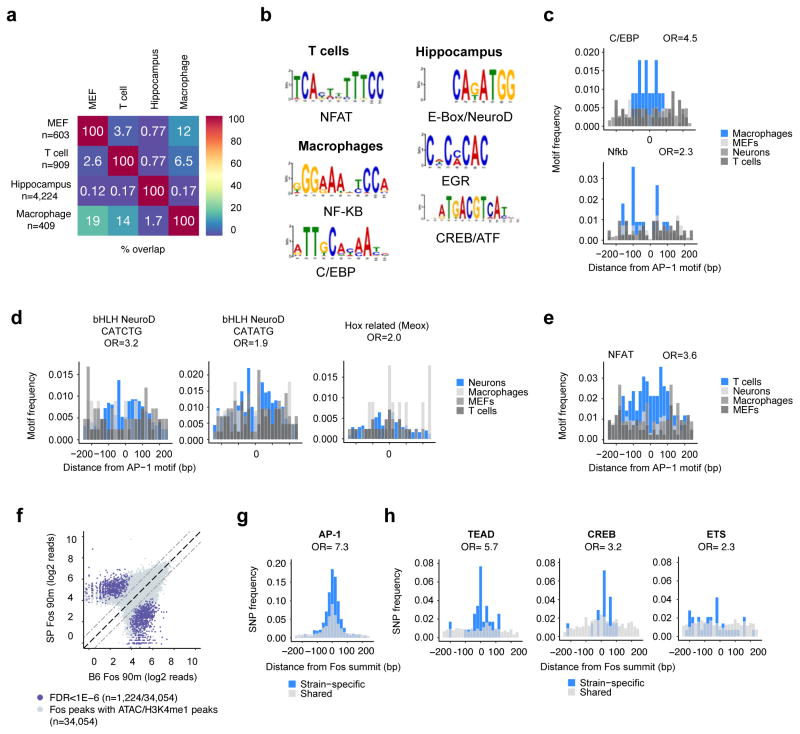
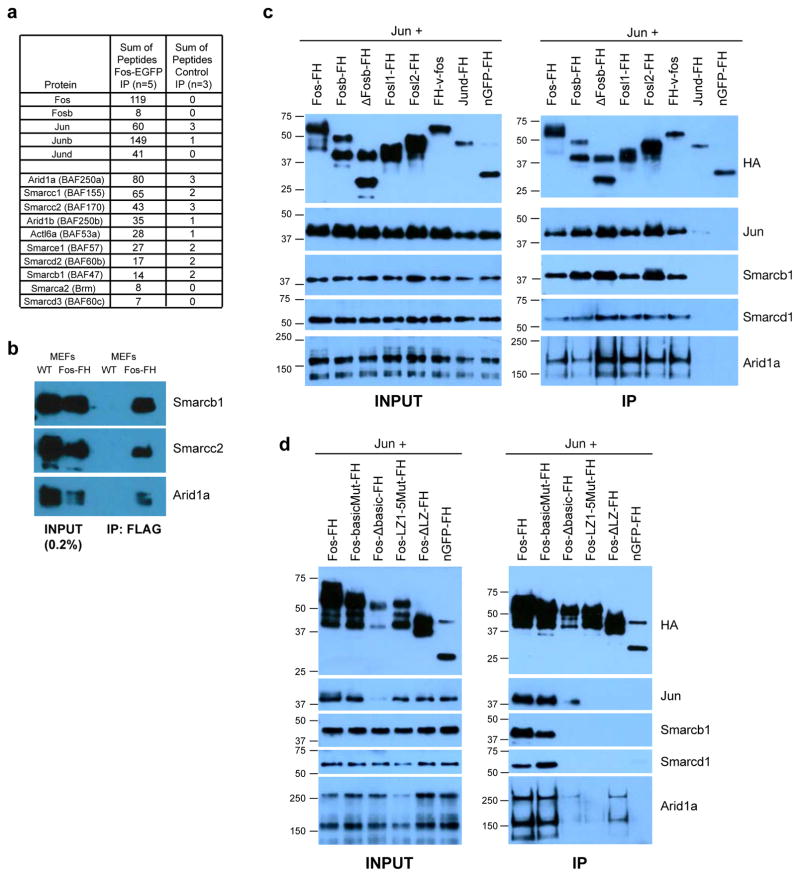
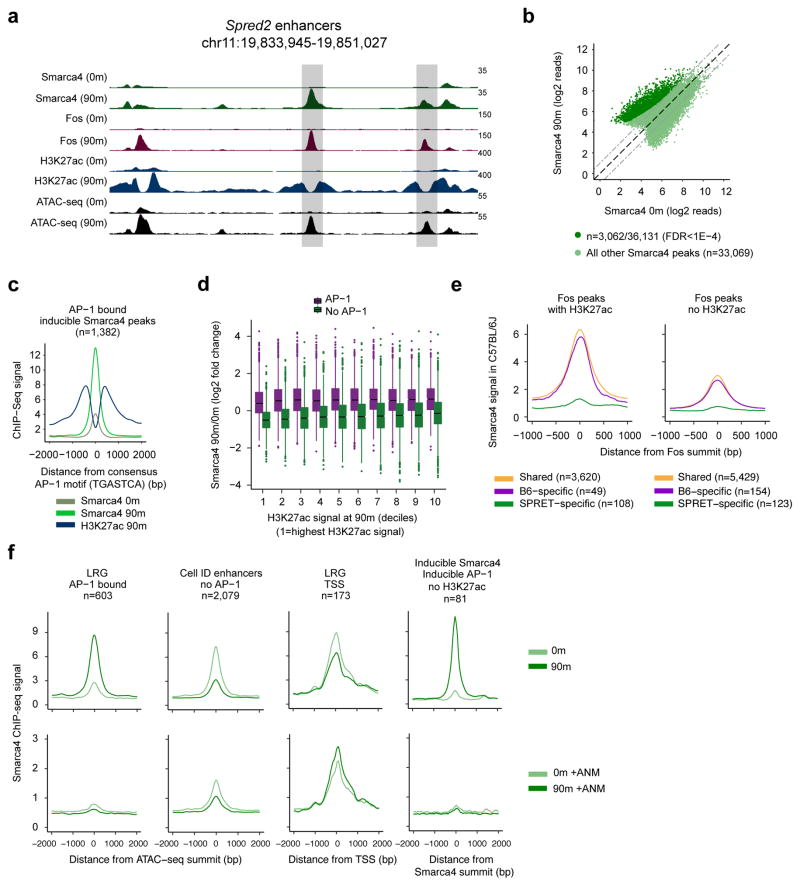
Enhancer elements are genomic regulatory sequences that direct the selective expression of genes so that genetically identical cells can differentiate and acquire the highly specialized forms and functions required to build a functioning animal. To differentiate, cells must select from among the ∼106 enhancers encoded in the genome the thousands of enhancers that drive the gene programs that impart their distinct features. We used a genetic approach to identify transcription factors (TFs) required for enhancer selection in fibroblasts. This revealed that the broadly expressed, growth-factor-inducible TFs FOS/JUN (AP-1) play a central role in enhancer selection. FOS/JUN selects enhancers together with cell-type-specific TFs by collaboratively binding to nucleosomal enhancers and recruiting the SWI/SNF (BAF) chromatin remodeling complex to establish accessible chromatin. These experiments demonstrate how environmental signals acting via FOS/JUN and BAF coordinate with cell-type-specific TFs to select enhancer repertoires that enable differentiation during development.

Keywords: Ras/MAPK signaling; chromatin remodeling complexes; enhancers; genetics; genomics; growth factor signaling; lineage specification; mSWI/SNF (BAF) complexes; transcription factors; transcriptional regulation.


Figures

Figure 1
Figure 1. Identification of distinct classes of active enhancers in fibroblasts
a) H3K27ac ChIP-seq signal (0, 10, 90m of serum stimulation) at distinct classes of enhancers. b,c) Position weight matrices of motifs enriched in cell identity and LRG enhancers. Percentages indicate the fraction of enhancers in each group that contain the motif compared to a GC-matched background set of genomic regions. d,e) Motif frequencies for cell identity and LRG enhancers for motifs identified in (b,c). ORs were calculated for motif occurrences within +/−250bp of the ATAC-seq peak center. P values (chi-square test): Cell identity (<5.3×l0−16), LRG (<5.2×l0−4)
Figure 2
Figure 2. Identification of TF motifs required for cell identity and LRG enhancer selection
a) ATAC-seq and H3K4me1 ChIP-seq signal from MEFs from C57BI/6J and SPRET/EiJ mice are displayed for cell identity (top row) and LRG (bottom row) enhancers. Highlighted points indicate FDR<10−6. b) ATAC-seq, H3K4me1 ChIP-seq, and H3K27ac ChIP-seq signal from strain-specific enhancers identified in (a), c) Frequency of SNPs that overlap each of the indicated TF motifs. Among the motifs observed to be enriched in Figure 1 at cell identity and LRG enhancers, only SNPs in these motifs exhibited a significantly higher frequency in strain-specific enhancers compared to shared enhancers (by chi-square test), d) Percentages of strain-specific or shared enhancers that do not have SNPs overlapping any enriched TF motif (“No SNP in any motif”), have SNPs overlapping only the AP-1 motif (“AP-1 SNP only”), or have SNPs overlapping both AP-1 and other TF motif(s) within the same enhancer.
Figure 3
Figure 3. AP-1 TFs are often required for enhancer selection
a) Fos ChIP-seq signal at all selected enhancers in C57Bl/6J and SPRET/EiJ MEFs that contain a single consensus AP-1 motif and are bound by Fos. SNPs overlapping AP-1 motifs are indicated by their predicted effect on AP-1 binding, b) Fos ChIP-seq signal from each strain for the enhancers identified in (a) at which AP-1 binding would be predicted to be affected by a SNP. Enhancers are classified by whether they contain an active or inactive AP-1 motif, rather than by which strain they come from. Highlighted points indicate enhancers at which Fos binding was significantly strain-specific [FDR<10−6). c–e) Enhancer associated chromatin features for the subset of the enhancers with significant strain-specific Fos binding in (b) that no longer have a Fos peak detected in the strain in which the AP-1 motif is mutated (n=362/434). Highlighted points indicate enhancers at which the chromatin feature was significantly strain-specific (FDR<10−6). f) Fos ChIP-seq signal from each strain. Colored points collectively indicate the 362 enhancers plotted in (c–e). 119 strain-specific enhancers are highlighted (orange triangles) at which the AP-1 SNP leads to both a significant loss of ATAC-seq and H3K4me1 ChIP-seq signal and there is no longer an ATAC-seq peak in the strain in which the AP-1 motif is inactive. g) Histogram showing the location of SNPs in the seven core nucleotides of the AP-1 motif from the 119 strain-specific selected enhancers. h) Representative genome browser tracks for two strain-specific LRG enhancers. AP-1 motifs from each strain are displayed below the enhancer with the SNP highlighted in red. i–j) Total SNP and indel frequency (i) and SNP frequency within Tead/Ets/NFI motifs (j) comparing the 119 strain-specific enhancers (blue) to all other enhancers with a single AP-1 motif that overlaps a SNP (i) (gray) or the subset of these enhancers that contain Tead/Ets/NFI motifs (j).
Figure 4
Figure 4. AP-1 TFs bind inducibly to LRG enhancers
a) Representative genome browser tracks of the enhancers downstream from the Vegfa gene showing binding of AP-1 TFs expressed in quiescent MEFs (Jund, Fosl2) as well as the inducible AP-1 TF Fos. Shaded boxes indicate LRG enhancers. Scale bars indicate normalized read densities for each ChIP-seq (0 and 90m are displayed on the same scale for each track). b) Percentages of LRG and cell identity enhancers, as well as the TSSs of LRGs, that are bound by AP-1 TFs in quiescent and stimulated MEFs. c–d) Fixed line plots (c) and aggregate plots (d) of enhancer associated histone modifications at LRG and cell identity enhancers before and after stimulation.
Figure 5
Figure 5. AP-1 binds together with lineage-specific TFs to select enhancers
a) Overlap between LRG enhancers identified in MEFs and enhancers from macrophages (Ostuni et al., 2013), T cells (Bevington et al., 2016), and hippocampal tissue (Su et al., 2017) that undergo inducible nucleosome remodeling upon activation by relevant stimuli and that are enriched for AP-1 motifs and bound by AP-1 TFs (macrophages and T cells) or predicted to be bound by AP-1 TFs (hippocampal tissue). b) Results from targeted motif searches of inducible enhancers identified in each cell type (macrophages/T cells +/− 250bp from AP-1 TF peak center; hippocampus +/− 250bp from ATAC-seq peak center). Enhancers from each cell type are enriched for AP-1 motifs; however, for this analysis AP-1 motifs were masked to increase sensitivity for the identification of additional TFs. c–e) Frequencies of the indicated cell type-specific TF binding motifs at inducible enhancers from indicated cell types. Among the motifs identified to be enriched at inducible enhancers in each cell type, only these motifs exhibited a significantly higher frequency in their respective cell types (blue) compared to the other cell types examined (greys). P values (chi-square test): C/EBP (3.9×10⁻¹¹), NF-kB (2.1×10⁻³), bHLH (CATCTG) (2.4×10⁻⁷), bHLH (CATATG) (7.9×10⁻⁶), Hox related (Meox) (6.9×10⁻³), NFAT (<2.2×10⁻¹⁶). f) Fos ChIP-seq signal in C57Bl/6J and SPRET/EiJ at enhancers selected in either strain. Strain-specific motifs (FDR<1×10⁻⁶) are indicated by colored dots. g–h) Frequency of SNPs from strain-specific (blue) and shared (grey) Fos binding motifs in (f). ORs were calculated for SNP occurrences +/−75 bp from the AP-1 motif in the enhancer. P values (chi-square test): AP-1 (<2.2×10⁻¹⁶), TEAD (7.3×10⁻¹²), CREB (3.4×10⁻³), ETS [1.7×10⁻²).
Figure 6
Figure 6. AP-1 TFs interact with the BAF chromatin remodeling complex
a) Summary of total peptides identified from Fos-EGFP or control immunoprecipitates analyzed by mass spectrometry. Additional information including Fold Change (FC) calculations are reported in Table S2. b) Western blots with indicated antibodies of anti-FLAG immunoprecipitates from stimulated (90m) wild-type (WT) or Fos-FlagHA knock-in MEFs. c–d) Western blots of input (left column) and proteins co-immunoprecipitated with FlagHA-tagged AP-1 family members (c) and indicated mutants of Fos (d) co-transfected with untagged Jun into HEK293T cells. Fos-basic mutant=specific amino acids mutated in the basic domain that binds DNA; Fos Δ–basic domain=basic domain complete deletion; FosL(1–5) mutant=all leucines in the leucine zipper mutated to valines (the leucine zipper is required for heterodimerization with Jun family proteins and thus for DNA binding); Fos Δ LZ =leucine zipper deletion. Transfected Fos family members exhibited variable expression levels, so, when possible, the amount of transfected plasmid was titrated to achieve similar expression levels (see methods). However, deletion of the entire basic domain in Fos (Fos Δ–basic domain) also destabilizes Jun protein, leading to reduced Jun levels and complicating our assessment of the effect of this deletion on AP-1’s ability to interact with BAF components.
Figure 7
Figure 7. AP-1 TFs are required for BAF recruitment to enhancers
a) Representative LRG enhancers at the locus of the LRG Spred2. Scale bars indicate normalized read densities for each ChIP-seq and shaded boxes denote LRG enhancers. b) Smarca4 ChIP-seq signal at all Smarca4 peaks before and after stimulation with serum for 90m. Dashed gray lines indicate a 2-fold change. Smarca4 peaks with a significant increase in Smarca4 signal at 90m (n=3,062) compared to 0m are indicated in dark green (FDR<1×10⁻⁴). Smarca4 peaks that do not increase significantly at 90m (n=33,069) are indicated in light green. c) Smarca4 and H3K27ac ChIP-seq signal at all inducible Smarca4 peaks bound by AP-1. Smarca4 peaks have been recentered on the closest consensus AP-1 motif within +/−125bp of the Smarca4 peak center. d) Inducible binding of Smarca4 (90m/0m) at ATAC-seq peaks across the genome. ATAC-seq peaks are split into AP-1 bound and not AP-1 bound and binned into deciles according to their levels of H3K27ac ChIP-seq signal [decile 1 =highest H3K27ac signal at 90m; decile 10=lowest H3K27ac signal at 90m). e) Smarca4 ChIP-seq signal from C57Bl/6J MEFs at a set of enhancers that exhibit SPRET/EiJ-specific binding of AP-1 compared to enhancers at which AP-1 binds in both strains. In the left panel, SPRET/EiJ-specific enhancers function as H3K27ac-marked active enhancers in SPRET/EiJ but have an AP-1 point mutation in C57Bl/6J that disrupts binding of Fos (n=108). A similar comparison is shown in the right panel, but instead of focusing on active enhancers in SPRET/EiJ that have lost Fos binding in C57Bl/6J, it displays the Smarca4 ChIP-seq signal at all Fos peaks that are SPRET/EiJ–specific but not at active enhancers (n=123). f) Smarca4 ChIP-seq signal from MEFs in untreated cells (top row) or cells pretreated with the protein synthesis inhibitor anisomycin prior to serum stimulation (bottom row) at different classes of cis-regulatory elements (first three panels) and at Smarca4 peaks at which Smarca4 binding and AP-1 binding are both inducible but that are not at active enhancers marked by H3K27ac.

References

    1. Alver BH, Kim KH, Lu P, Wang X, Manchester HE, Wang W, Haswell JR, Park PJ, Roberts CW. The SWI/SNF chromatin remodelling complex is required for maintenance of lineage specific enhancers. Nature communications. 2017;8:14648. - PMC - PubMed
    1. Bailey TL, Machanick P. Inferring direct DNA binding from ChIP-seq. Nucleic acids research. 2012;40:el28. - PMC - PubMed
    1. Bevington SL, Cauchy P, Piper J, Bertrand E, Lalli N, Jarvis RC, Gilding LN, Ott S, Bonifer C, Cockerill PN. Inducible chromatin priming is associated with the establishment of immunological memory in T cells. The EMBO journal. 2016;35:515–535. - PMC - PubMed
    1. Bhatt DM, Pandya-Jones A, Tong AJ, Barozzi I, Lissner MM, Natoli G, Black DL, Smale ST. Transcript dynamics of proinflammatory genes revealed by sequence analysis of subcellular RNA fractions. Cell. 2012;150:279–290. - PMC - PubMed
    1. Biddie SC, John S, Sabo PJ, Thurman RE, Johnson TA, Schiltz RL, Miranda TB, Sung MH, Trump S, Lightman SL, et al. Transcription factor AP1 potentiates chromatin accessibility and glucocorticoid receptor binding. Molecular cell. 2011;43:145–155. - PMC - PubMed

Publication types