

Age-based partitioning of individual genomic inbreeding levels in Belgian Blue cattle
- PMID: 29273000
- PMCID: PMC5741860
- DOI: 10.1186/s12711-017-0370-x
Age-based partitioning of individual genomic inbreeding levels in Belgian Blue cattle
Abstract
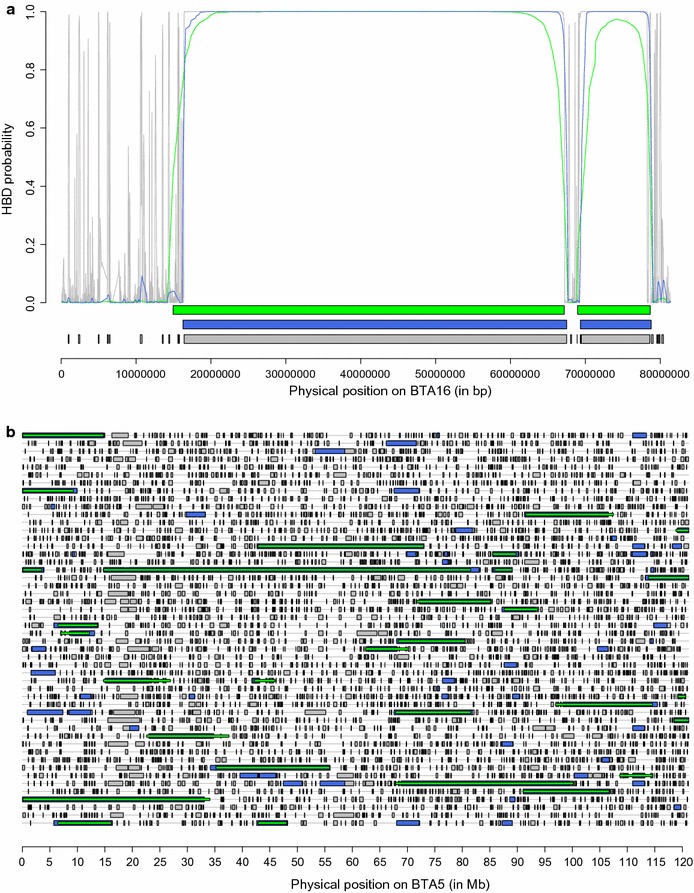
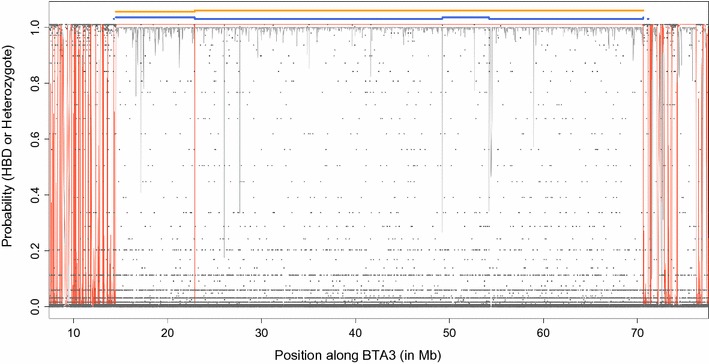
Background: Inbreeding coefficients can be estimated either from pedigree data or from genomic data, and with genomic data, they are either global or local (when the linkage map is used). Recently, we developed a new hidden Markov model (HMM) that estimates probabilities of homozygosity-by-descent (HBD) at each marker position and automatically partitions autozygosity in multiple age-related classes (based on the length of HBD segments). Our objectives were to: (1) characterize inbreeding with our model in an intensively selected population such as the Belgian Blue Beef (BBB) cattle breed; (2) compare the properties of the model at different marker densities; and (3) compare our model with other methods.
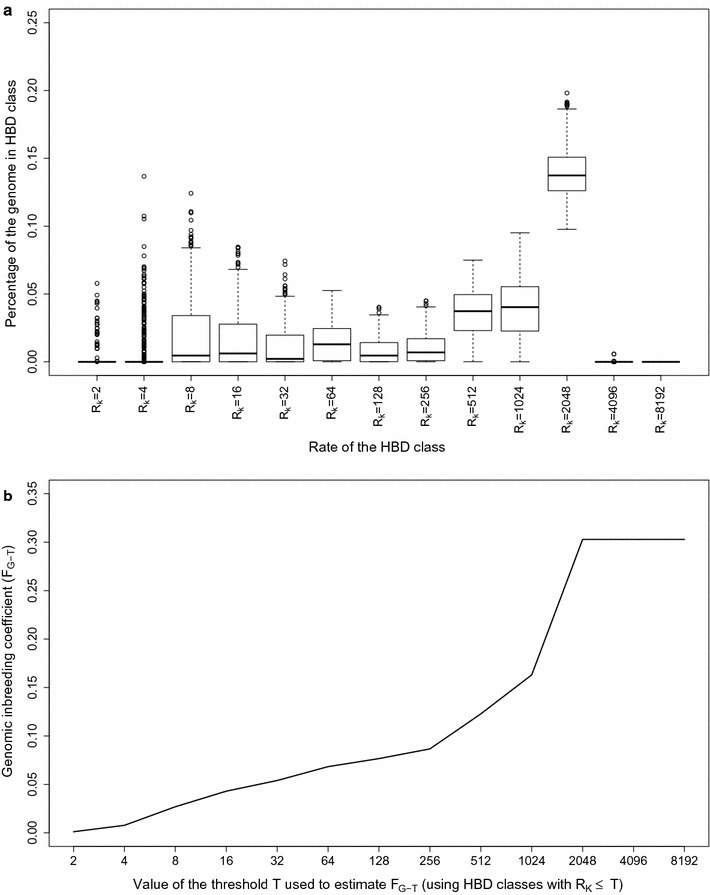
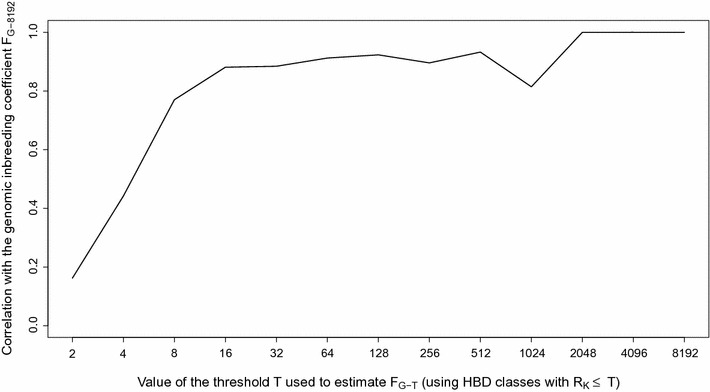
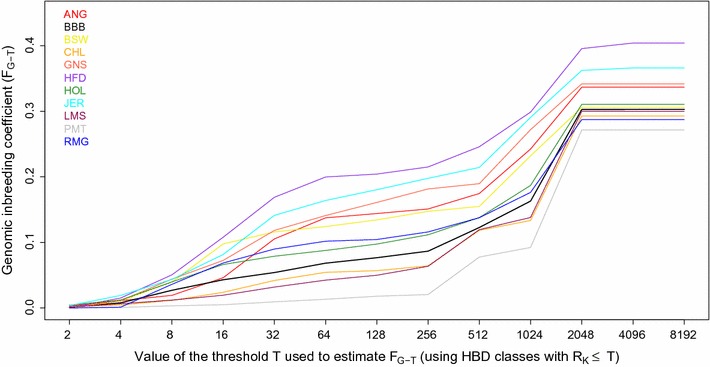
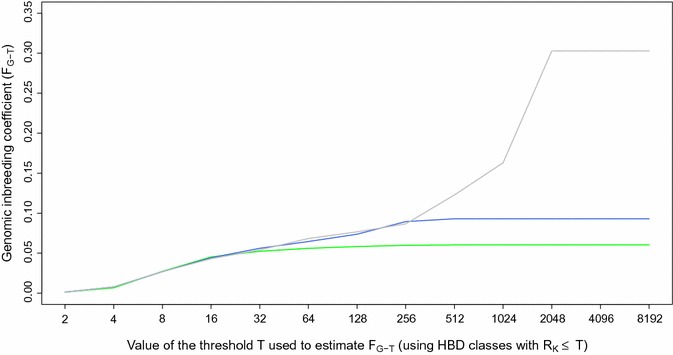
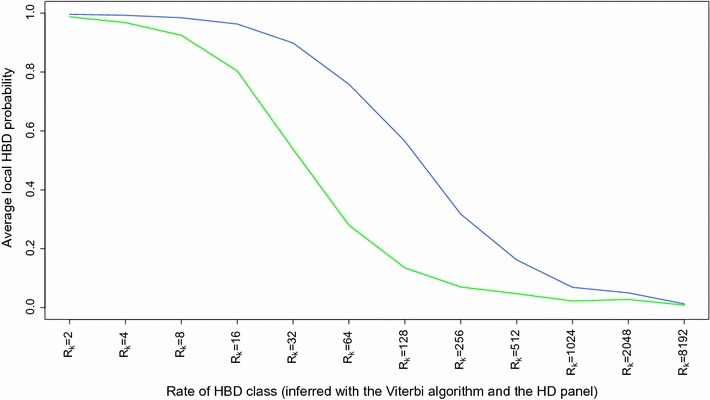
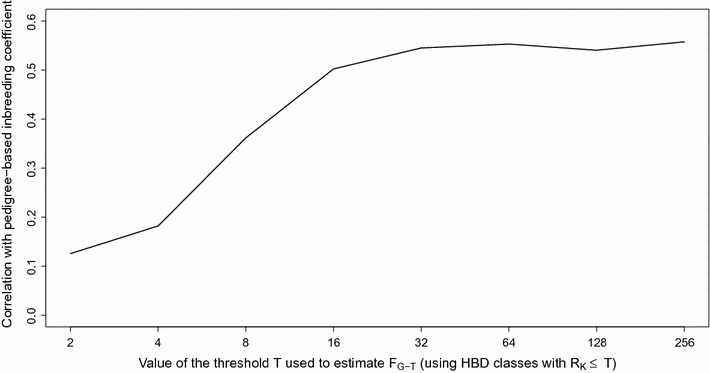
Results: When using 600 K single nucleotide polymorphisms (SNPs), the inbreeding coefficient (probability of sampling an HBD locus in an individual) was on average 0.303 (ranging from 0.258 to 0.375). HBD-classes associated to historical ancestors (with small segments ≤ 200 kb) accounted for 21.6% of the genome length (71.4% of the total length of the genome in HBD segments), whereas classes associated to more recent ancestors accounted for only 22.6% of the total length of the genome in HBD segments. However, these recent classes presented more individual variation than more ancient classes. Although inbreeding coefficients obtained with low SNP densities (7 and 32 K) were much lower (0.060 and 0.093), they were highly correlated with those obtained at higher density (r = 0.934 and 0.975, respectively), indicating that they captured most of the individual variation. At higher SNP density, smaller HBD segments are identified and, thus, more past generations can be explored. We observed very high correlations between our estimates and those based on homozygosity (r = 0.95) or on runs-of-homozygosity (r = 0.95). As expected, pedigree-based estimates were mainly correlated with recent HBD-classes (r = 0.56).
Conclusions: Although we observed high levels of autozygosity associated with small HBD segments in BBB cattle, recent inbreeding accounted for most of the individual variation. Recent autozygosity can be captured efficiently with low-density SNP arrays and relatively simple models (e.g., two HBD classes). The HMM framework provides local HBD probabilities that are still useful at lower SNP densities.
Figures
Similar articles
-
A hidden Markov model to estimate homozygous-by-descent probabilities associated with nested layers of ancestors.Theor Popul Biol. 2022 Jun;145:38-51. doi: 10.1016/j.tpb.2022.03.001. Epub 2022 Mar 10. Theor Popul Biol. 2022. PMID: 35283174
-
Inbreeding depression is associated with recent homozygous-by-descent segments in Belgian Blue beef cattle.Genet Sel Evol. 2024 Jan 31;56(1):10. doi: 10.1186/s12711-024-00878-7. Genet Sel Evol. 2024. PMID: 38297209 Free PMC article.
-
Assessment of runs of homozygosity islands and estimates of genomic inbreeding in Gyr (Bos indicus) dairy cattle.BMC Genomics. 2018 Jan 9;19(1):34. doi: 10.1186/s12864-017-4365-3. BMC Genomics. 2018. PMID: 29316879 Free PMC article.
-
Runs of homozygosity: current knowledge and applications in livestock.Anim Genet. 2017 Jun;48(3):255-271. doi: 10.1111/age.12526. Epub 2016 Dec 1. Anim Genet. 2017. PMID: 27910110 Review.
-
Invited review: Inbreeding in the genomics era: Inbreeding, inbreeding depression, and management of genomic variability.J Dairy Sci. 2017 Aug;100(8):6009-6024. doi: 10.3168/jds.2017-12787. Epub 2017 Jun 7. J Dairy Sci. 2017. PMID: 28601448 Review.
Cited by
-
Genetic Diversity and Signatures of Selection for Thermal Stress in Cattle and Other Two Bos Species Adapted to Divergent Climatic Conditions.Front Genet. 2021 Feb 3;12:604823. doi: 10.3389/fgene.2021.604823. eCollection 2021. Front Genet. 2021. PMID: 33613634 Free PMC article.
-
Inbreeding depression due to recent and ancient inbreeding in Dutch Holstein-Friesian dairy cattle.Genet Sel Evol. 2019 Sep 27;51(1):54. doi: 10.1186/s12711-019-0497-z. Genet Sel Evol. 2019. PMID: 31558150 Free PMC article.
-
Analysis of Autozygosity Using Whole-Genome Sequence Data of Full-Sib Families in Pikeperch (Sander lucioperca).Front Genet. 2022 Jan 17;12:786934. doi: 10.3389/fgene.2021.786934. eCollection 2021. Front Genet. 2022. PMID: 35111201 Free PMC article.
-
Fine-tuning genomic and pedigree inbreeding rates in equine population with a deep and reliable stud book: the case of the Pura Raza Española horse.J Anim Sci Biotechnol. 2022 Nov 7;13(1):127. doi: 10.1186/s40104-022-00781-5. J Anim Sci Biotechnol. 2022. PMID: 36336696 Free PMC article.
-
The value of genomic relationship matrices to estimate levels of inbreeding.Genet Sel Evol. 2021 May 1;53(1):42. doi: 10.1186/s12711-021-00635-0. Genet Sel Evol. 2021. PMID: 33933002 Free PMC article.
References
-
- Malécot G. Les Mathématiques de l’hérédité. Paris: Masson et Cie; 1948.
Publication types
MeSH terms
Grants and funding
LinkOut - more resources
Full Text Sources
Other Literature Sources
Molecular Biology Databases
Research Materials
Miscellaneous
