

An algorithm for the classification of mRNA patterns in eosinophilic esophagitis: Integration of machine learning
- PMID: 29273402
- PMCID: PMC6425755
- DOI: 10.1016/j.jaci.2017.11.027
An algorithm for the classification of mRNA patterns in eosinophilic esophagitis: Integration of machine learning
Abstract
Background: Diagnostic evaluation of eosinophilic esophagitis (EoE) remains difficult, particularly the assessment of the patient's allergic status.
Objective: This study sought to establish an automated medical algorithm to assist in the evaluation of EoE.
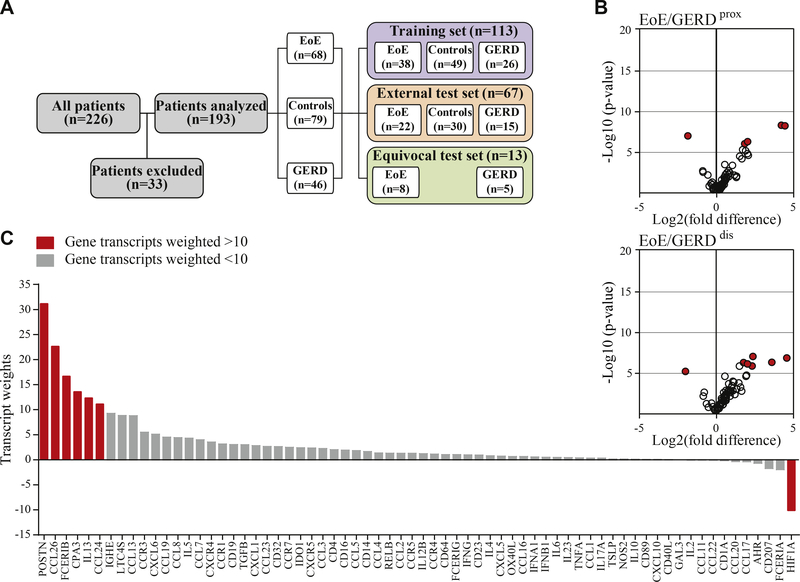
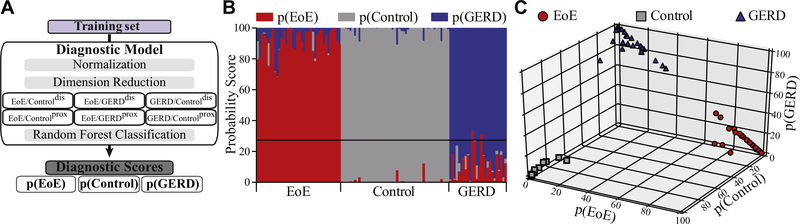
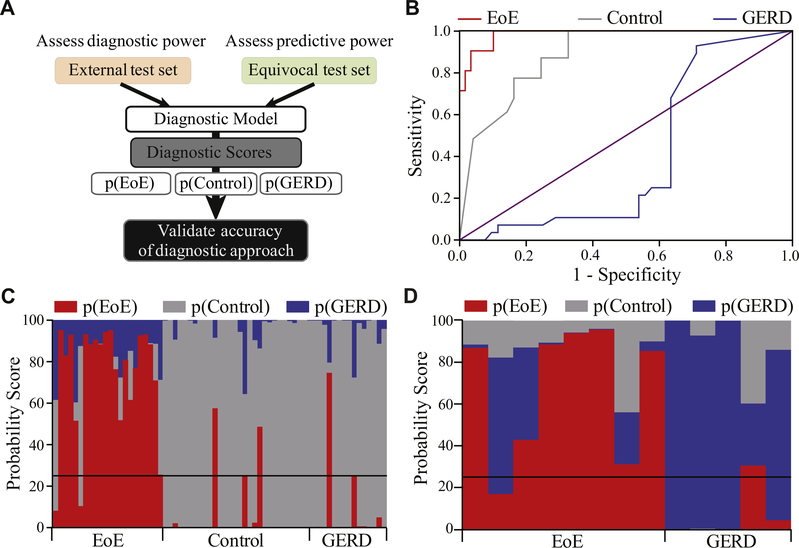
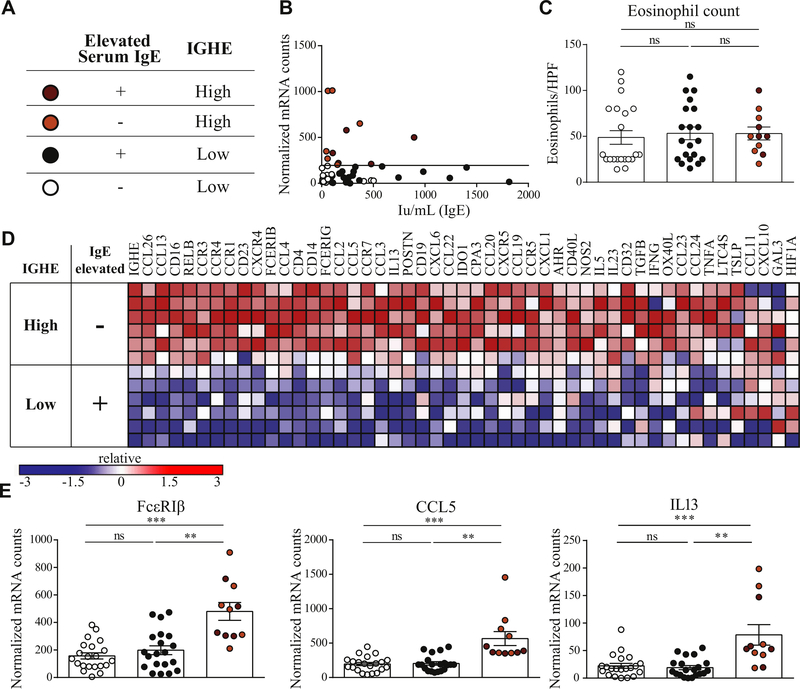
Methods: Machine learning techniques were used to establish a diagnostic probability score for EoE, p(EoE), based on esophageal mRNA transcript patterns from biopsies of patients with EoE, gastroesophageal reflux disease and controls. Dimensionality reduction in the training set established weighted factors, which were confirmed by immunohistochemistry. Following weighted factor analysis, p(EoE) was determined by random forest classification. Accuracy was tested in an external test set, and predictive power was assessed with equivocal patients. Esophageal IgE production was quantified with epsilon germ line (IGHE) transcripts and correlated with serum IgE and the Th2-type mRNA profile to establish an IGHE score for tissue allergy.
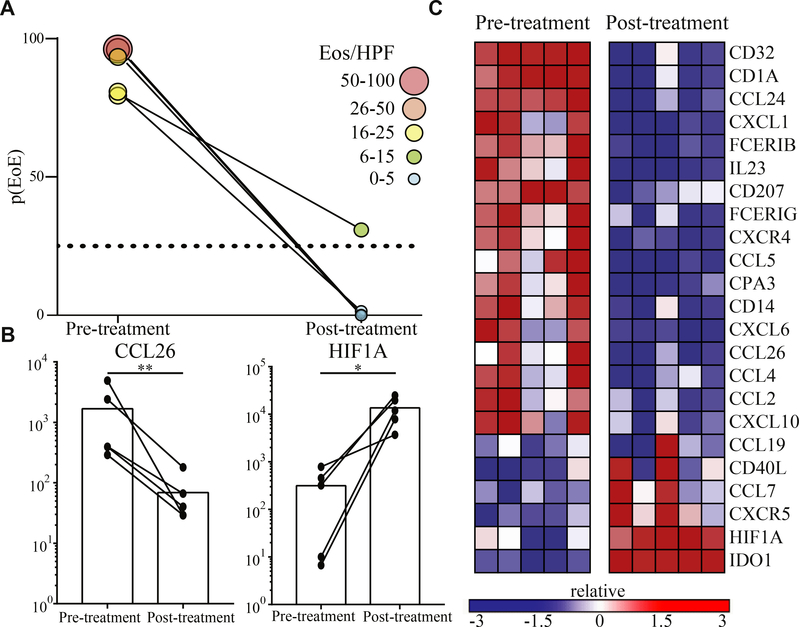
Results: In the primary analysis, a 3-class statistical model generated a p(EoE) score based on common characteristics of the inflammatory EoE profile. A p(EoE) ≥ 25 successfully identified EoE with high accuracy (sensitivity: 90.9%, specificity: 93.2%, area under the curve: 0.985) and improved diagnosis of equivocal cases by 84.6%. The p(EoE) changed in response to therapy. A secondary analysis loop in EoE patients defined an IGHE score of ≥37.5 for a patient subpopulation with increased esophageal allergic inflammation.
Conclusions: The development of intelligent data analysis from a machine learning perspective provides exciting opportunities to improve diagnostic precision and improve patient care in EoE. The p(EoE) and the IGHE score are steps toward the development of decision trees to define EoE subpopulations and, consequently, will facilitate individualized therapy.
Keywords: Allergy diagnosis; IgE; chronic allergic inflammation; eosinophilic esophagitis; eosinophils; machine learning; medical algorithm.
Copyright © 2017 American Academy of Allergy, Asthma & Immunology. Published by Elsevier Inc. All rights reserved.
Conflict of interest statement
Disclosure of potential conflict of interest: W. S. Lexmond has received grant funding from Ter Meulen Fund, Royal Netherlands Academy of Sciences and the Banning-de Jong Fund; fees from Kiniksa Pharmaceuticals for consultation; and his institution has received grant funds from Mead Johnson Company. Matthew J. Hamilton’s institution has grants pending with GlaxoSmithKline; and he has received consultancy fees from Pfizer, Takeda, and Protal Instruments. J. D. Goldsmith has received consulting fees from Roche Diagnostics and Takeda Pharmaceuticals; travel support from the College of American Pathologists and the Crohn’s and Colitis Foundation; and fees for expert testimony. The rest of the authors declare that they have no relevant conflicts of interest.
Figures


References
-
- Cianferoni A, Spergel JM. Eosinophilic esophagitis and gastroenteritis. Curr Allergy Asthma Rep 2015;15:58. - PubMed
-
- Dehlink E, Fiebiger E. The role of the high-affinity IgE receptor, FcepsilonRI, in eosinophilic gastrointestinal diseases. Immunol Allergy Clin North Am 2009;29: 159–70, xii. - PubMed
-
- Furuta GT, Forbes D, Boey C, Dupont C, Putnam P, Roy S, et al. Eosinophilic gastrointestinal diseases (EGIDs). J Pediatr Gastroenterol Nutr 2008;47:234–8. - PubMed
-
- Fahey LM, Liacouras CA. Eosinophilic gastrointestinal disorders. Pediatr Clin North Am 2017;64:475–85. - PubMed
Publication types
MeSH terms
Substances
Grants and funding
LinkOut - more resources
Full Text Sources
Other Literature Sources
Medical
