. 2018 Feb 5;215(2):441-458.
doi: 10.1084/jem.20170057. Epub 2017 Dec 22.

Transcriptional and functional profiling defines human small intestinal macrophage subsets

Affiliations

Transcriptional and functional profiling defines human small intestinal macrophage subsets

Anna Bujko et al. J Exp Med. .

Abstract

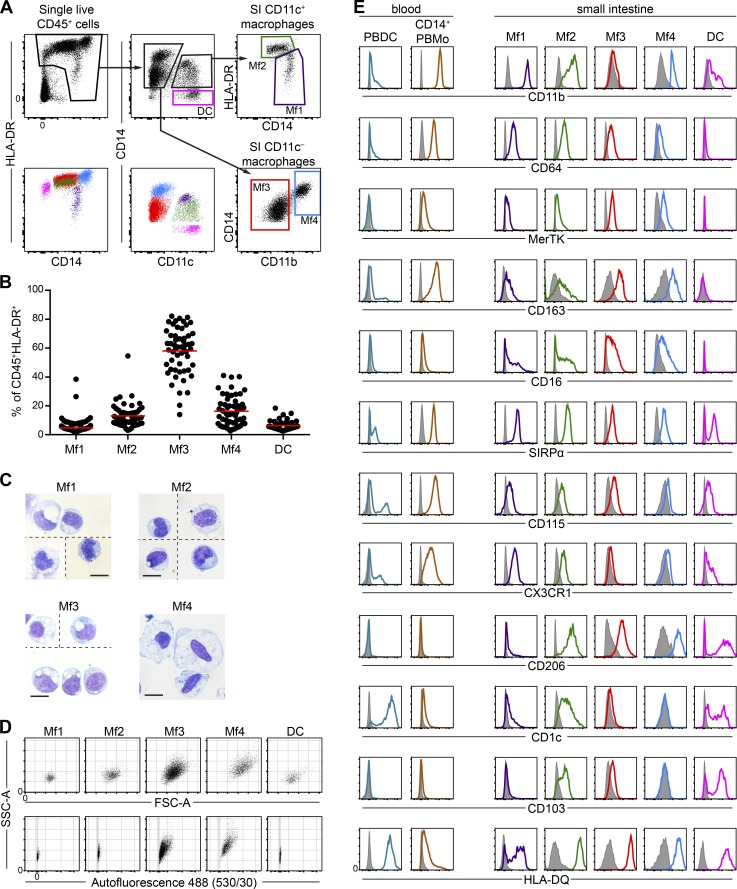
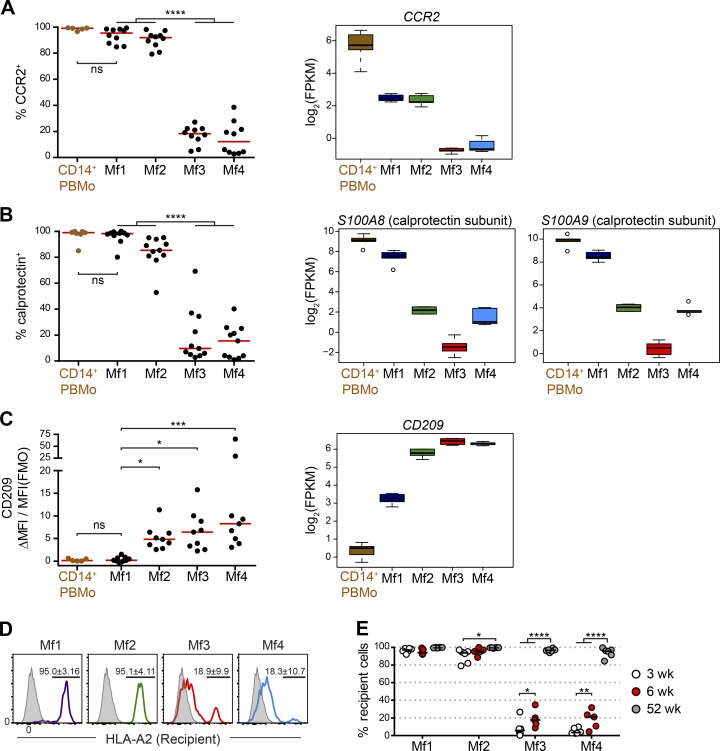
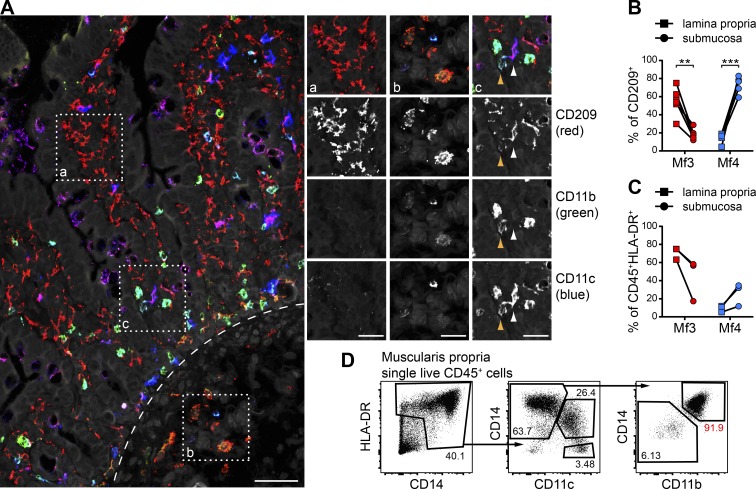
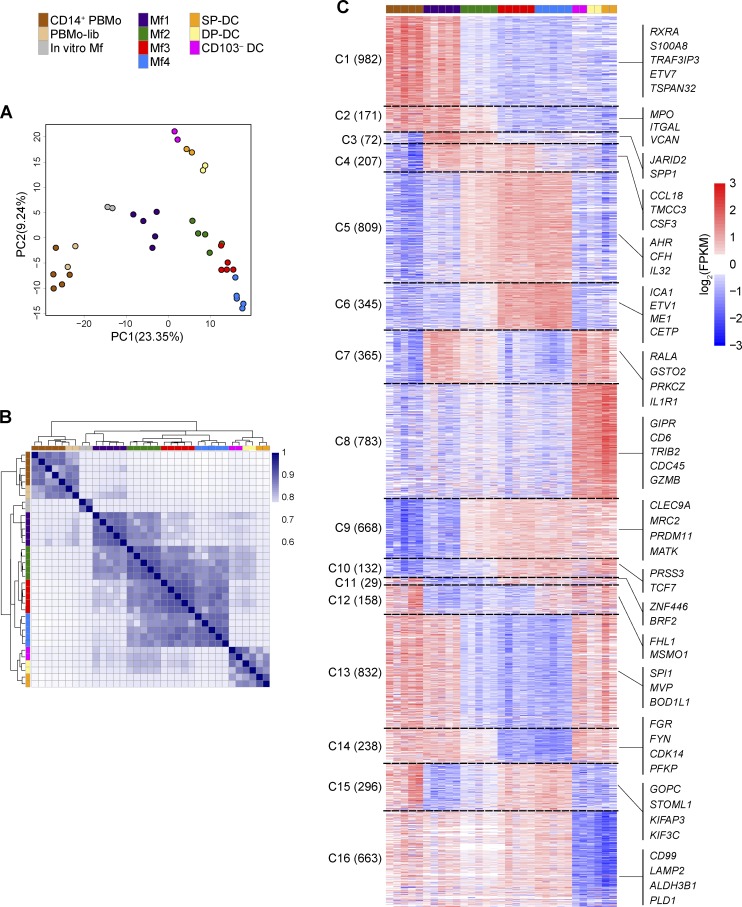
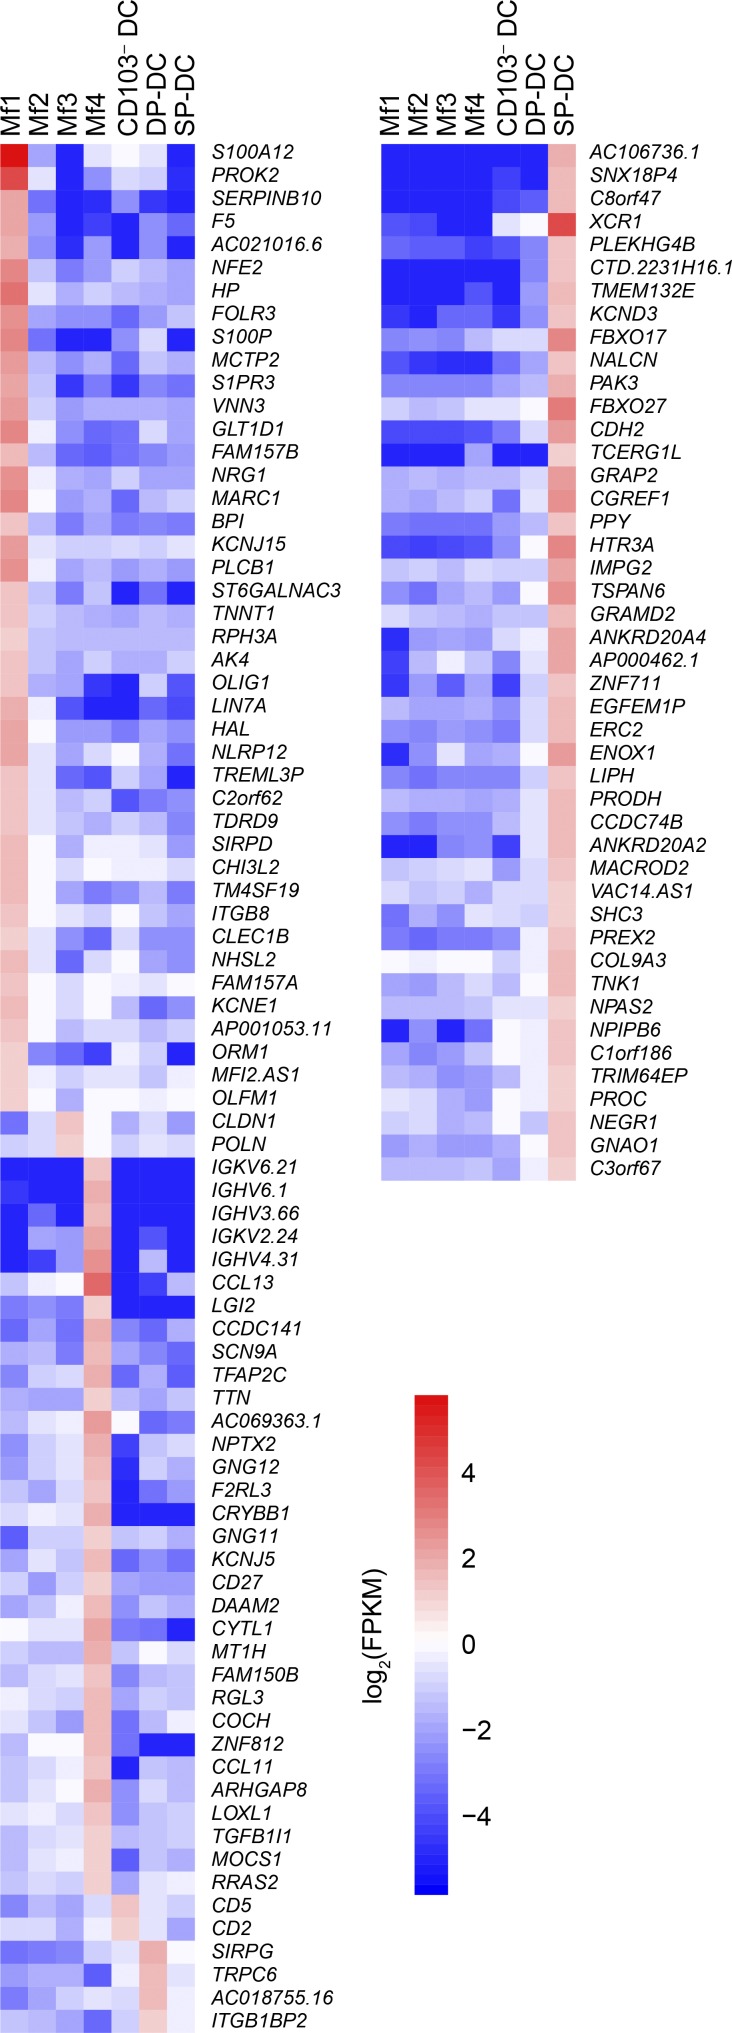
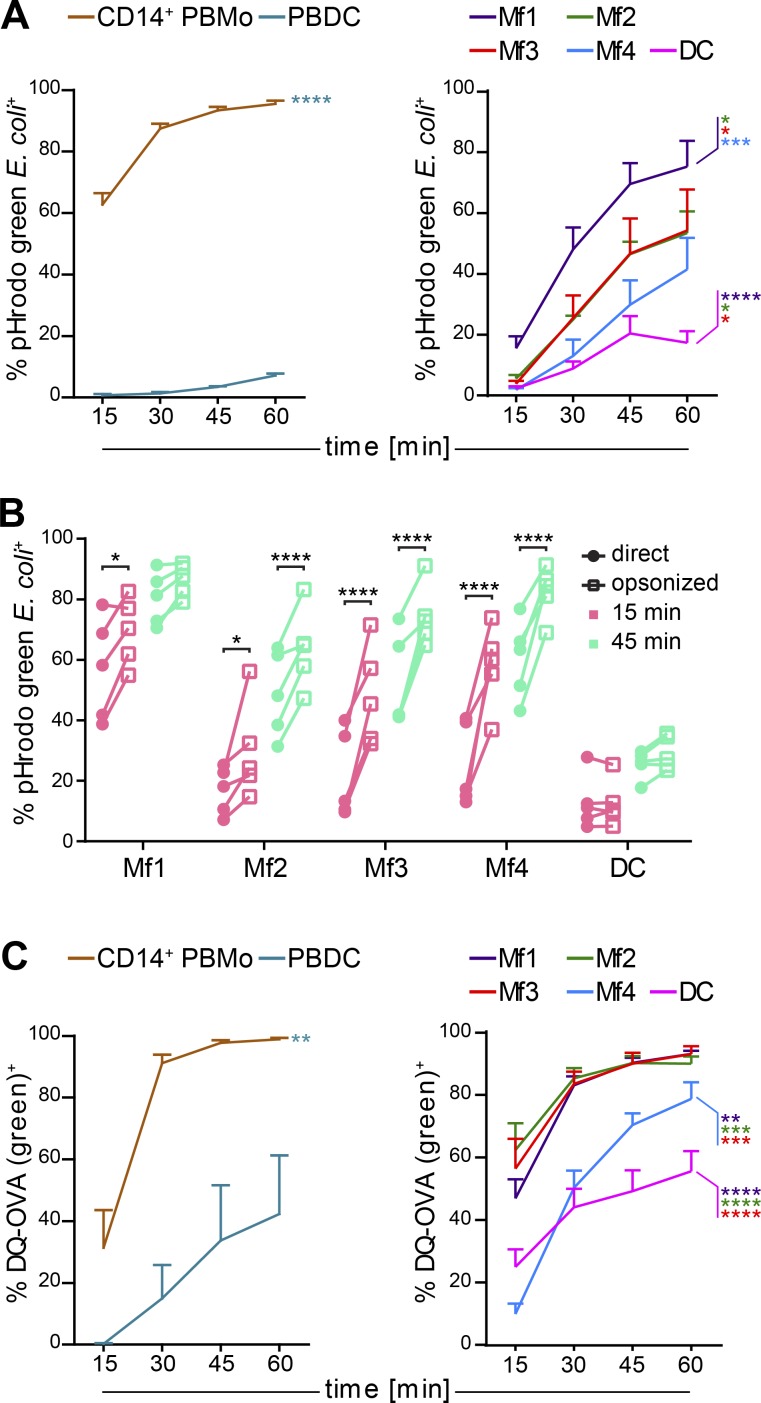
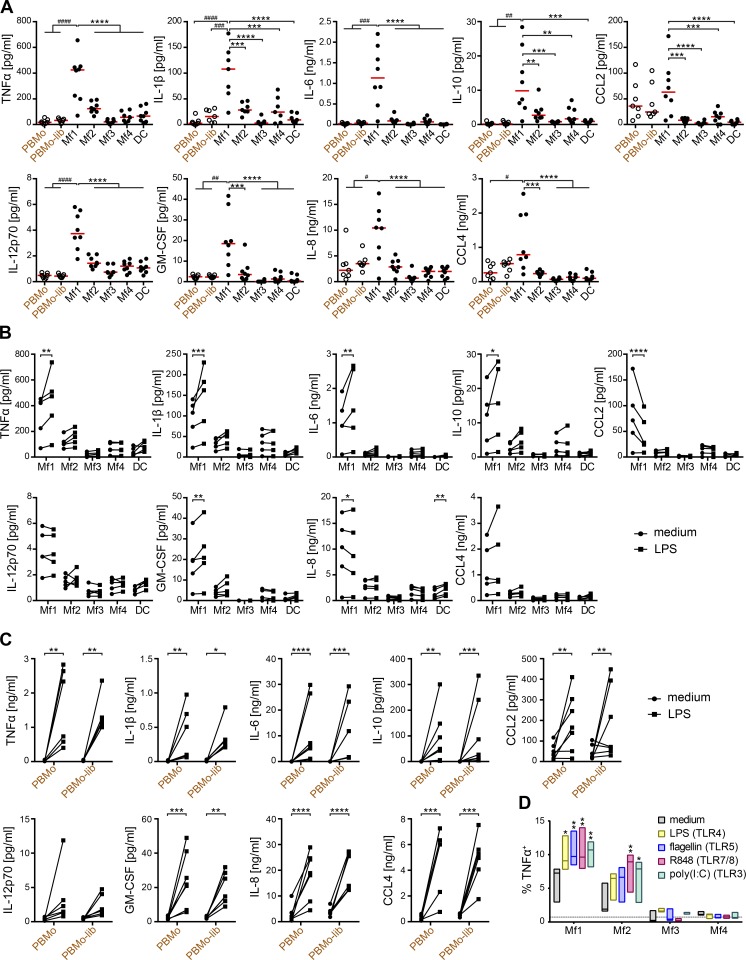
Macrophages (Mfs) are instrumental in maintaining immune homeostasis in the intestine, yet studies on the origin and heterogeneity of human intestinal Mfs are scarce. Here, we identified four distinct Mf subpopulations in human small intestine (SI). Assessment of their turnover in duodenal transplants revealed that all Mf subsets were completely replaced over time; Mf1 and Mf2, phenotypically similar to peripheral blood monocytes (PBMos), were largely replaced within 3 wk, whereas two subsets with features of mature Mfs, Mf3 and Mf4, exhibited significantly slower replacement. Mf3 and Mf4 localized differently in SI; Mf3 formed a dense network in mucosal lamina propria, whereas Mf4 was enriched in submucosa. Transcriptional analysis showed that all Mf subsets were markedly distinct from PBMos and dendritic cells. Compared with PBMos, Mf subpopulations showed reduced responsiveness to proinflammatory stimuli but were proficient at endocytosis of particulate and soluble material. These data provide a comprehensive analysis of human SI Mf population and suggest a precursor-progeny relationship with PBMos.


Figures

Figure 1.
Figure 1.
Human SI contains four distinct Mf subsets. (A) Representative flow cytometric analysis of human SI Mfs, identifying Mf1 (purple) and Mf2 (green, top right), Mf3 (red), and Mf4 (blue, bottom right), and DCs (pink, top center) among CD45+HLA-DR+ SI mononuclear phagocytes. Arrows indicate sequential gating (see Fig. S1 A for extended gating strategy). Dot plots are representative of all subjects. (B) The proportion of SI mononuclear phagocyte subsets given as percentage of all Mfs and DCs (CD45+HLA-DR+) was determined by flow cytometry; bars indicate median values (n = 55). (C) Representative micrographs of SI Mf subsets sorted by flow cytometry and stained with Hemacolor reagent. n = 2. Bars, 5 µm. (D) Representative dot plots showing FSC-A (size), SSC-A (granularity), and autofluorescence of SI Mf subsets and DCs. Autofluorescence was measured as fluorescence excited by a 488-nm laser and collected by a 530/30 bandpass filter, where matched fluorochrome was not included. Data are representative of all subjects. (E) Representative flow cytometric staining of surface markers on PBDC, CD14+ PBMo (n = 3 or more; gated as in Fig. S1 B), and SI Mf subsets and DCs (n = 4 or more). Gray histograms represent FMO controls.
Figure 2.
Figure 2.
Human SI Mf compartment comprises short- and long-lived subsets that differ in marker expression. (A) The percentage of CCR2+ cells among CD14+ PBMo (n = 5) and SI Mf subsets (n = 10) was determined by flow cytometry (left). Gates were set according to FMO controls. The expression of CCR2 mRNA was determined by RNaseq analysis; n = 5 (right). (B) The percentage of calprotectin+ cells among CD14+ PBMo (n = 7) and SI Mf subsets (n = 11) was determined by intracellular staining and flow cytometry. Gates were set according to staining with isotype control antibody. The expression levels of S100A8 and S100A9 mRNA were determined by RNaseq analysis; n = 5 (right). (C) The median fluorescence intensity (MFI) of CD209 relative to MFI of the FMO control on CD14+ PBMo (n = 5) and SI Mf subsets (n = 9) was determined by flow cytometry. The expression of CD209 mRNA was determined by RNaseq analysis; n = 5 (right). (A–C, left) Bars represent median values; ns, not significant (t test comparing CD14+ PBMo and Mf1). *, P < 0.05; ***, P < 0.001; ****, P < 0.0001 (RM-ANOVA of SI subsets). (A–C, right) Expression values (log2FPKM) were mean-centered by transcript. (D) Representative flow cytometric analysis of recipient-specific HLA-A2 staining on Mf subsets from transplanted duodenum 6 wk after transplantation. Numbers on plots represent recipient+ cells (mean ± SD from all patients analyzed at this time point; n = 5). Gray histograms represent staining of HLA-DR+ stromal cells from the same sample. (E) The percentage of recipient-derived cells in each Mf subset at 3 (n = 6), 6 (n = 5), and 52 wk (n = 6) after transplantation was determined by flow cytometry. Bars indicate median values. *, P < 0.05; ***, P < 0.001; ****, P < 0.0001 (two-way ANOVA with RM on population).
Figure 3.
Figure 3.
Mature Mf subsets localize to different compartments of the SI. (A) IF confocal micrograph from SI stained with CD209 (red), CD11c (blue), CD11b (green), and Hoechst DNA stain (gray). Dashed line marks the border between lamina propria and submucosa; bar, 50 µm. Individual channels from insets a, b, and c are displayed on the right; bars, 25 µm. Arrowheads (inset c) point to CD209+CD11c+CD11bhi (orange) and CD11blo (white) Mf2 cells. The micrograph is representative of six individual subjects. (B) The percentage of Mf3 (CD209+CD11cCD11b) and Mf4 (CD209+CD11cCD11b+) among total CD209+ cells in different compartments of intestinal mucosa as in A (n = 6). **, P < 0.01; ***, P < 0.001 (two-way RM-ANOVA comparing localization). (C) The proportion of Mf3 and Mf4 calculated as percentage of all Mfs and DCs (CD45+HLA-DR+) was determined by flow cytometry in lamina propria and submucosa separated before the digestion step (n = 3). (D) Representative flow cytometric analysis of cells isolated from muscularis propria. Arrows indicate sequential gating. Dot plots are representative of five subjects.
Figure 4.
Figure 4.
SI Mf subsets are distinguished by their gene expression patterns. (A) PCA of top 1,000 differentially expressed genes within CD14+ PBMo, PBMo-lib (enzyme-treated CD14+ PBMos), SI Mf, and DC subsets and in vitro differentiated Mfs. (B) Pearson correlation and hierarchical clustering analysis of CD14+ PBMo, PBMo-lib, SI Mf, and DC subsets and in vitro Mfs. Fig. S4 D lists all correlation values. (C) Polytomous analysis of differentially expressed genes among CD14+ PBMo and SI Mf and DC subsets, grouped into 16 clusters based on top models obtained from unsupervised clustering. Genes were assigned to a model based on the highest calculated posterior probability value (>0.65). Expression values are log2FPKM. Top-ranked genes from each cluster are listed on the right (full list available in Table S1). (A–C) CD14+ PBMos and SI Mfs were isolated from five donors, SI DC subsets from two of these. PBMo-lib were derived from two of the included CD14+ PBMo samples. In vitro Mfs were differentiated from PBMos of two separate healthy donors.
Figure 5.
Figure 5.
Specific gene expression in SI Mf and DC subsets. Mean expression values (log2FPKM) of genes found uniquely in a single SI Mf or DC subset in the polytomous analysis. Genes expressed at minimum 2 FPKM and more than twofold higher than in all other tissue populations were considered specific. SI Mfs were isolated from five donors, SI DC subsets from two of these.
Figure 6.
Figure 6.
SI Mfs are highly proficient at antigen uptake. (A) The percentage of pHrodo green E. coli+ cells among CD14+ PBMo, PBDC (left, n = 5), and SI Mf subsets and DCs (right, n = 5) was determined by flow cytometry after indicated incubation times. (B) The effect of preincubation with human serum (opsonization) on the uptake of pHrodo green E. coli bioparticles by SI Mf subsets and DCs was determined by flow cytometry after 15 or 45 min of incubation (n = 5). E. coli bioparticles were opsonized by incubating in 50% inactivated human serum for 30 min at 37°C. *, P < 0.05; ****, P < 0.0001 (two-way RM-ANOVA comparing effect of opsonization at one time point). (C) The percentage of DQ-OVA (green)+ cells among CD14+ PBMo, PBDC (left, n = 5), and SI Mf subsets and DCs (right, n = 5) was determined by flow cytometry after indicated incubation times. (A and C) Data are presented as mean ± SEM of pHrodo+ (A) or DQ-OVA+ (C) cells within each population (Fig. S4 A). Comparisons between subsets are marked in color corresponding to compared subset. *, P < 0.05; **, P < 0.01; ***, P < 0.001; ****, P < 0.0001 (two-way RM-ANOVA).
Figure 7.
Figure 7.
SI Mfs have attenuated cytokine production. (A) Spontaneous cytokine release by sorted SI Mf subsets and DCs (n = 8) and CD14+ PBMos and PBMo-lib (n = 7) was measured by a Bio-Plex assay in supernatants after 21 h of culture. Bars indicate median values. #, P < 0.05; ##, P < 0.01; ###, P < 0.001; ####, P < 0.0001 (ANOVA of PBMo, PBMo-lib, and Mf1). **, P < 0.01; ***, P < 0.001; ****, P < 0.0001 (RM-ANOVA of SI subsets). (B) Concentration of cytokines released spontaneously (dots) and after stimulation with 1 µg/ml LPS (squares) in supernatants after 21 h of culture of sorted SI Mf subsets and DCs (n = 5). *, P < 0.05; **, P < 0.01; ***, P < 0.001; ****, P < 0.0001 (two-way RM-ANOVA). (C) Concentration of cytokines released spontaneously (dots) and after stimulation with 1 µg/ml LPS (squares) in supernatants after 21 h of culture of sorted CD14+ PBMos and PBMo-lib (n = 6 or 7). *, P < 0.05; **, P < 0.01; ***, P < 0.001; ****, P < 0.0001 (two-way RM-ANOVA). (D) The percentage of TNFα+ cells in SI Mf subsets was determined by intracellular staining and flow cytometric analysis after 4 h of culture in medium only or containing LPS, flagellin, R848, or poly(I:C) (n = 3). Floating bars represent range, with a line indicating median. Dotted line represents background staining on Mf3 and Mf4 based on the fraction of cells found within the isotype control gate. *, P < 0.05; **, P < 0.01 compared with matched medium-only control (two-way RM-ANOVA).

Similar articles

Cited by

References

    1. Bain C.C., Scott C.L., Uronen-Hansson H., Gudjonsson S., Jansson O., Grip O., Guilliams M., Malissen B., Agace W.W., and Mowat A.M.. 2013. Resident and pro-inflammatory macrophages in the colon represent alternative context-dependent fates of the same Ly6Chi monocyte precursors. Mucosal Immunol. 6:498–510. 10.1038/mi.2012.89 - DOI - PMC - PubMed
    1. Bain C.C., Bravo-Blas A., Scott C.L., Perdiguero E.G., Geissmann F., Henri S., Malissen B., Osborne L.C., Artis D., and Mowat A.M.. 2014. Constant replenishment from circulating monocytes maintains the macrophage pool in the intestine of adult mice. Nat. Immunol. 15:929–937. 10.1038/ni.2967 - DOI - PMC - PubMed
    1. Beitnes A.C., Ráki M., Lundin K.E., Jahnsen J., Sollid L.M., and Jahnsen F.L.. 2011. Density of CD163+ CD11c+ dendritic cells increases and CD103+ dendritic cells decreases in the coeliac lesion. Scand. J. Immunol. 74:186–194. 10.1111/j.1365-3083.2011.02549.x - DOI - PubMed
    1. Beitnes A.C., Ráki M., Brottveit M., Lundin K.E., Jahnsen F.L., and Sollid L.M.. 2012. Rapid accumulation of CD14+CD11c+ dendritic cells in gut mucosa of celiac disease after in vivo gluten challenge. PLoS One. 7:e33556 10.1371/journal.pone.0033556 - DOI - PMC - PubMed
    1. Berg D.J., Davidson N., Kühn R., Müller W., Menon S., Holland G., Thompson-Snipes L., Leach M.W., and Rennick D.. 1996. Enterocolitis and colon cancer in interleukin-10-deficient mice are associated with aberrant cytokine production and CD4(+) TH1-like responses. J. Clin. Invest. 98:1010–1020. 10.1172/JCI118861 - DOI - PMC - PubMed

Publication types

MeSH terms