Stratification of knee osteoarthritis: two major patient subgroups identified by genome-wide expression analysis of articular cartilage
- PMID: 29273645
- PMCID: PMC5867416
- DOI: 10.1136/annrheumdis-2017-212603
Stratification of knee osteoarthritis: two major patient subgroups identified by genome-wide expression analysis of articular cartilage
Erratum in
-
Correction: Stratification of knee osteoarthritis: two major patient subgroups identified by genome-wide expression analysis of articular cartilage.Ann Rheum Dis. 2018 Jun;77(6):960. doi: 10.1136/annrheumdis-2017-212603corr1. Epub 2018 Apr 19. Ann Rheum Dis. 2018. PMID: 29674322 Free PMC article. No abstract available.
Abstract
Introduction: Osteoarthritis (OA) is a heterogeneous and complex disease. We have used a network biology approach based on genome-wide analysis of gene expression in OA knee cartilage to seek evidence for pathogenic mechanisms that may distinguish different patient subgroups.
Methods: Results from RNA-Sequencing (RNA-Seq) were collected from intact knee cartilage at total knee replacement from 44 patients with OA, from 16 additional patients with OA and 10 control patients with non-OA. Results were analysed to identify patient subsets and compare major active pathways.
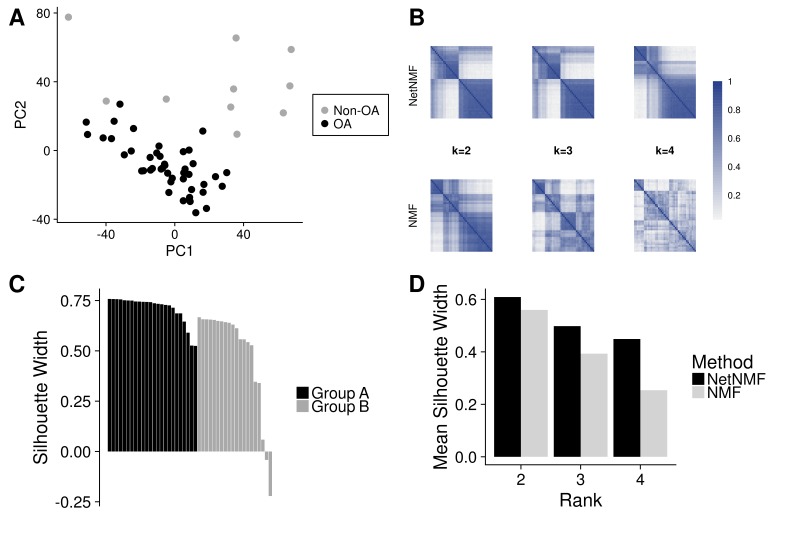
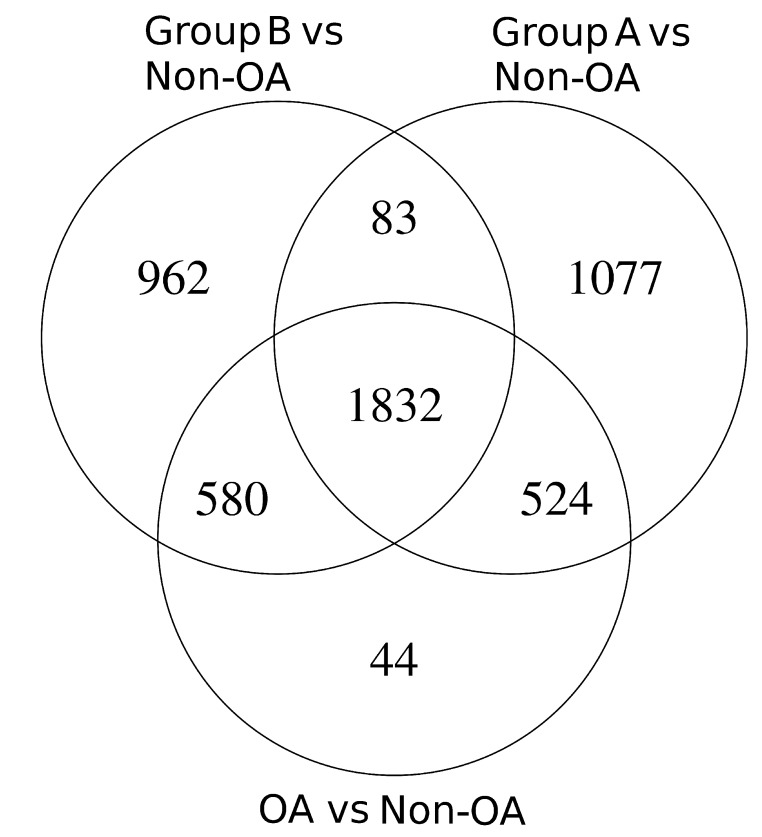
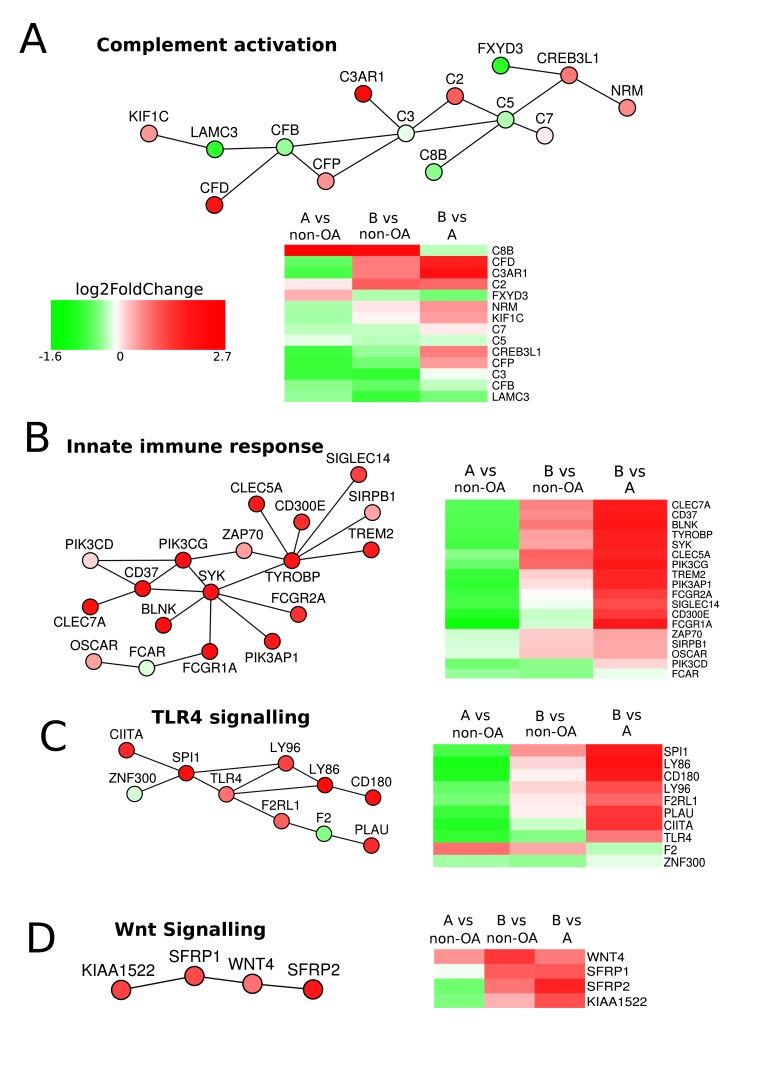
Results: The RNA-Seq results showed 2692 differentially expressed genes between OA and non-OA. Analysis by unsupervised clustering identified two distinct OA groups: Group A with 24 patients (55%) and Group B with 18 patients (41%). A 10 gene subgroup classifier was validated by RT-qPCR in 16 further patients with OA. Pathway analysis showed increased protein expression in both groups. PhenomeExpress analysis revealed group differences in complement activation, innate immune responses and altered Wnt and TGFβ signalling, but no activation of inflammatory cytokine expression. Both groups showed suppressed circadian regulators and whereas matrix changes in Group A were chondrogenic, in Group B they were non-chondrogenic with changes in mechanoreceptors, calcium signalling, ion channels and in cytoskeletal organisers. The gene expression changes predicted 478 potential biomarkers for detection in synovial fluid to distinguish patients from the two groups.
Conclusions: Two subgroups of knee OA were identified by network analysis of RNA-Seq data with evidence for the presence of two major pathogenic pathways. This has potential importance as a new basis for the stratification of patients with OA for drug trials and for the development of new targeted treatments.
Keywords: chondrocytes; disease activity; inflammation; knee osteoarthritis; osteoarthritis.
© Article author(s) (or their employer(s) unless otherwise stated in the text of the article) 2018. All rights reserved. No commercial use is permitted unless otherwise expressly granted.
Conflict of interest statement
Competing interests: None declared.
Figures