. 2017 Dec 22;7(1):18094.
doi: 10.1038/s41598-017-18352-4.

Alternative dominance of the parental genomes in hybrid cells generated through the fusion of mouse embryonic stem cells with fibroblasts

Affiliations

Alternative dominance of the parental genomes in hybrid cells generated through the fusion of mouse embryonic stem cells with fibroblasts

Natalia M Matveeva et al. Sci Rep. .

Abstract

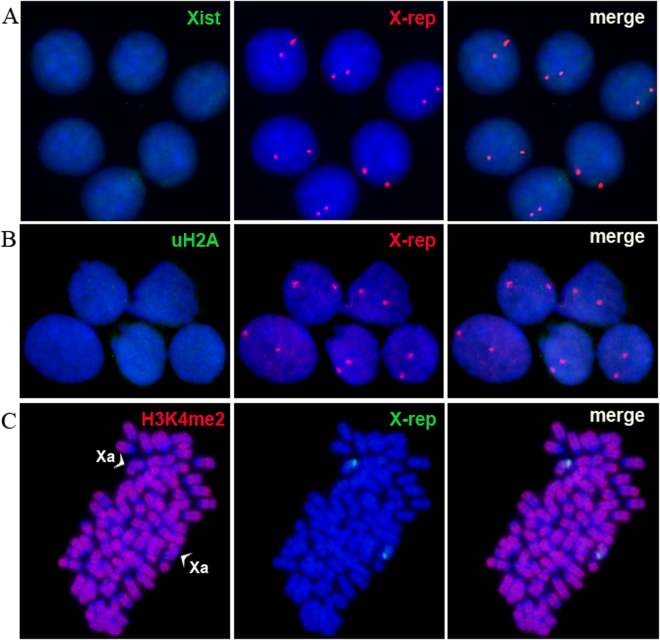
For the first time, two types of hybrid cells with embryonic stem (ES) cell-like and fibroblast-like phenotypes were produced through the fusion of mouse ES cells with fibroblasts. Transcriptome analysis of 2,848 genes differentially expressed in the parental cells demonstrated that 34-43% of these genes are expressed in hybrid cells, consistent with their phenotypes; 25-29% of these genes display intermediate levels of expression, and 12-16% of these genes maintained expression at the parental cell level, inconsistent with the phenotype of the hybrid cell. Approximately 20% of the analyzed genes displayed unexpected expression patterns that differ from both parents. An unusual phenomenon was observed, namely, the illegitimate activation of Xist expression and the inactivation of one of two X-chromosomes in the near-tetraploid fibroblast-like hybrid cells, whereas both Xs were active before and after in vitro differentiation of the ES cell-like hybrid cells. These results and previous data obtained on heterokaryons suggest that the appearance of hybrid cells with a fibroblast-like phenotype reflects the reprogramming, rather than the induced differentiation, of the ES cell genome under the influence of a somatic partner.


Conflict of interest statement

The authors declare that they have no competing interests.

Figures

Figure 1
Figure 1
Phenotypes of parental and hybrid cells: (A) A tau-GFP ES cell line; (B) An ES cell-like colony of hybrid cells at 7 d after cell fusion; (C) Hybrid cell clone tme14 with ES-like phenotype, 14 d after fusion; (D) A m5S cell line; (E) A colony of GFP-positive fibroblast-like hybrid cells at 7 d after fusion; (F) GFP-positive hybrid cell clone tmf5 with a fibroblast-like phenotype at 21 d after fusion. (G,J) Metaphase spreads of tau-GFP ES cells and m5S cells with near-diploid chromosome sets, respectively. Arrowheads show the Y-chromosome, and arrows show a marker chromosome in m5S cells. (H,K) Metaphase spreads of tetraploid tau-GPF4N and tetraploid m5S4N8 cells, respectively. (I,L) Metaphase spreads of tme13 and tmf2 hybrid cell clones with near-tetraploid chromosome sets, respectively. (M,N) IF staining of hybrid cells for ES cell specific markers, Oct4 and Nanog, respectively. The presence of Oct4 (red) is shown in the nuclei of tme17 hybrid cells, and the presence of Nanog (red) is shown in the nuclei of tme14 hybrid cells. (O,P) IF staining of hybrid cells for the fibroblast markers collagen type I and fibronectin, respectively. The presence of collagen (red) is shown in the cytoplasm of tmf1 cells, and the presence of fibronectin (red) is shown in the tmf5 cells. Cell nuclei are stained with DAPI (blue).
Figure 2
Figure 2
RNA-sequencing based transcriptome analyses of hybrid cells. (A) Hierarchical clusters based on the analysis of 23,361 genes expressed in tau-GPF4N, m5S4N8, tau-GFP ES cells, m5S cells and both tme and tmf hybrid cell types. (B) Bar-plot showing proportion of genes belonging to groups 1–4 in tme and tmf clones (see Results for group definitions). (C,D) Heat map of the gene expression profiles of the marker genes specific for ES cells (C) and fibroblasts (D) in hybrid cells of the tme and tmf series, tau-GPF4N and m5S4N8 cells. (E,F) Heat map presentation of gene-expression profiles of some genes keeping expression in tme hybrid cells similar to that in m5S4N cells (E) and genes maintaining expression in tmf hybrid cells similar to that in tau-GFP4N cells (F). For (CF) the colors represent log10FPKM + 1 values according to the scale shown at the bottom. Expression levels of the Loxl2 (G), the Hmga2 (H), the Crabp2 (I) and the Xist (J) genes in hybrid cell clones and parental cells. The Y-axis represents FPKM values for corresponding genes.
Figure 3
Figure 3
X-chromosome inactivation in the tmf series hybrid cells. (A) Xist RNA cloud (green) co-localizes with one of the two X-chromosomes, which were visualized by a repeat probe (red). (B) Exclusion of H3K4me2 (green) attributable to inactive chromatin from one of the two X-chromosomes (red). (C) Enrichment of an inactive X-chromosome with Н3K27me3 (green). X- and Y-chromosomes were recognized by X- and Y-specific repeats (both in red). (D) Cloud of ubiquitinated H2A (uH2A, green) co-localizes with one of the two X-chromosomes (red). (E) Nuclear region enriched with uH2A (green) after subsequent RNA FISH shows exclusion (indicated with arrows) of Cot1 DNA probe (red), which hybridizes with all unspliced gene transcripts within the nuclei.
Figure 4
Figure 4
Tetraploid XXOO m5S4N8 cells maintain two active X-chromosomes. (A) No Xist RNA signal (green) on X-chromosomes (red) in tetraploid XXOO m5S4N8 cells. (B) No uH2A enrichment detected on X-chromosomes (red) in tetraploid XXOO m5S4N8 cells. (C) Both X-chromosomes (green) in tetraploid XXOO cells are positive for the active chromatin marker Н3K4me2 (red). Arrowheads point to active X chromosomes (Xa).
Figure 5
Figure 5
Tetraploid ES cell-like tme hybrid cells and their differentiated derivatives maintain two active X-chromosomes. (A) A pinpoint Xist signal (green) is revealed on each X-chromosome (red) in tme cells. (B) No Xist RNA signal (green) detected on X-chromosomes (red) in tme cells after 14 d of in vitro differentiation. (C) Both X-chromosomes (red) in differentiated tme cells are positive for the active chromatin marker Н3K4me2 (green). Arrowheads indicate active X (Xa) and Y-chromosomes.

Similar articles

Cited by

References

    1. Matveeva NM, et al. In vitro and in vivo study of pluripotency in intraspecific hybrid cells obtained by fusion of murine embryonic stem cells with splenocytes. Mol. Reprod. Dev. 1998;50:128–138. doi: 10.1002/(SICI)1098-2795(199806)50:2<128::AID-MRD2>3.0.CO;2-M. - DOI - PubMed
    1. Tada M, Takahama Y, Abe K, Nakatsuji N, Tada T. Nuclear reprogramming of somatic cells by in vitro hybridization with ES cells. Curr Biol. 2001;11:1553–1558. doi: 10.1016/S0960-9822(01)00459-6. - DOI - PubMed
    1. Cowan CA, Atienza J, Melton DA, Eggan K. Nuclear reprogramming of somatic cells after fusion with human embryonic stem cells. Science. 2005;309:1369–1373. doi: 10.1126/science.1116447. - DOI - PubMed
    1. Serov OL, Matveeva NM, Khabarova AA. Reprogramming Mediated by CellFusion Technology. Int. Rev. Cell Mol. Biol. Vol 291. 2011;291:155–190. doi: 10.1016/B978-0-12-386035-4.00005-7. - DOI - PubMed
    1. Battulin NR, et al. Reprogramming somatic cells by fusion with embryonic stem cells does not cause silencing of the Dlk1-Dio3 region in mice. World J. Stem Cells. 2012;4:87–93. doi: 10.4252/wjsc.v4.i8.87. - DOI - PMC - PubMed

Publication types

LinkOut - more resources