The sleep EEG spectrum is a sexually dimorphic marker of general intelligence
- PMID: 29273758
- PMCID: PMC5741768
- DOI: 10.1038/s41598-017-18124-0
The sleep EEG spectrum is a sexually dimorphic marker of general intelligence
Abstract
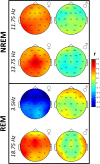
The shape of the EEG spectrum in sleep relies on genetic and anatomical factors and forms an individual "EEG fingerprint". Spectral components of EEG were shown to be connected to mental ability both in sleep and wakefulness. EEG sleep spindle correlates of intelligence, however, exhibit a sexual dimorphism, with a more pronounced association to intelligence in females than males. In a sample of 151 healthy individuals, we investigated how intelligence is related to spectral components of full-night sleep EEG, while controlling for the effects of age. A positive linear association between intelligence and REM anterior beta power was found in females but not males. Transient, spindle-like "REM beta tufts" are described in the EEG of healthy subjects, which may reflect the functioning of a recently described cingular-prefrontal emotion and motor regulation network. REM sleep frontal high delta power was a negative correlate of intelligence. NREM alpha and sigma spectral power correlations with intelligence did not unequivocally remain significant after multiple comparisons correction, but exhibited a similar sexual dimorphism. These results suggest that the neural oscillatory correlates of intelligence in sleep are sexually dimorphic, and they are not restricted to either sleep spindles or NREM sleep.
Conflict of interest statement
The authors declare that they have no competing interests.
Figures


Similar articles
-
Sleep EEG functional connectivity varies with age and sex, but not general intelligence.Neurobiol Aging. 2019 Jun;78:87-97. doi: 10.1016/j.neurobiolaging.2019.02.007. Epub 2019 Feb 21. Neurobiol Aging. 2019. PMID: 30884412
-
The sleep EEG as a marker of intellectual ability in school age children.Sleep. 2011 Feb 1;34(2):181-9. doi: 10.1093/sleep/34.2.181. Sleep. 2011. PMID: 21286251 Free PMC article.
-
Nap sleep spindle correlates of intelligence.Sci Rep. 2015 Nov 26;5:17159. doi: 10.1038/srep17159. Sci Rep. 2015. PMID: 26607963 Free PMC article.
-
The visual scoring of sleep and arousal in infants and children.J Clin Sleep Med. 2007 Mar 15;3(2):201-40. J Clin Sleep Med. 2007. PMID: 17557427 Review.
-
Wake and Sleep EEG in Patients With Huntington Disease: An eLORETA Study and Review of the Literature.Clin EEG Neurosci. 2017 Jan;48(1):60-71. doi: 10.1177/1550059416632413. Epub 2016 Apr 19. Clin EEG Neurosci. 2017. PMID: 27094758 Review.
Cited by
-
Scale-free and oscillatory spectral measures of sleep stages in humans.Front Neuroinform. 2022 Oct 3;16:989262. doi: 10.3389/fninf.2022.989262. eCollection 2022. Front Neuroinform. 2022. PMID: 36262840 Free PMC article.
-
The relationship between cognitive ability and BOLD activation across sleep-wake states.Brain Imaging Behav. 2022 Feb;16(1):305-315. doi: 10.1007/s11682-021-00504-w. Epub 2021 Aug 25. Brain Imaging Behav. 2022. PMID: 34432229
-
Association Between EEG Power During Sleep and Attention Levels in Patients with Major Depressive Disorder.Nat Sci Sleep. 2024 Jun 21;16:855-864. doi: 10.2147/NSS.S464055. eCollection 2024. Nat Sci Sleep. 2024. PMID: 38933526 Free PMC article.
-
Multivariate prediction of cognitive performance from the sleep electroencephalogram.Neuroimage. 2023 Oct 1;279:120319. doi: 10.1016/j.neuroimage.2023.120319. Epub 2023 Aug 12. Neuroimage. 2023. PMID: 37574121 Free PMC article.
-
Sleep-physiological correlates of brachycephaly in dogs.Brain Struct Funct. 2023 Dec;228(9):2125-2136. doi: 10.1007/s00429-023-02706-y. Epub 2023 Sep 24. Brain Struct Funct. 2023. PMID: 37742302 Free PMC article.
References
Publication types
MeSH terms
LinkOut - more resources
Full Text Sources
Other Literature Sources

