. 2018 Jan;21(1):72-80.
doi: 10.1038/s41593-017-0022-z. Epub 2017 Nov 20.

Reducing the RNA binding protein TIA1 protects against tau-mediated neurodegeneration in vivo

Affiliations

Reducing the RNA binding protein TIA1 protects against tau-mediated neurodegeneration in vivo

Daniel J Apicco et al. Nat Neurosci. 2018 Jan.

Abstract

Emerging studies suggest a role for tau in regulating the biology of RNA binding proteins (RBPs). We now show that reducing the RBP T-cell intracellular antigen 1 (TIA1) in vivo protects against neurodegeneration and prolongs survival in transgenic P301S Tau mice. Biochemical fractionation shows co-enrichment and co-localization of tau oligomers and RBPs in transgenic P301S Tau mice. Reducing TIA1 decreased the number and size of granules co-localizing with stress granule markers. Decreasing TIA1 also inhibited the accumulation of tau oligomers at the expense of increasing neurofibrillary tangles. Despite the increase in neurofibrillary tangles, TIA1 reduction increased neuronal survival and rescued behavioral deficits and lifespan. These data provide in vivo evidence that TIA1 plays a key role in mediating toxicity and further suggest that RBPs direct the pathway of tau aggregation and the resulting neurodegeneration. We propose a model in which dysfunction of the translational stress response leads to tau-mediated pathology.


Conflict of interest statement

Conflict of Interest Statement: Benjamin Wolozin is Co-Founder and Chief Scientific Officer for Aquinnah Pharmaceuticals Inc.

Figures

Figure 1
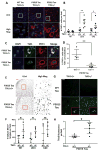
Figure 1. TIA1 reduction decreases cytoplasmic stress granules in PS19 mice while increasing nuclear TIA1
A. Immunoblot of TIA1 from total brain lysates of 3 month old P301S Tia1+/+ and P301S Tia1+/− mice. B. Quantification of relative TIA1 protein level normalized to β-actin from A. **p=0.0095 by unpaired Student’s t-test (n=5/group). C. IHC of DAPI (blue), TIA1 (green), and PABP (red) in 9 month Layer II LEnt. Scale bar = 5 μm. D. Quantification of the number of cytoplasmic puncta per cell co-positive for the SG markers TIA1 and PABP (arrows) from C. **P<0.01 by 1-way ANOVA with Tukey’s post-hoc tests (n=4 mice/group, at least 20 cells imaged per mouse). E–F. Quantification of total nuclear (E) and cytoplasmic (F) TIA1 immunofluorescence from C. ***p<0.001 by unpaired Student’s t-test. G–H. IHC of the RNA transport granule marker Staufen (G, red) and the P-body marker DCP1A (H, green) in 9 month P301S Tia1+/+ and P301S Tia1+/− frontal cortex. Scale bar = 10 μm. I–K. Quantification of total Staufen immunofluorescence (I), total DCP1A immunofluorescence (J), and number of cytoplasmic DCP1A granules (K) per cell in G and H. ***P<0.001 by unpaired Student’s t-test (n=4 mice/group, at least 20 cells imaged per mouse). Error bars represent means ± SEM. The immunoblots in panel 1A are cropped; full gel pictures for all immunoblots are shown in Supplemental Figures 16–21.
Figure 2
Figure 2. TIA1 reduction rescues synaptic and axonal loss in PS19 mice
A. IHC of NeuN (green) and synaptophysin (SYP, red) in the CA3 region of 6 month non-transgenic (WT Tau) and PS19 (P301S Tau) hippocampus. Scale bar = 20 μm. B. Quantification of relative SYP expression from A. *P=0.0135 **P=0.0067 by 2-way ANOVA with Tukey’s post-hoc test (n=15–31 images/group, from at least 6 mice/group). C. Immunoblot of total tau (Tau13) detected in microtubule (MT)-bound (pellet, P) and unbound (supernatant, S) fractions in 6 and 9 month WT and PS19 cortex. D. Quantification of the relative ratio of MT-bound to MT-unbound tau at 9 months in A (normalized to the average level in P301S Tia1+/+ mice equal to 1). *p=0.0138 by Student’s t-test (n=4/group). Error bars denote means ± SEM. The immunoblots in panel 2C are cropped.
Figure 3
Figure 3. TIA1 reduction protects against neurodegeneration in PS19 mice
A. Representative Nissl stain of CA3 in 9 month (m) non-transgenic (WT tau) and PS19 (P301S tau) mice. Scale bar = 20 μm. B–C. Quantification of number of Nissl+ (B) and NeuN+ (C) neurons per field in C. *P<0.05 **P<0.01 by 2-way ANOVA with Tukey’s post-hoc tests (n=at least 4/group). D. Representative images of cortical layers I through VI in 9 month non-transgenic and PS19 cerebral cortex (primary somatosensory cortex, S1). Scale bar = 100 μm. Red asterisks and arrowheads denote the start of Layer II and end of Layer III, respectively. E. Quantification of average Layer II/III cortical thickness in S1 from D. **P<0.01 by 2-way ANOVA with Tukey’s post-hoc tests (n=at least 11/group). Error bars denote means ± SEM.
Figure 4
Figure 4. TIA1 reduction improves memory and prolongs lifespan in PS19 mice
A. Percent correct alternations in the Y maze spontaneous alternation task (SAT) for 6 month non-transgenic (WT Tau) and PS19 (P301S Tau) mice. *P=0.0213 **P=0.0072 by 2-way ANOVA with Tukey’s post-hoc test (n=16–20 mice/group). Error bars denote means ± SEM. B. The novel object recognition (NOR) task was used to assess recognition memory in non-transgenic and PS19 mice. Preference index (PI) for each mouse was determined by dividing the amount of time spent exploring the novel object by the total amount of time spent exploring both objects (PI = 100 * (Tnovel/Tnovel + Tfamiliar). *p<0.05 by 2-Way ANOVA with Tukey’s post-hoc comparisons (n=8–15 mice/group). Error bars denote means ± SEM. C. Total distance traveled over time in the Open Field (OF) locomotor activity task. Main effect of P301S tau transgene (***P<0.001) by 2-way ANOVA; P301S Tia1+/+ and P301S Tia1+/− plots are not statistically different by Tukey’s post-hoc test. D. Kaplan-Meier survival curve of P301S Tia1+/+ (n=20, median lifespan=9.3 months) compared to P301S Tia1+/− (n=23, median lifespan=11.3 months) mice. ***P<0.001 by the Log-rank Mantel-Cox test. Hazard ratio (Tia1+/+:Tia1+/−) = 2.411.
Figure 5
Figure 5. TIA1 reduction leads to an age-dependent increase in tau phosphorylation
A. IHC of DAPI (blue) and PHF1 (S396/S404) phospho-tau in the lateral entorhinal cortex (LEnt) of 9 month old P301S Tia1+/+ and P301S Tia1+/− mice. Scale bar = 10 μm. B. Quantification of number of PHF1+ cells in D. *P=0.0483 **P=0.0028 by unpaired Student’s T-tests (n=6/group). C. Confocal images of PHF1+ cells in P301S Tia1+/+ and P301S Tia1+/− LEnt. Scale bar = 2 μm. D. Quantification of the percentage of PHF1+ cells with TIA1 co-localization in F. **P=0.0074 by Student’s t-test (n=4/group). E. Representative images of Gallyas Silver stained neurofibrillary tangles in 9 month P301S Tia1+/+ and P301S Tia1+/− mice. Scale bar = 40 μm. F. Quantification of number of Gallyas Silver+ tangles in the frontal cortex (primary motor area, M1), lateral entorhinal cortex (LEnt), and CA3. *P<0.05 by unpaired Student’s T-tests (n=4/group). G. Representative images of LEnt from 9 month non-transgenic and PS19 mice stained with thioflavine S (ThioS). Scale bar = 20 μm. Red inserts denote high magnification images of ThioS+ tangles in P301S Tia1+/+ and P301S Tia1+/− LEnt. H. Quantification of ThioS fluorescence in G. *P=0.0213 by Student’s t-test (n=6/group). Error bars denote means ± SEM.
Figure 6
Figure 6. TIA1 reduction shifts the biochemical and structural properties of tau aggregation
A. Immunoblot for total tau (Tau13) in the S1p (top) and P3 (bottom) fractions of 6 and 9 month P301S Tia1+/+ and P301S Tia1+/− cortex. Each lane corresponds to a different mouse from the cohort. B–C. Quantification of tau accumulation in the S1p (B) and P3 (C) fractions in A. #p=0.1508 *p=0.0289 **p=0.0018 ***p=0.0005 by unpaired Student’s T-tests (n=3/group). Error bars denote mean ± SEM. The immunoblots in panel 6A are cropped.
Figure 7
Figure 7. TIA1 inhibits tau fibrillization while increasing tau oligomerization
A. Thioflavine T (ThioT) fluorescence assay of GSK3β-phosphorylated recombinant tau protein (pTau, 10 μM) incubated with dextran sulfate (DS, 0.04 μg/μl) and RNA (20 ng/μl) go induce aggregation ± recombinant TIA1 protein (2 μM). The presence of TIA1 in the reaction mixture significantly reduced the amount of ThioT fluorescence. ***P<0.001 by repeated measures 2-Way ANOVA with Tukey’s post-hoc comparisons (n=4/group). B. TOC1 level detected by ELISA in ThioT reaction mixtures after 48 h in the absence (Tau + Ctrl) and presence of TIA1 (Tau + TIA1). 2 μM bovine serum albumin (BSA) was used as a control. *P<0.05 by unpaired Student’s t-test (n=5/group). C. Representative transmission electron microscopy (EM) of pTau assembly reactions incubated ± TIA1. Scale Bar = 500 nm. Bottom panels represent high magnification images to visualize fibril length and structure. D. Quantification of fibril lengths from C. ***P<0.001 by 1-Way ANOVA with Tukey’s post-hoc comparisons (n=4/group; at least 100 fibrils measured per condition). Error bars denote means ± SEM. Experiments in this figure have been replicated three times.

Comment in

References

    1. Gitler AD, Shorter J. RNA-binding proteins with prion-like domains in ALS and FTLD-U. Prion. 2011;5:179–187. - PMC - PubMed
    1. Ash PE, Vanderweyde TE, Youmans KL, Apicco DJ, Wolozin B. Pathological stress granules in Alzheimer’s disease. Brain Res. 2014;1584:52–58. - PMC - PubMed
    1. Banani SF, Lee HO, Hyman AA, Rosen MK. Biomolecular condensates: organizers of cellular biochemistry. Nat Rev Mol Cell Biol. 2017;18:285–298. - PMC - PubMed
    1. Feric M, et al. Coexisting Liquid Phases Underlie Nucleolar Subcompartments. Cell. 2016;165:1686–1697. - PMC - PubMed
    1. Anderson P, Kedersha N. Stress granules: the Tao of RNA triage. Trends Biochem Sci. 2008;33:141–150. - PubMed

Publication types

MeSH terms