. 2017 Dec 22;8(1):2256.
doi: 10.1038/s41467-017-02358-7.

TNFα blockade overcomes resistance to anti-PD-1 in experimental melanoma

Affiliations

TNFα blockade overcomes resistance to anti-PD-1 in experimental melanoma

Florie Bertrand et al. Nat Commun. .

Abstract

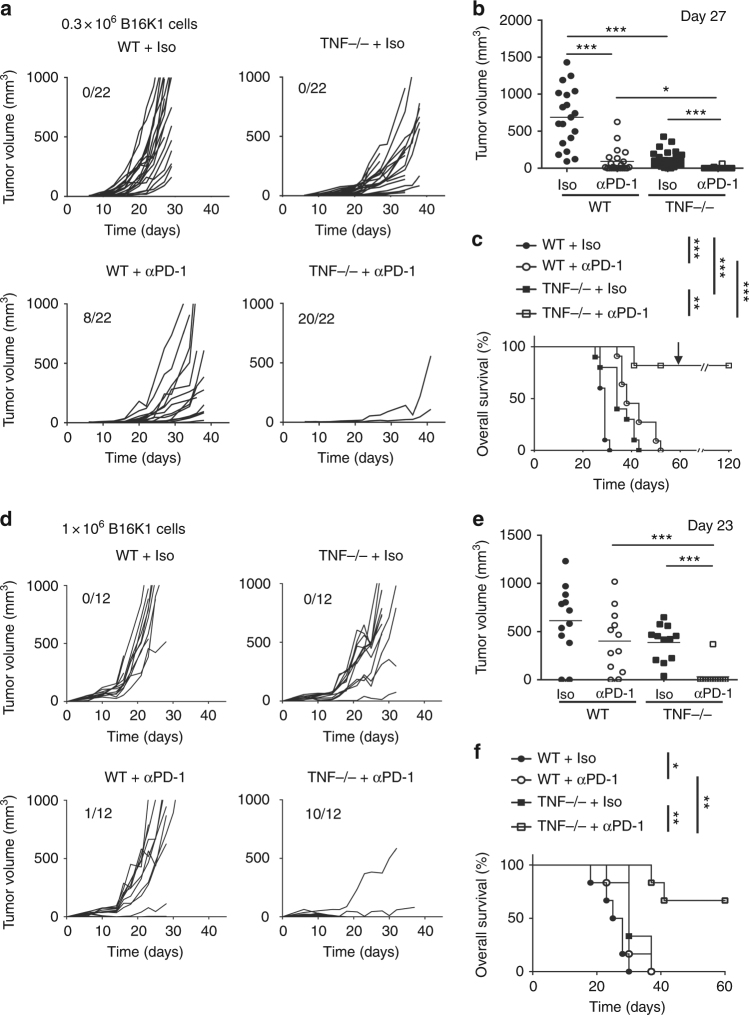
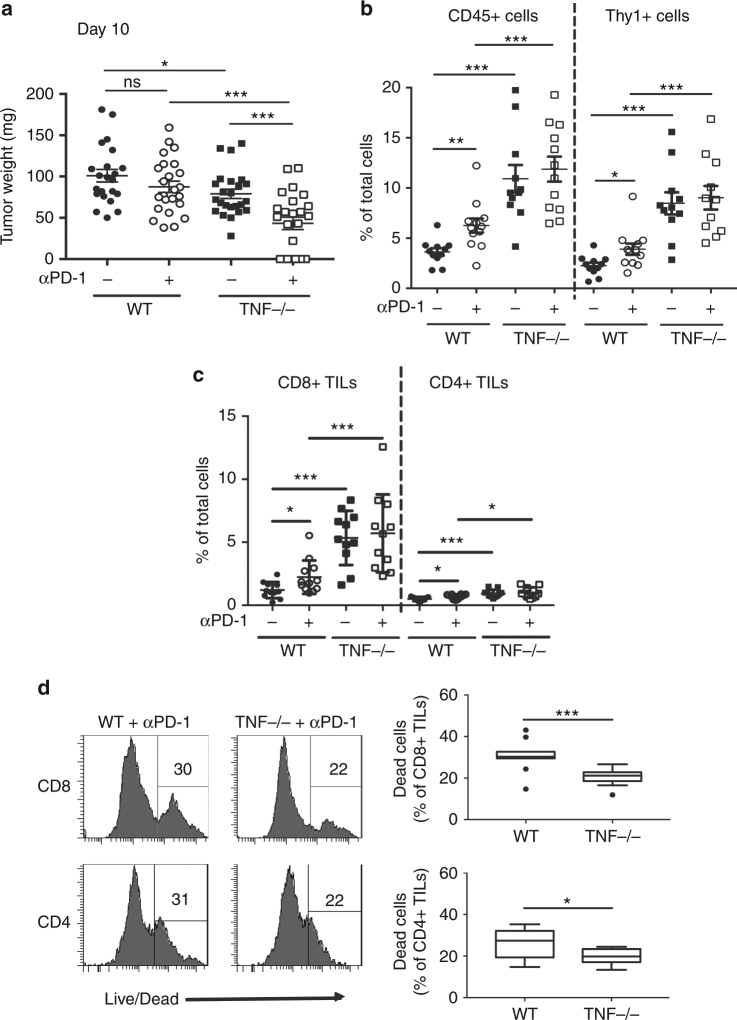
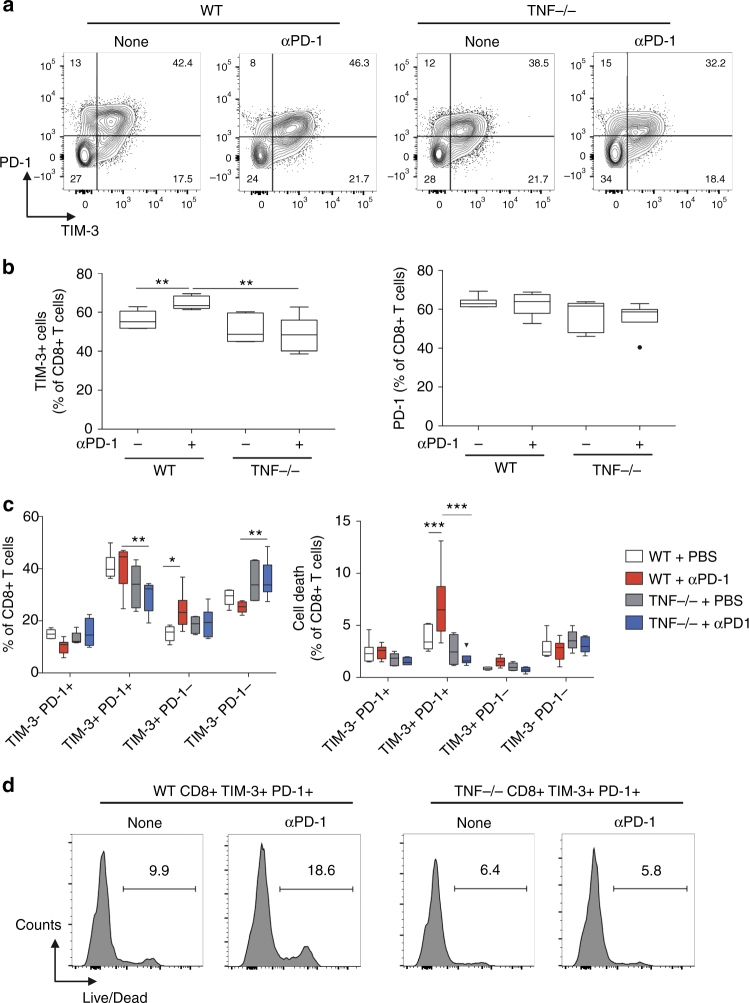
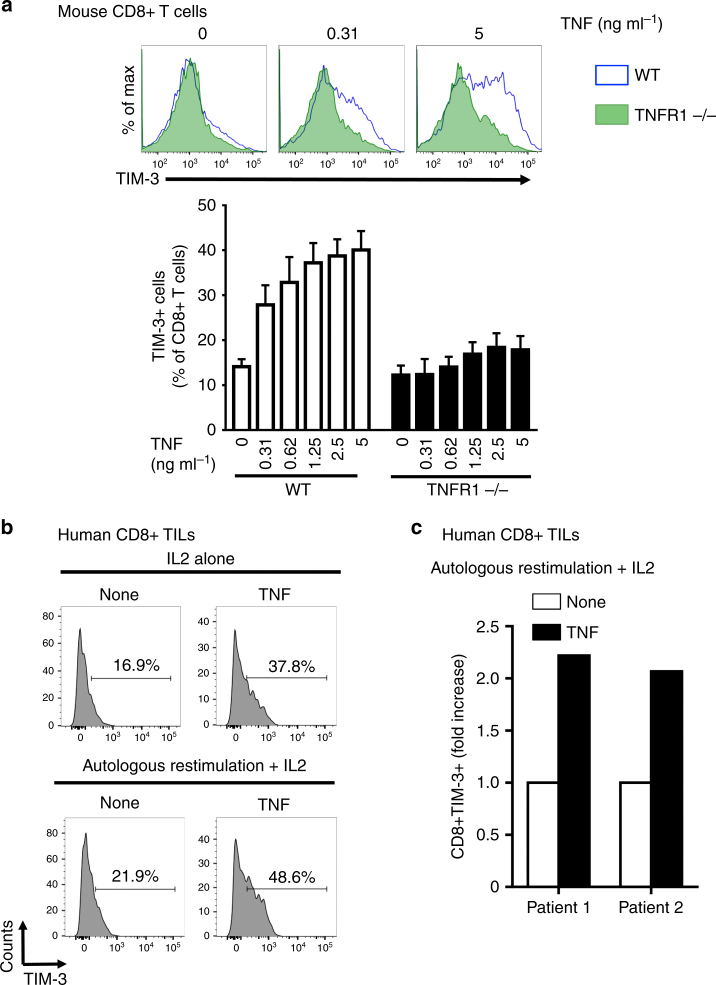
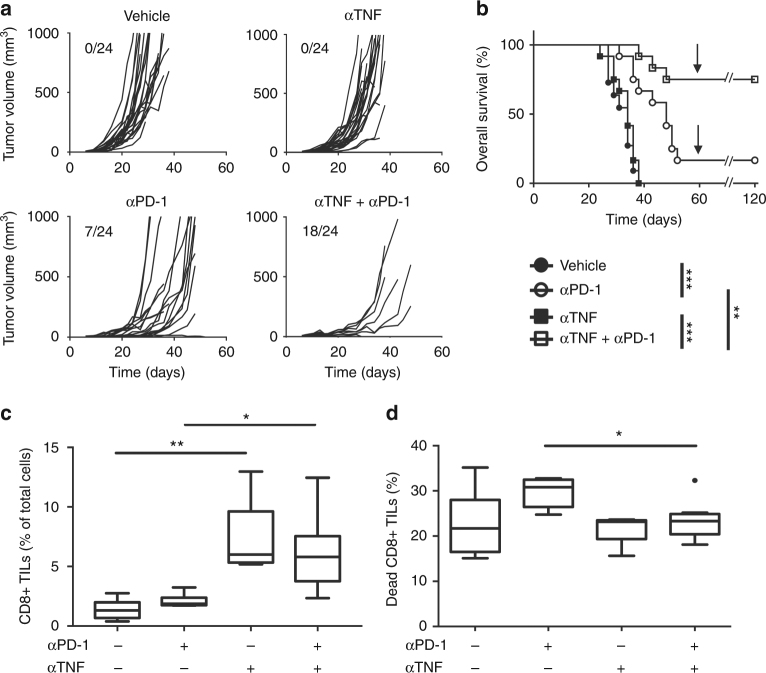
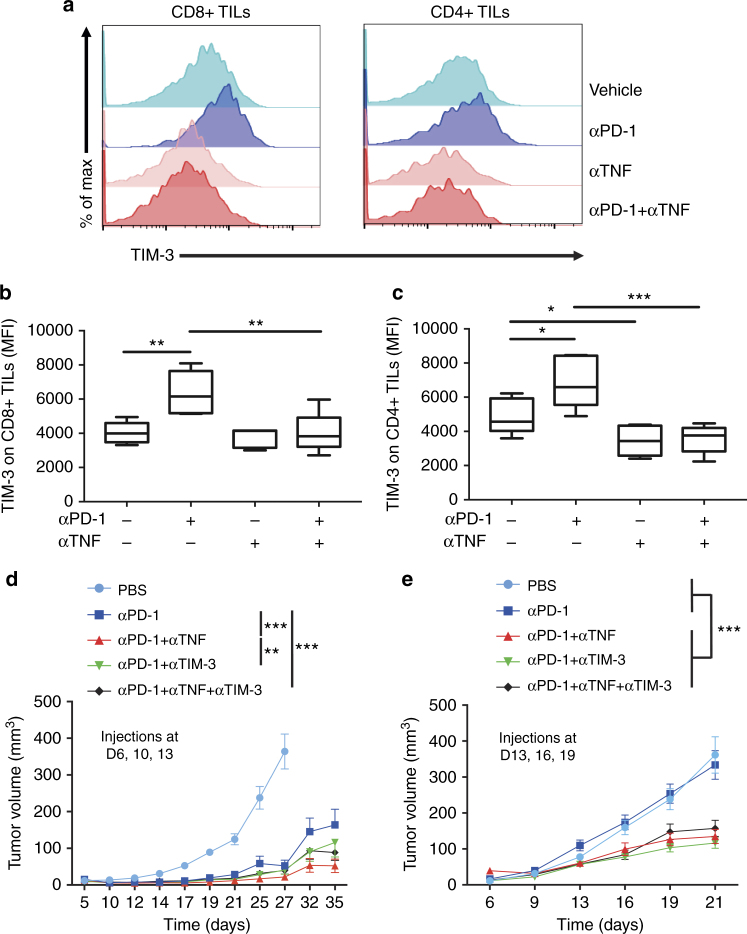
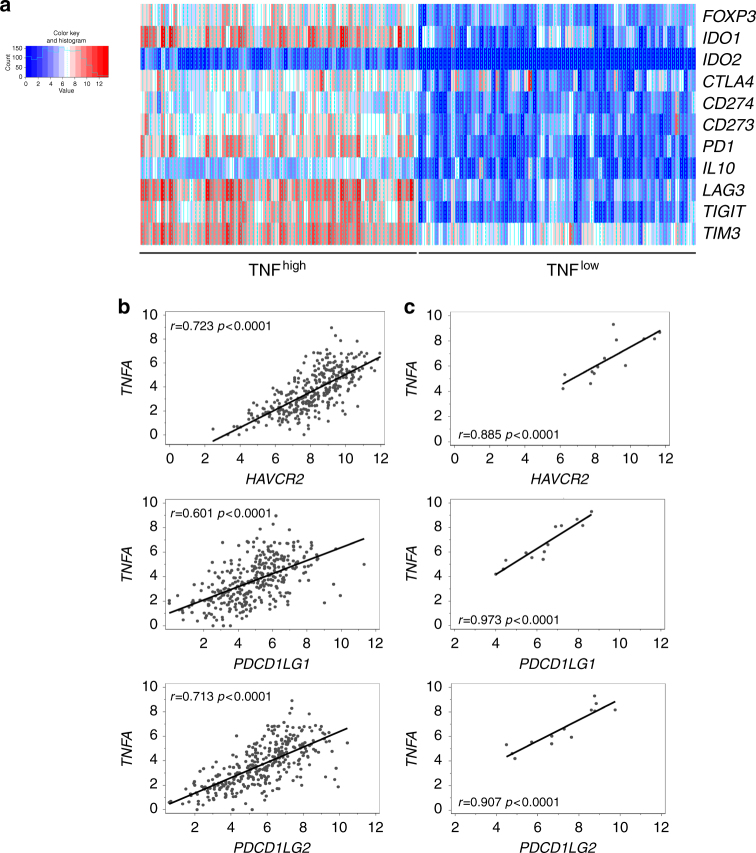
Antibodies against programmed cell death-1 (PD-1) have considerably changed the treatment for melanoma. However, many patients do not display therapeutic response or eventually relapse. Moreover, patients treated with anti-PD-1 develop immune-related adverse events that can be cured with anti-tumor necrosis factor α (TNF) antibodies. Whether anti-TNF antibodies affect the anti-cancer immune response remains unknown. Our recent work has highlighted that TNFR1-dependent TNF signalling impairs the accumulation of CD8+ tumor-infiltrating T lymphocytes (CD8+ TILs) in mouse melanoma. Herein, our results indicate that TNF or TNFR1 blockade synergizes with anti-PD-1 on anti-cancer immune responses towards solid cancers. Mechanistically, TNF blockade prevents anti-PD-1-induced TIL cell death as well as PD-L1 and TIM-3 expression. TNF expression positively correlates with expression of PD-L1 and TIM-3 in human melanoma specimens. This study provides a strong rationale to develop a combination therapy based on the use of anti-PD-1 and anti-TNF in cancer patients.


Conflict of interest statement

Nicolas Meyer has worked as an investigator and/or consultant and/or speaker for: BMS, MSD, Amgen, Roche, GSK, Novartis, Pierre Fabre. The rest of the authors declare no competing financial interests.

Figures

Fig. 1
Fig. 1
TNF deficiency enhances anti-PD-1 response in a mouse melanoma model. C57BL/6 wild-type (WT) and TNF-deficient (TNF−/−) mice were intradermally and bilaterally grafted with 3 × 105 (ac) (n = 11 mice per group) or 1 × 106 (df) (n = 6 mice per group). B16K1 melanoma cells prior to intraperitoneal injection of anti-PD-1 antibodies (αPD-1, 10 mg kg−1) or a relevant isotype control (Iso, 10 mg kg−1) at days 6, 10 and 13. a and d Tumor volumes were determined with a calliper. Individual curves are depicted for each tumor. Numbers indicate complete tumor regression out of total tumors. Data are from three independent experiments. b and e Tumor volumes determined at the indicated days for individual tumors are depicted. Bars represent mean values ± s.e.m. (Mann–Whitney U test: *p < 0.05; **p < 0.01; ***p < 0.001). c and f Cumulative survival curves (Logrank test: *p < 0.05; **p < 0.01; ***p < 0.001). At day 60, surviving mice were challenged with a second B16K1 injection as indicated by the arrow; mice did not develop tumors and survived (c)
Fig. 2
Fig. 2
Immune cell infiltration of tumors from anti-PD-1 treated wild-type and TNF-deficient mice with established melanoma. ac, C57BL/6 wild-type (WT) and TNF-deficient (TNF−/−) mice were intradermally and bilaterally grafted with 1 × 106 B16K1 melanoma cells prior to intraperitoneal injection of anti-PD-1 antibodies (αPD-1, 10 mg kg−1) or vehicle (PBS) at day 7. a At day 10, mice were sacrificed and tumors were weighed. Data are means ± s.e.m. of at least 22 tumors per group from two independent experiments (Student’s t-test: *p < 0.05; ***p < 0.001). b and c TIL content was analysed by flow cytometry. The proportion of CD45+ and Thy1+ cells (b) CD4+ and CD8+ TILs (c) among total cells was determined. Data are means ± s.e.m. of at least 11 tumors per group from two independent experiments (Mann–Whitney U test: *p < 0.05; **p < 0.01; ***p < 0.001). d Proportion of dead CD8+ and CD4+ TILs from WT and TNF-deficient mice treated with anti-PD-1. Left panels: representative stainings. Right panels: values measured in 12 tumors per group from two independent experiments are represented as Tukey boxes (Student’s t-test: *p < 0.05; ***p < 0.001)
Fig. 3
Fig. 3
Anti-PD-1 triggers TIM-3 expression on CD8+ TILs in a TNF-dependent manner. WT and TNF-deficient mice were injected as described in the legend to Fig. 2. TIM-3 and PD-1 expression on CD8+ TILs was determined by flow cytometry at day 10. a Representative staining; values indicate the proportion of cells in the different quadrants. b Quantification of the proportion of TIM-3+ (left panel) and PD-1+ (right panel) among CD8+ TILs. c Quantification of the proportion of CD8+ TILs expressing or not TIM-3 and PD-1 (left panel), and proportion of cell death among CD8+ T cells of the indicated populations (right panel). Values in 5–6 mice per group from one experiment are represented as Tukey boxes (b: Student’s t-test: **p < 0.01; c: two-way Anova: ***p < 0.001). d Representative histograms of live/dead staining in CD8+ TILs expressing both TIM-3 and PD-1. Values are percentages of dead cells among the TIM-3+ PD-1+ CD8+ TILs
Fig. 4
Fig. 4
TNF induces TIM-3 expression on CD8+ T cells ex vivo. a WT or TNFR1-deficient CD8+ T cells were incubated with murine TNF for 2 days. TIM-3 expression was next analysed by flow cytometry. Upper panels: representative histograms. Lower panel: data are means ± s.e.m. of three independent experiments. b and c TILs from two human metastatic melanoma patients were cultured with or without autologous melanoma cells for two days in the presence 200 U ml−1 IL-2 +/−50 ng ml−1 human TNF. TIM-3 expression was next analysed by flow cytometry: histograms showing TIM-3 staining on TILs from patient 1 (b); bar graph depicting the fold increase in TIM-3 expression on TILs from patients 1 and 2 (c)
Fig. 5
Fig. 5
Anti-TNF treatment enhances anti-PD-1 response in a mouse melanoma model. C57BL/6 wild-type (WT) mice were intradermally grafted with 3 × 105 B16K1 melanoma cells followed by intraperitoneal injection of anti-TNF antibodies (αTNF, 10 mg kg−1) or vehicle (PBS) at days 6, 9, 13 and 16 and/or anti-PD-1 (10 mg kg−1) at days 6, 9 and 13 (n = 12 mice per group). Data are from two independent experiments. a Individual tumor volumes are depicted. Numbers indicate complete tumor regression out of total tumors. b Cumulative survival curves. At day 60, (arrow) surviving mice were challenged with a second B16K1 injection; these mice did not develop tumors and survived (Logrank test: **p < 0.01; ***p < 0.001). c and d C57BL/6 WT mice were intradermally and bilaterally grafted with 1 × 106 B16K1 melanoma cells prior to intraperitoneal injection of anti-TNF (αTNF, 10 mg kg−1) or vehicle at days 5 and 7, and with anti-PD-1 antibodies (αPD-1, 10 mg kg−1) or vehicle (PBS) at day 7. At day 10, CD8+ TILs (c) and the proportion of cell death in CD8+ TILs (d) were analysed by flow cytometry. Data from at least 5 tumors per group are represented as Tukey boxes (Mann–Whitney U test: *p < 0.05; **p < 0.01)
Fig. 6
Fig. 6
TNF blockade prevents TIM-3 up-regulation on TILs in response to anti-PD-1. WT mice were injected as described in the legend to Fig. 5. ac TIM-3 expression level on CD8+ TILs and CD4+ TILs was determined by flow cytometry on tumors from WT mice at day 10 after B16K1 graft following injection of vehicle (PBS), anti-PD-1 (αPD-1), anti-TNF (αTNF) or a combination of both. Representative stainings (a) mean fluorescence intensity (MFI) of TIM-3 on CD8+ (b) and CD4+ TILs (c) measured in at least 5 tumors per group from one experiment are represented as Tukey boxes. b, c: Mann–Whitney U test: *p < 0.05; **p < 0.01; ***p < 0.001). d and e C57BL/6 WT mice were intradermally and bilaterally grafted with 3 × 105 B16K1 melanoma cells prior to injection with vehicle, anti-PD-1 alone or combined with anti-TNF and/or anti-TIM-3 (10 mg kg−1 of each antibody) at days 6, 10, and 13 (d) (PBS (n = 12), αPD-1 (n = 9), αPD-1 + αTNF (n = 14), αPD-1 + αTIM-3 (n = 13), αPD-1 + αTNF + αTIM-3 (n = 15), data from two experiments) or at days 13, 16, and 19 (e) (n = 10 mice per group, data from one representative experiment out of two). Tumor volumes were determined with a calliper. Data are means ± s.e.m. (d) and e, two-way Anova: **p < 0.01, ***p < 0.001 at day 35 (d) and day 21 (e); p = 0.08 at day 35 when comparing anti-PD-1 alone and anti-PD-1 plus anti-TIM-3 (d)
Fig. 7
Fig. 7
TNF expression is associated with an immune escape gene signature in human metastatic melanoma. a Heatmap for a selected list of genes encoding immune escape proteins in metastatic melanoma patients from the TCGA melanoma cohort (n = 342), exhibiting high (80th percentile) and low (20th percentile) TNF expression in melanoma samples. Genes were clustered using a Euclidean distant matrix and average linkage clustering. b and c Correlation analysis between the expression of HAVCR2 (encoding TIM-3), PDCD1LG1 (encoding PD-L1), PDCD1LG2 (encoding PD-L2) and TNFA (encoding TNF) in melanoma samples from metastatic melanoma patients from the TCGA cohort (n = 342) (b) and from patients treated with anti-PD-1 (our analysis of data published in ref.) (n = 13) (c)

References

    1. Bertrand F, Colacios C, Segui B. TNF-R1, an immune checkpoint in melanoma? Genes Cancer. 2015;6:369–370. - PMC - PubMed
    1. Bertrand F, et al. Targeting TNF alpha as a novel strategy to enhance CD8+ T cell-dependent immune response in melanoma? Oncoimmunology. 2016;5:e1068495. doi: 10.1080/2162402X.2015.1068495. - DOI - PMC - PubMed
    1. Balkwill F. Tumour necrosis factor and cancer. Nat. Rev. Cancer. 2009;9:361–371. doi: 10.1038/nrc2628. - DOI - PubMed
    1. Carswell EA, et al. An endotoxin-induced serum factor that causes necrosis of tumors. Proc. Natl. Acad. Sci. USA. 1975;72:3666–3670. doi: 10.1073/pnas.72.9.3666. - DOI - PMC - PubMed
    1. Ratner A, Clark WR. Role of TNF-alpha in CD8+ cytotoxic T lymphocyte-mediated lysis. J. Immunol. 1993;150:4303–4314. - PubMed

Publication types

MeSH terms