. 2018 Mar 1;596(5):901-919.
doi: 10.1113/JP275317. Epub 2018 Jan 24.

Optogenetic dissection of roles of specific cortical interneuron subtypes in GABAergic network synchronization

Affiliations

Optogenetic dissection of roles of specific cortical interneuron subtypes in GABAergic network synchronization

Andrew S Bohannon et al. J Physiol. .

Abstract

Key points: An increase in the excitability of GABAergic cells has typically been assumed to decrease network activity, potentially producing overall anti-epileptic effects. Recent data suggest that inhibitory networks may actually play a role in initiating epileptiform activity. We show that activation of GABAergic interneurons can elicit synchronous long-lasting network activity. Specific interneuron subpopulations differentially contributed to GABA network synchrony, indicating cell type-specific contributions of interneurons to cortical network activity. Interneurons may critically contribute to the generation of aberrant network activity characteristic of epilepsy, warranting further investigation into the contribution of distinct cortical interneuron subpopulations to the propagation and rhythmicity of epileptiform activity.

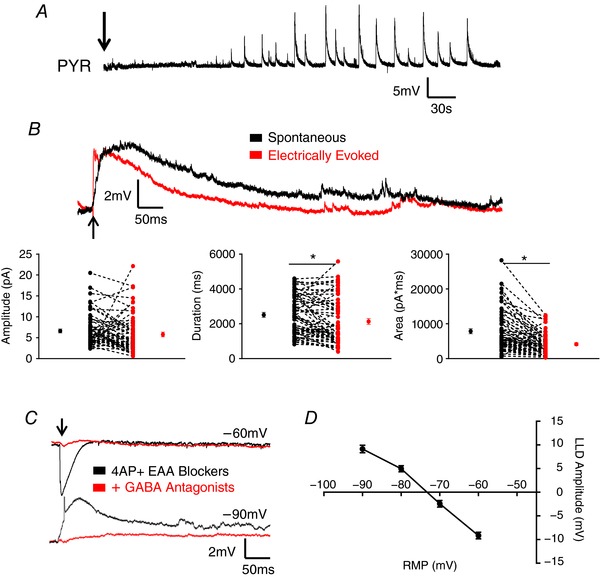
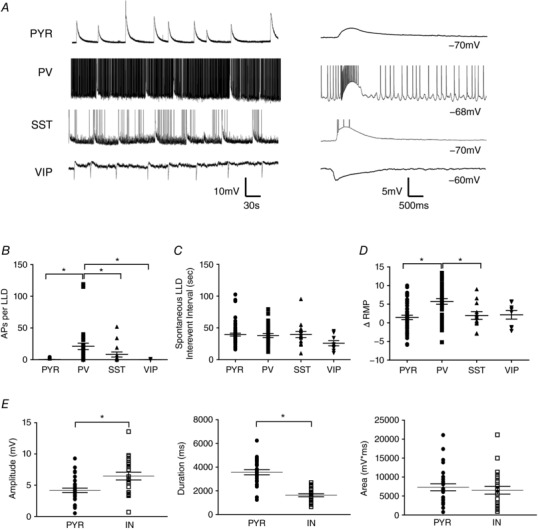
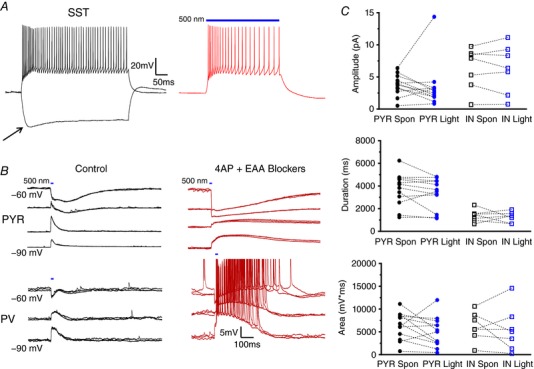
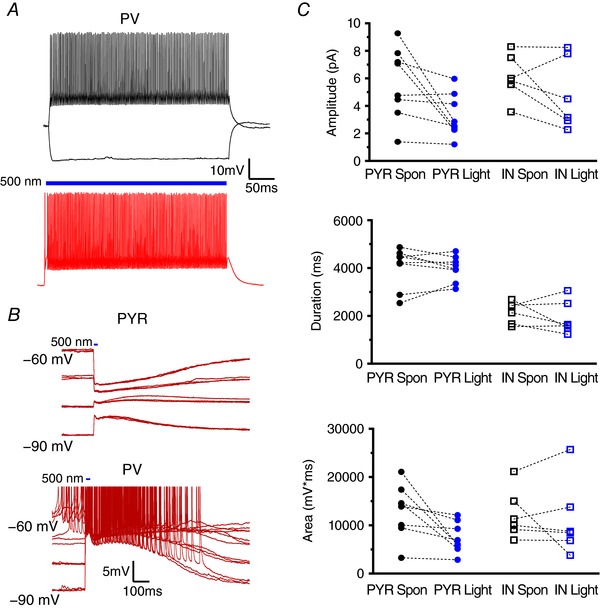
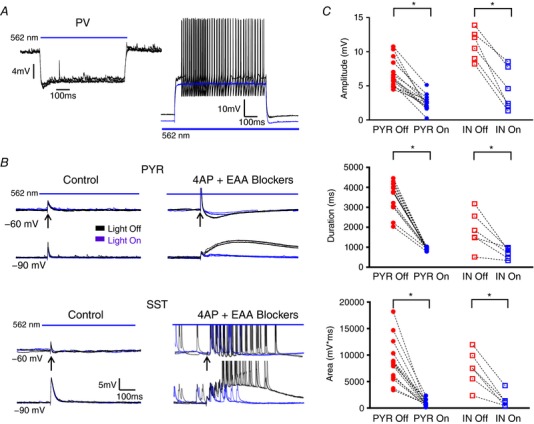
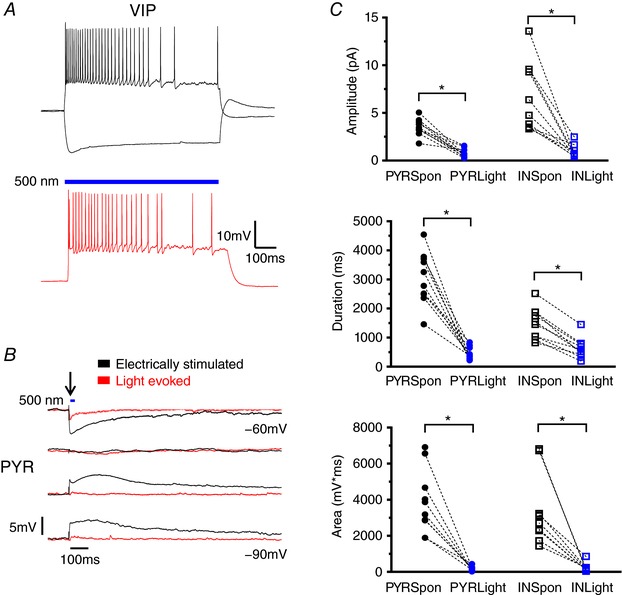
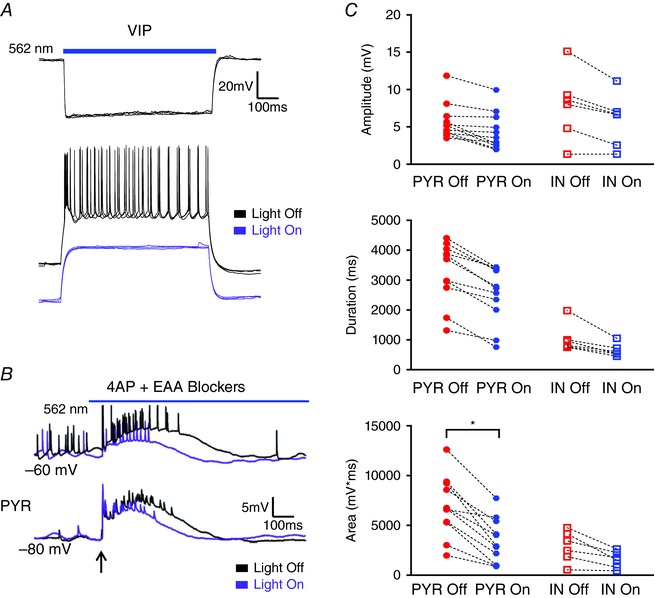
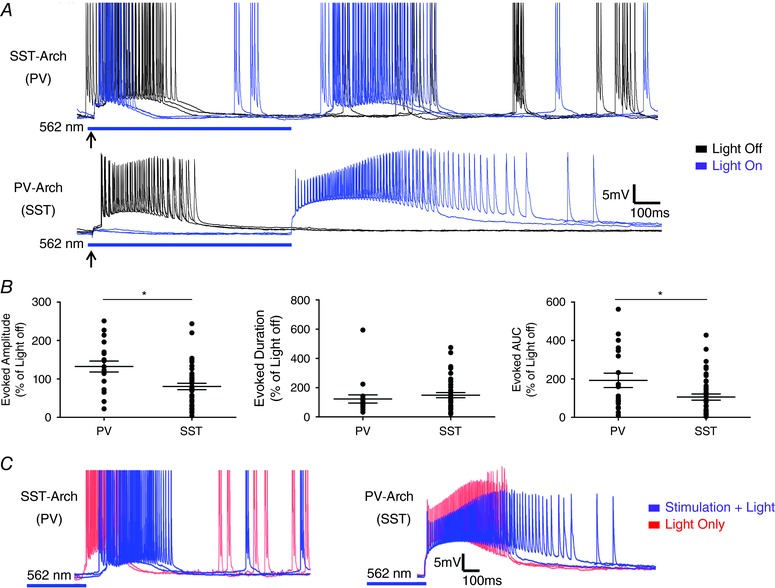
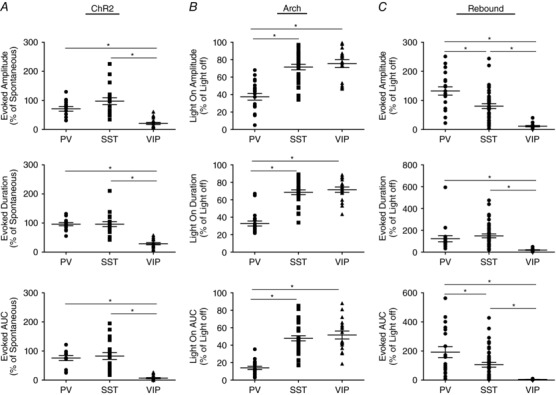
Abstract: In the presence of the A-type K+ channel blocker 4-aminopyrdine, spontaneous synchronous network activity develops in the neocortex of mice of either sex. This aberrant synchrony persists in the presence of excitatory amino acid receptor antagonists (EAA blockers) and is considered to arise from synchronous firing of cortical interneurons (INs). Although much attention has been given to the mechanisms underlying this GABAergic synchrony, the contribution of specific IN subtypes to the generation of these long-lasting discharges (LLDs) is incompletely understood. We employed genetically-encoded channelrhodopsin and archaerhodopsin opsins to investigate the sufficiency and necessity, respectively, of activation of parvalbumin (PV), somatostatin (SST) and vasointestinal peptide (VIP)-expressing INs for the generation of synchronous neocortical GABAergic discharges. We found light-induced activation of PV or SST INs to be equally sufficient for the generation of LLDs, whereas activation of VIP INs was not. By contrast, light-induced inhibition of PV INs strongly reduced LLD initiation, whereas suppression of SST or VIP IN activity only partially attenuated LLD magnitude. These results suggest neocortical INs perform cell type-specific roles in the generation of aberrant GABAergic cortical network activity.

Keywords: interneurone; neocortex; synchronization.


Figures

Figure 1
Figure 1. Application of 4AP + EAA blockers induces GABA‐mediated synchronous network activity
A, bath application of 4AP + EAA induces spontaneous synchronized network activity in PYRs. An arrow indicates the start of drug wash‐on. B, upper: representative traces showing spontaneous and electrically evoked LLDs in a PYR. Electrical stimulation evokes activity of similar amplitude to spontaneous LLDs but smaller in duration and AUC. An arrow indicates the time of stimulation. Lower: quantitative comparison of electrically evoked versus spontaneously occurring LLDs. Mean ± SEM are shown, as well as the results from individual cells. C, example traces of evoked LLDs in presence of 4AP + EAA blockers with and without GABA receptor antagonists. An arrow indicates the timing of stimulation. D, calculation of LLD reversal potential. * P < 0.05, paired t test. Each shape represents an individual cell. Error bars are the mean ± SEM. [Color figure can be viewed at wileyonlinelibrary.com]
Figure 2
Figure 2. Cell type‐specific properties of spontaneous LLDs
A, example traces of spontaneous LLDs recorded from a PYR cell and different IN subtypes. Continuously recorded events are shown on the left, with individual events shown on an expanded timescale to the right. LLDs recorded from VIP INs were hyperpolarizing because the RMP of those cells was depolarized relative to the LLD reversal potential. B, cell type comparison of the number of APs superimposed on spontaneous LLDs. C, spontaneous LLDs occurred with the same temporal profile in all cell types. D, application of 4AP + EAA blockers caused a depolarization of all recorded cell types. E, quantitative comparison of spontaneous LLD amplitude (left), duration (middle) and AUC (right) in PYRs and INs. * P < 0.05, Tukey's post hoc test. Each shape represents an individual cell. Error bars are the mean ± SEM.
Figure 3
Figure 3. Activation of SST INs is sufficient to initiate LLDs
A, example traces of SST IN firing properties elicited by current injection (left) or light activation (right). Arrow indicates I h sag typical of SST cells. B, representative traces displaying activity evoked by a 10 ms light pulse in drug‐free aCSF (left) and after 4AP + EAA blockers wash‐on (right). Activity recorded in PYRs (top) and INs (bottom) was similar, although spontaneous APs were more frequently observed in INs. C, quantitative analysis comparing amplitude, duration and AUC of light‐evoked events with those occurring spontaneously. Bars indicate the timing and duration of light pulses. Each symbol represents an individual cell. Error bars are the mean ± SEM. [Color figure can be viewed at wileyonlinelibrary.com]
Figure 4
Figure 4. Suppression of SST IN activity reduces evoked LLD magnitude
A, example traces of membrane hyperpolarization induced by light activation of Arch (left) and superimposed traces showing SST cell responses to a depolarizing current injection with and without light activation (right). The SST IN was hyperpolarized by illumination and AP initiation blocked. B, superimposed traces of electrically evoked activity recorded from a PYR (top) and IN (bottom) with or without concurrent slice illumination in control aCSF (left) and after 4AP + EAA blockers wash‐on (right). Arrows indicate the time of stimulation. C, light inactivation of SST INs significantly reduced the amplitude, duration and AUC of evoked LLDs. * P < 0.05, Tukey's post hoc test. Bars indicate the timing and duration of light pulses. Each shape represents an individual cell. Error bars are the mean ± SEM. [Color figure can be viewed at wileyonlinelibrary.com]
Figure 5
Figure 5. PV IN activation is sufficient to initiate LLDs
A, example traces of PV IN firing properties elicited by current injection (upper) or light activation (lower). B, representative traces displaying activity evoked, at arrow, by a 10 ms light pulse after 4AP + EAA blockers wash‐on. Activity recorded in PYRs (upper) and INs (lower) was comparable. C, quantitative comparison of the amplitude, duration and AUC of light‐evoked and spontaneously occurring LLDs. Bars indicate the timing and duration of light pulses. Each symbol represents an individual cell. Error bars are the mean ± SEM. [Color figure can be viewed at wileyonlinelibrary.com]
Figure 6
Figure 6. Inactivation of PV INs prevents LLD initiation
A, example traces of membrane hyperpolarization induced by light activation of Arch (left) and superimposed traces showing PV cell response to a depolarizing stimuli with and without concurrent tissue illumination (right). Arch activation hyperpolarized the PV IN and blocked AP generation. B, representative traces of electrically evoked activity recorded from a PYR (top) and IN (bottom) with and without concurrent slice illumination in control aCSF (left) and after 4AP + EAA blockers wash‐on (right). C, light inactivation of PV INs significantly reduced the amplitude, duration and AUC of evoked activity. * P < 0.05, Tukey's post hoc test. Bars indicate the timing and duration of light pulses. Arrows indicate time of electrical stimulation. Each shape represents an individual cell. Error bars are the mean ± SEM. [Color figure can be viewed at wileyonlinelibrary.com]
Figure 7
Figure 7. VIP IN activation is not sufficient for the initiation of LLDs
A, example traces of VIP IN firing properties elicited by current injection (top) or light activation (bottom). B, representative traces comparing electrically evoked activity with activity evoked, at arrow, by a 10 ms light pulse after 4AP + EAA blockers wash‐on in a PYR. Black arrow indicates the time of stimulation. C, the amplitude, duration and AUC of activity evoked by VIP IN activation were significantly smaller than spontaneous LLDs. Blue bars indicate the timing and duration of light pulses. * P < 0.05, Tukey's post hoc test. Each shape represents an individual cell. Error bars are the mean ± SEM. [Color figure can be viewed at wileyonlinelibrary.com]
Figure 8
Figure 8. Suppression of VIP IN activity minimally alters evoked LLD magnitude
A, example traces of membrane hyperpolarization induced by light activation of Arch (top) and superimposed traces showing VIP cell response to a depolarizing current pulse with and without Arch activation (bottom). Light activation hyperpolarized the VIP IN and blocked AP generation. B, superimposed traces from a PYR cell comparing electrically evoked activity recorded with and without concurrent light illumination in the presence of 4AP + EAA blockers. Arrow indicates the time of stimulation. C, light inactivation of VIP INs significantly reduced only the AUC of evoked LLDs in PYRs. * P < 0.05, Tukey's post hoc test test. Blue bars indicate the timing and duration of light pulses. Each shape represents an individual cell. Error bars are the mean ± SEM. [Color figure can be viewed at wileyonlinelibrary.com]
Figure 9
Figure 9. Light offset in Arch expressing INs is associated with triggering of LLDs
A, representative traces from SST‐Arch (top) and PV‐Arch (bottom) animals showing the generation of LLDs upon light offset. Upper traces show responses from a PV IN in a slice from a SST‐Arch animals, whereas lower traces show responses from a SST IN in a slice from a PV‐Arch animal. B, comparison of rebound LLDs induced by release of INs from light‐driven hyperpolarization. The amplitude and AUC of rebound LLDs evoked by PV IN synchronization were larger than those of SST IN induced activity. C, LLDs were evoked upon light offset in trials with and without electrical stimulation. * P < 0.05, two‐tailed t test. Each shape represents an individual cell. Error bars are the mean ± SEM. [Color figure can be viewed at wileyonlinelibrary.com]
Figure 10
Figure 10. Distinct contribution of IN subtypes to LLD initiation
A, activation of VIP INs elicited activity of significantly smaller amplitude, duration and AUC compared to both SST and PV INs. B, suppression of VIP INs produced attenuation of the amplitude, duration and AUC of evoked activity comparable to SST INs but significantly smaller than PV INs. C, quantification of rebound activity evoked by Arch offset revealed that VIP IN synchronization produced activity of significantly smaller amplitude, duration and AUC than both SST and PV INs. * P < 0.05, Tukey's post hoc test. Each shape represents an individual cell. Error bars are the mean ± SEM.
Figure 11
Figure 11. Schematic representation of synaptic connectivity of cortical layer II/III interneurons
Simplified diagram illustrating the synaptic connectivity patterns of PV, SST and VIP INs in layer II/III of the neocortex. Black lines indicate neuronal efferents with open circles representing synaptic terminals. The weight of black lines represents the relative prevalence of the indicated connection, with larger lines representing more prevalent connections. Dashed lines indicate output to INs of the same class. Note that PV efferents are somatic targeting, whereas SST and VIP INs typically synapse onto the dendrites of their postsynaptic targets. [Color figure can be viewed at wileyonlinelibrary.com]

References

    1. Aram JA, Michelson HB & Wong RKS (1991). Synchronized GABAergic IPSCs recorded in the neocortex after blockade of synaptic transmission mediated by excitatory amino acids. J Neurophysiol 65, 1034–1041. - PubMed
    1. Ascoli GA, Alonso‐Nanclares L, Anderson SA, Barrionuevo G, Benavides‐Piccione R, Burkhalter A, Buzsaki G, Cauli B, Defelipe J, Fairen A, Feldmeyer D, Fishell G, Fregnac Y, Freund TF, Gardner D, Gardner EP, Goldberg JH, Helmstaedter M, Hestrin S, Karube F, Kisvarday ZF, Lambolez B, Lewis DA, Marin O, Markram H, Munoz A, Packer A, Peterson CC, Rockland KS, Rossier J, Rudy B, Somogyi P, Staiger JF, Tamas G, Thomson AM, Toledo‐Rodriguez M, Wang Y, West DC & Yuste R (2008). Petilla terminology: nomenclature of features of GABAergic interneurons of the cerebral cortex. Nature Rev Neurosci 9, 557–568. - PMC - PubMed
    1. Avoli M & Perreault P (1987). A GABAergic depolarizing potential in the hippocampus disclosed by the convulsant 4‐aminopyridine. Brain Res 400, 191–195. - PubMed
    1. Avoli M, Perreault P, Olivier A & Villemure J‐G (1988). 4‐Aminopyridine induces a long‐lasting depolarizing GABA‐ergic potential in human neocortical and hippocampal neurons maintained in vitro. Neurosci Letters 94, 327–332. - PubMed
    1. Avoli M, Mattia D, Siniscalchi P, Perreault P & Tomaiuolo F (1994). Pharmacology and electrophysiology of a synchronous GABA‐mediated potential in the human neocortex. Neuroscience 62, 655–666. - PubMed

Publication types

LinkOut - more resources