

Increasing T-type calcium channel activity by β-adrenergic stimulation contributes to β-adrenergic regulation of heart rates
- PMID: 29274077
- PMCID: PMC5878229
- DOI: 10.1113/JP274756
Increasing T-type calcium channel activity by β-adrenergic stimulation contributes to β-adrenergic regulation of heart rates
Abstract
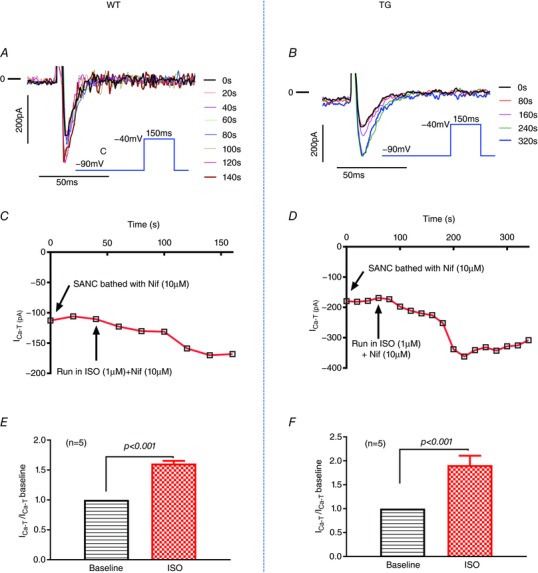
Cav3.1 T-type Ca2+ channel current (ICa-T ) contributes to heart rate genesis but is not known to contribute to heart rate regulation by the sympathetic/β-adrenergic system (SAS). We show that the loss of Cav3.1 makes the beating rates of the heart in vivo and perfused hearts ex vivo, as well as sinoatrial node cells, less sensitive to β-adrenergic stimulation; it also renders less conduction acceleration through the atrioventricular node by β-adrenergic stimulation. Increasing Cav3.1 in cardiomyocytes has the opposite effects. ICa-T in sinoatrial nodal cells can be upregulated by β-adrenergic stimulation. The results of the present study add a new contribution to heart rate regulation by the SAS system and provide potential new mechanisms for the dysregulation of heart rate and conduction by the SAS in the heart. T-type Ca2+ channel can be a target for heart disease treatments that aim to slow down the heart rate ABSTRACT: Cav3.1 (α1G ) T-type Ca2+ channel (TTCC) is expressed in mouse sinoatrial node cells (SANCs) and atrioventricular (AV) nodal cells and contributes to heart rate (HR) genesis and AV conduction. However, its role in HR regulation and AV conduction acceleration by the β-adrenergic system (SAS) is unclear. In the present study, L- (ICa-L ) and T-type (ICa-T ) Ca2+ currents were recorded in SANCs from Cav3.1 transgenic (TG) and knockout (KO), and control mice. ICa-T was absent in KO SANCs but enhanced in TG SANCs. In anaesthetized animals, different doses of isoproterenol (ISO) were infused via the jugular vein and the HR was recorded. The EC50 of the HR response to ISO was lower in TG mice but higher in KO mice, and the maximal percentage of HR increase by ISO was greater in TG mice but less in KO mice. In Langendorff-perfused hearts, ISO increased HR and shortened PR intervals to a greater extent in TG but to a less extent in KO hearts. KO SANCs had significantly slower spontaneous beating rates than control SANCs before and after ISO; TG SANCs had similar basal beating rates as control SANCs probably as a result of decreased ICa-L but a greater response to ISO than control SANCs. ICa-T in SANCs was significantly increased by ISO. ICa-T upregulation by β-adrenergic stimulation contributes to HR and conduction regulation by the SAS. TTCC can be a target for slowing the HR.
Keywords: Cav3.1/α1G T-type calcium channel; atrioventricular node; heart rate; sinoatrial node cells; β-adrenergic.
© 2017 The Authors. The Journal of Physiology © 2017 The Physiological Society.
Figures


Similar articles
-
β-Adrenergic stimulation increases Cav3.1 activity in cardiac myocytes through protein kinase A.PLoS One. 2012;7(7):e39965. doi: 10.1371/journal.pone.0039965. Epub 2012 Jul 13. PLoS One. 2012. PMID: 22808078 Free PMC article.
-
PDE4D mediates impaired β-adrenergic receptor signalling in the sinoatrial node in mice with hypertensive heart disease.Cardiovasc Res. 2023 Dec 30;119(17):2697-2711. doi: 10.1093/cvr/cvad138. Cardiovasc Res. 2023. PMID: 37643895 Free PMC article.
-
Increased sodium/calcium exchanger activity enhances beta-adrenergic-mediated increase in heart rate: Whole-heart study in a homozygous sodium/calcium exchanger overexpressor mouse model.Heart Rhythm. 2017 Aug;14(8):1247-1253. doi: 10.1016/j.hrthm.2017.05.001. Epub 2017 May 8. Heart Rhythm. 2017. PMID: 28495655
-
Channelopathies of voltage-gated L-type Cav1.3/α1D and T-type Cav3.1/α1G Ca2+ channels in dysfunction of heart automaticity.Pflugers Arch. 2020 Jul;472(7):817-830. doi: 10.1007/s00424-020-02421-1. Epub 2020 Jun 29. Pflugers Arch. 2020. PMID: 32601767 Review.
-
T-type channels in the sino-atrial and atrioventricular pacemaker mechanism.Pflugers Arch. 2014 Apr;466(4):791-9. doi: 10.1007/s00424-014-1482-6. Epub 2014 Feb 27. Pflugers Arch. 2014. PMID: 24573175 Review.
Cited by
-
Mitochondrial dysfunction is a key link involved in the pathogenesis of sick sinus syndrome: a review.Front Cardiovasc Med. 2024 Oct 29;11:1488207. doi: 10.3389/fcvm.2024.1488207. eCollection 2024. Front Cardiovasc Med. 2024. PMID: 39534498 Free PMC article. Review.
-
Adenylyl cyclase isoform 1 contributes to sinoatrial node automaticity via functional microdomains.JCI Insight. 2022 Nov 22;7(22):e162602. doi: 10.1172/jci.insight.162602. JCI Insight. 2022. PMID: 36509290 Free PMC article.
-
Ranolazine rescues the heart failure phenotype of PLN-deficient human pluripotent stem cell-derived cardiomyocytes.Stem Cell Reports. 2022 Apr 12;17(4):804-819. doi: 10.1016/j.stemcr.2022.02.016. Epub 2022 Mar 24. Stem Cell Reports. 2022. PMID: 35334215 Free PMC article.
-
Casein Kinase 2 Regulates the Intrinsic Activity of L-Type Calcium Currents in Cardiomyocytes.Int J Mol Sci. 2025 Jun 23;26(13):6010. doi: 10.3390/ijms26136010. Int J Mol Sci. 2025. PMID: 40649788 Free PMC article.
-
The Action Potential Clamp Technique as a Tool for Risk Stratification of Sinus Bradycardia Due to Loss-of-Function Mutations in HCN4: An In Silico Exploration Based on In Vitro and In Vivo Data.Biomedicines. 2023 Sep 2;11(9):2447. doi: 10.3390/biomedicines11092447. Biomedicines. 2023. PMID: 37760888 Free PMC article.
References
-
- Barbuti A & DiFrancesco D (2008). Control of cardiac rate by ‘funny’ channels in health and disease. Ann NY Acad Sci 1123, 213–223. - PubMed
-
- Borer JS, Deedwania PC, Kim JB & Bohm M (2016). Benefits of heart rate slowing with ivabradine in patients with systolic heart failure and coronary artery disease. Am J Cardiol 118, 1948–1953. - PubMed
-
- Chandler NJ, Greener ID, Tellez JO, Inada S, Musa H, Molenaar P, Difrancesco D, Baruscotti M, Longhi R, Anderson RH, Billeter R, Sharma V, Sigg DC, Boyett MR & Dobrzynski H (2009). Molecular architecture of the human sinus node: insights into the function of the cardiac pacemaker. Circulation 119, 1562–1575. - PubMed
-
- Chen CC, Lamping KG, Nuno DW, Barresi R, Prouty SJ, Lavoie JL, Cribbs LL, England SK, Sigmund CD, Weiss RM, Williamson RA, Hill JA & Campbell KP (2003). Abnormal coronary function in mice deficient in alpha1H T‐type Ca2+ channels. Science 302, 1416–1418. - PubMed
Publication types
MeSH terms
Substances
Grants and funding
LinkOut - more resources
Full Text Sources
Other Literature Sources
Medical
Research Materials
Miscellaneous