

Unconjugated bilirubin modulates neuronal signaling only in wild-type mice, but not after ablation of the R-type/Cav 2.3 voltage-gated calcium channel
- PMID: 29274300
- PMCID: PMC6489700
- DOI: 10.1111/cns.12791
Unconjugated bilirubin modulates neuronal signaling only in wild-type mice, but not after ablation of the R-type/Cav 2.3 voltage-gated calcium channel
Abstract
Introduction: The relationship between blood metabolites and hemoglobin degradation products (BMHDPs) formed in the cerebrospinal fluid and the development of vasospasm and delayed cerebral ischemia (DCI) after aneurysmal subarachnoid hemorrhage (aSAH) has been the focus of several previous studies, but their molecular and cellular targets remain to be elucidated.
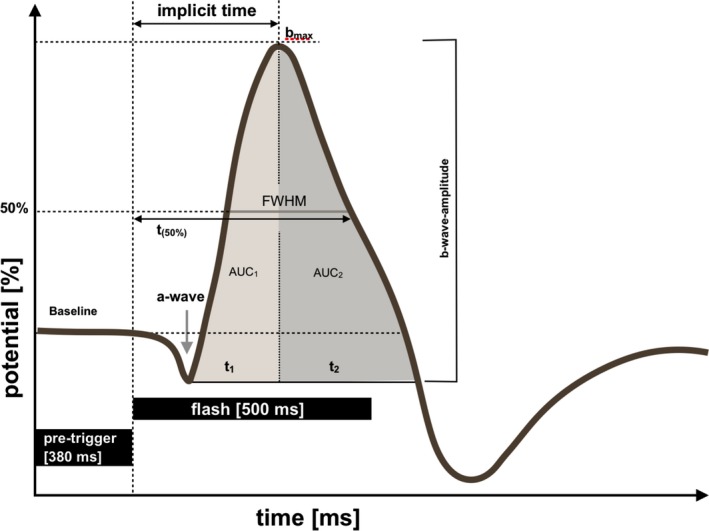
Methods: Because BMHDP-induced changes in Cav 2.3 channel function are thought to contribute to DCI after aSAH, we studied their modulation by unconjugated bilirubin (UCB) in an organotypical neuronal network from wild-type (WT) and Cav 2.3-deficient animals (KO). Murine retinae were isolated from WT and KO and superfused with nutrient solution. Electroretinograms were recorded before, during, and after superfusion with UCB. Transretinal signaling was analyzed as b-wave, implicit time, and area under the curve (AUC).
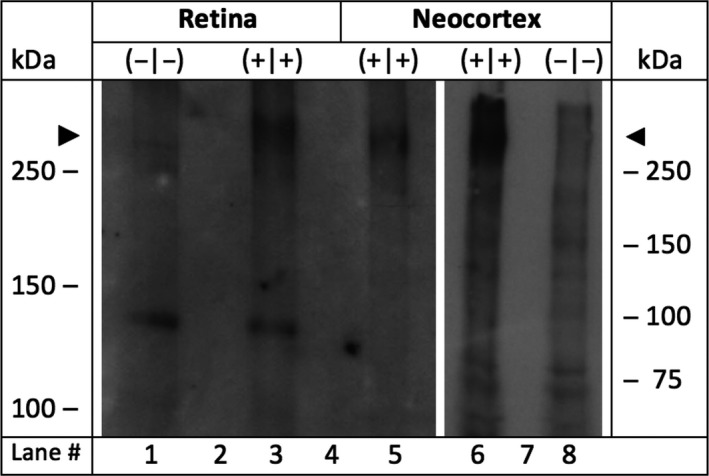
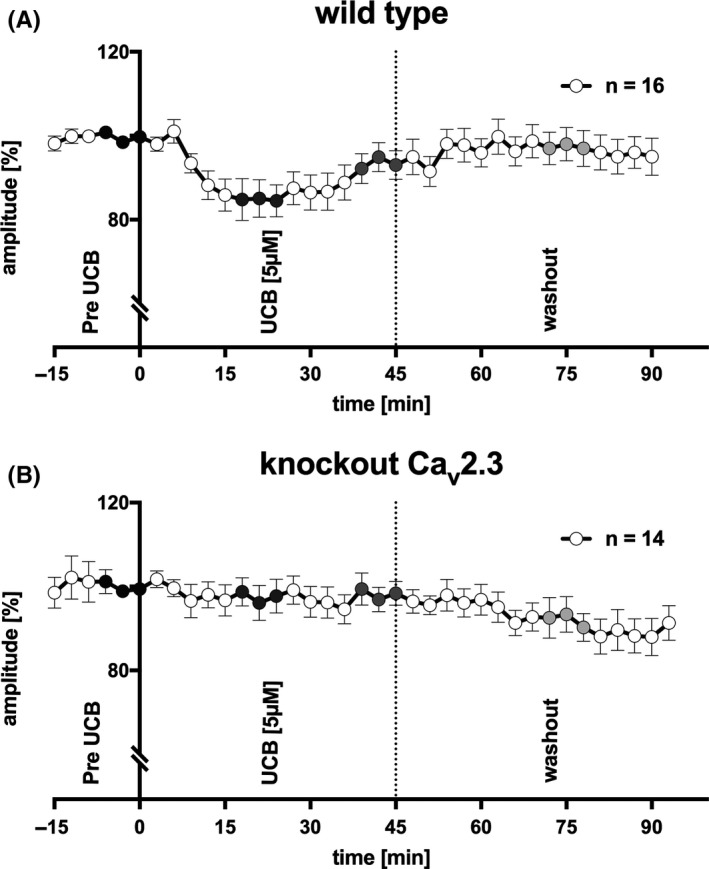
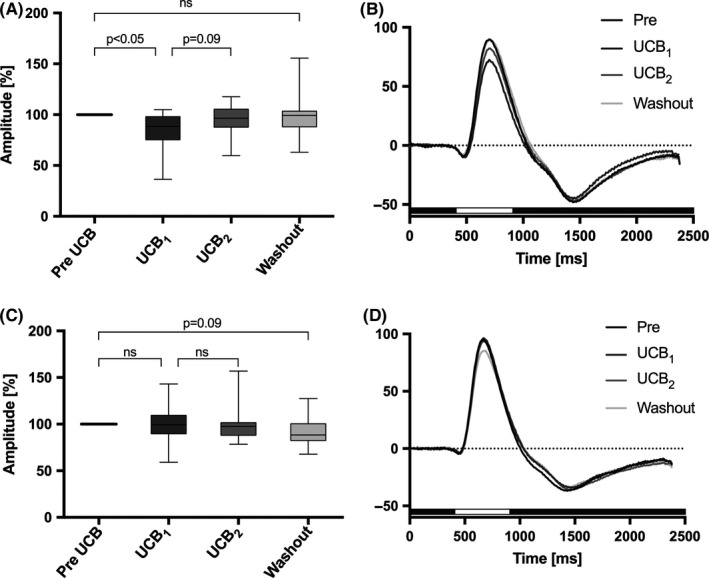
Results: Superfusion of UCB significantly attenuated the b-wave amplitude in the isolated retina from wild-type mice by 14.9% (P < 0.05), followed by gradual partial recovery (P = 0.09). Correspondingly, AUC decreased significantly with superfusion of UCB (P < 0.05). During washout, the b-wave amplitude returned to baseline (P = 0.2839). The effects of UCB were absent in Cav 2.3-deficient mice, lacking the expression of Cav 2.3 as proofed on the biochemical level.
Conclusions: Ex vivo neuronal recording in the murine retina is able to detect transient impairment of transretinal signaling by UCB in WT, but not in KO. This new model may be useful to further clarify the role of calcium channels in neuronal signal alteration in the presence of BHMDPs.
Keywords: bilirubin; blood degradation products; ex vivo; isolated vertebrate retina; murine ERG.
© 2017 John Wiley & Sons Ltd.
Conflict of interest statement
The authors declare no conflict of interest.
Figures
Similar articles
-
Modulation of Cav2.3 channels by unconjugated bilirubin (UCB) - Candidate mechanism for UCB-induced neuromodulation and neurotoxicity.Mol Cell Neurosci. 2019 Apr;96:35-46. doi: 10.1016/j.mcn.2019.03.003. Epub 2019 Mar 12. Mol Cell Neurosci. 2019. PMID: 30877033
-
Effect of ZnCl2 and chelation of zinc ions by N,N-diethyldithiocarbamate (DEDTC) on the ERG b-wave amplitude from the isolated superfused vertebrate retina.Curr Eye Res. 2010 Apr;35(4):322-34. doi: 10.3109/02713680903509410. Curr Eye Res. 2010. PMID: 20373900
-
Submicromolar copper (II) ions stimulate transretinal signaling in the isolated retina from wild type but not from Cav2.3-deficient mice.BMC Ophthalmol. 2020 May 6;20(1):182. doi: 10.1186/s12886-020-01451-8. BMC Ophthalmol. 2020. PMID: 32375703 Free PMC article.
-
Two separate Ni(2+) -sensitive voltage-gated Ca(2+) channels modulate transretinal signalling in the isolated murine retina.Acta Ophthalmol. 2011 Nov;89(7):e579-90. doi: 10.1111/j.1755-3768.2011.02167.x. Epub 2011 Aug 23. Acta Ophthalmol. 2011. PMID: 21883984 Free PMC article.
-
Contribution of inflammatory processes to nerve cell toxicity by bilirubin and efficacy of potential therapeutic agents.Curr Pharm Des. 2009;15(25):2915-26. doi: 10.2174/138161209789058165. Curr Pharm Des. 2009. PMID: 19754368 Review.
Cited by
-
Non-Animal Models in Experimental Subarachnoid Hemorrhage Research: Potentials and the Dilemma of the Translation from Bench to Bedside.Transl Stroke Res. 2022 Apr;13(2):218-221. doi: 10.1007/s12975-021-00950-0. Epub 2021 Oct 29. Transl Stroke Res. 2022. PMID: 34714498 Free PMC article. No abstract available.
-
New risk score of the early period after spontaneous subarachnoid hemorrhage: For the prediction of delayed cerebral ischemia.CNS Neurosci Ther. 2019 Oct;25(10):1173-1181. doi: 10.1111/cns.13202. Epub 2019 Aug 12. CNS Neurosci Ther. 2019. PMID: 31407513 Free PMC article.
-
Effects of bilirubin on the development and electrical activity of neural circuits.Front Cell Neurosci. 2023 Mar 21;17:1136250. doi: 10.3389/fncel.2023.1136250. eCollection 2023. Front Cell Neurosci. 2023. PMID: 37025700 Free PMC article. Review.
-
In vitro and in vivo phosphorylation of the Cav2.3 voltage-gated R-type calcium channel.Channels (Austin). 2018;12(1):326-334. doi: 10.1080/19336950.2018.1516984. Channels (Austin). 2018. PMID: 30165790 Free PMC article. Review.
References
-
- Lazniewska J, Weiss N. Glycosylation of voltage‐gated calcium channels in health and disease. Biochim Biophys Acta. 2017;1859:662‐668. - PubMed
-
- Ishiguro M, Wellman TL, Honda A, Russell SR, Tranmer BI, Wellman GC. Emergence of a R‐type Ca2+ channel (CaV 2.3) contributes to cerebral artery constriction after subarachnoid hemorrhage. Circ Res. 2005;96:419‐426. - PubMed
-
- Wang Z, Wang KY, Wu Y, Zhou P, Sun XO, Chen G. Potential role of CD34 in cerebral vasospasm after experimental subarachnoid hemorrhage in rats. Cytokine. 2010;52:245‐251. - PubMed
Publication types
MeSH terms
Substances
LinkOut - more resources
Full Text Sources
Other Literature Sources
Research Materials
