

Using lipidomics to reveal details of lipid accumulation in developing seeds from oilseed rape (Brassica napus L.)
- PMID: 29275220
- PMCID: PMC5791847
- DOI: 10.1016/j.bbalip.2017.12.010
Using lipidomics to reveal details of lipid accumulation in developing seeds from oilseed rape (Brassica napus L.)
Abstract
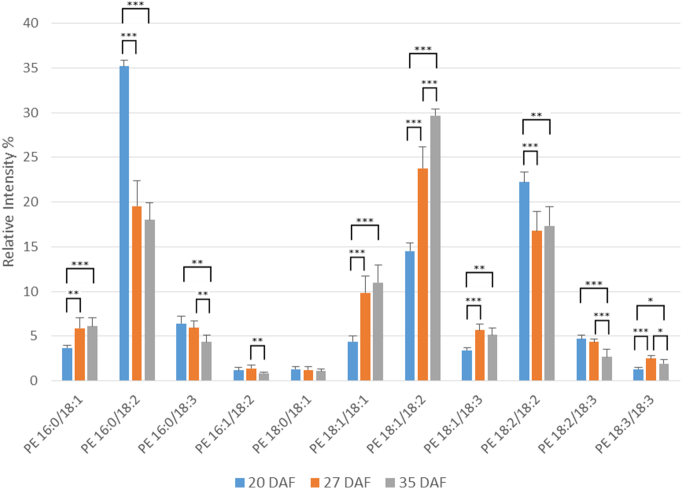
With dwindling available agricultural land, concurrent with increased demand for oil, there is much current interest in raising oil crop productivity. We have been addressing this issue by studying the regulation of oil accumulation in oilseed rape (Brassica napus L). As part of this research we have carried out a detailed lipidomic analysis of developing seeds. The molecular species distribution in individual lipid classes revealed quite distinct patterns and showed where metabolic connections were important. As the seeds developed, the molecular species distributions changed, especially in the period of early (20days after flowering, DAF) to mid phase (27DAF) of oil accumulation. The patterns of molecular species of diacylglycerol, phosphatidylcholine and acyl-CoAs were used to predict the possible relative contributions of diacylglycerol acyltransferase (DGAT) and phospholipid:diacylglycerol acyltransferase to triacylglycerol production. Our calculations suggest that DGAT may hold a more important role in influencing the molecular composition of TAG. Enzyme selectivity had an important influence on the final molecular species patterns. Our data contribute significantly to our understanding of lipid accumulation in the world's third most important oil crop.
Keywords: Brassica napus (L); Developing oilseed rape; Lipid accumulation; Lipidomics; Regulation of synthesis.
Copyright © 2018 The Authors. Published by Elsevier B.V. All rights reserved.
Figures


Similar articles
-
Working with Randy: The Diacylglycerol Acyltransferase Story.Lipids. 2020 Sep;55(5):419-423. doi: 10.1002/lipd.12267. Epub 2020 Jul 23. Lipids. 2020. PMID: 32701170
-
Type 1 diacylglycerol acyltransferases of Brassica napus preferentially incorporate oleic acid into triacylglycerol.J Exp Bot. 2015 Oct;66(20):6497-506. doi: 10.1093/jxb/erv363. Epub 2015 Jul 20. J Exp Bot. 2015. PMID: 26195728 Free PMC article.
-
Overexpression of phospholipid: diacylglycerol acyltransferase in Brassica napus results in changes in lipid metabolism and oil accumulation.Biochem J. 2022 Mar 31;479(6):805-823. doi: 10.1042/BCJ20220003. Biochem J. 2022. PMID: 35298586 Free PMC article.
-
Rapeseed species and environmental concerns related to loss of seeds of genetically modified oilseed rape in Japan.GM Crops. 2010 May-Jun;1(3):143-56. doi: 10.4161/gmcr.1.3.12761. GM Crops. 2010. PMID: 21844669 Review.
-
Genetic and molecular approaches to improve nutritional value of Brassica napus L. seed.C R Biol. 2008 Oct;331(10):763-71. doi: 10.1016/j.crvi.2008.07.018. Epub 2008 Sep 4. C R Biol. 2008. PMID: 18926490 Review.
Cited by
-
Increase in lysophosphatidate acyltransferase activity in oilseed rape (Brassica napus) increases seed triacylglycerol content despite its low intrinsic flux control coefficient.New Phytol. 2019 Oct;224(2):700-711. doi: 10.1111/nph.16100. Epub 2019 Sep 14. New Phytol. 2019. PMID: 31400160 Free PMC article.
-
Targeted engineering of camelina and pennycress seeds for ultrahigh accumulation of acetyl-TAG.Proc Natl Acad Sci U S A. 2024 Nov 19;121(47):e2412542121. doi: 10.1073/pnas.2412542121. Epub 2024 Nov 11. Proc Natl Acad Sci U S A. 2024. PMID: 39527733 Free PMC article.
-
Biochemical and Molecular Aspects of Phosphorus Limitation in Diatoms and Their Relationship with Biomolecule Accumulation.Biology (Basel). 2021 Jun 22;10(7):565. doi: 10.3390/biology10070565. Biology (Basel). 2021. PMID: 34206287 Free PMC article. Review.
-
Comparative Transcriptomics Analysis of Brassica napus L. during Seed Maturation Reveals Dynamic Changes in Gene Expression between Embryos and Seed Coats and Distinct Expression Profiles of Acyl-CoA-Binding Proteins for Lipid Accumulation.Plant Cell Physiol. 2019 Dec 1;60(12):2812-2825. doi: 10.1093/pcp/pcz169. Plant Cell Physiol. 2019. PMID: 31504915 Free PMC article.
-
Synergistic mechanisms of DGAT and PDAT in shaping triacylglycerol diversity: evolutionary insights and metabolic engineering strategies.Front Plant Sci. 2025 Jul 1;16:1598815. doi: 10.3389/fpls.2025.1598815. eCollection 2025. Front Plant Sci. 2025. PMID: 40666298 Free PMC article. Review.
References
-
- Chen G., Woodfield H.K., Pan X., Harwood J.L., Weselake R.J. Acyl-trafficking during plant oil accumulation. Lipids. 2015;50:1057–1068. - PubMed
-
- Gunstone F., Harwood J., Dijkstra A., editors. The Lipid Handbook. Third Edition; CRC Press: 2007.
-
- McKeon T.A., Hayes D.G., Hildebrand D.F., Weselake R.J. Industrial Oil Crops. AOCS Press; 2016. Introduction to industrial oil crops; pp. 1–13.
-
- Bates P.D., Stymne S., Ohlrogge J. Biochemical pathways in seed oil synthesis. Curr. Opin. Plant Biol. 2013;16:358–364. - PubMed
-
- Weselake R.J., Taylor D.C., Rahman M.H., Shah S., Laroche A., McVetty P.B.E., Harwood J.L. Increasing the flow of carbon into seed oil. Biotechnol. Adv. 2009;27:866–878. - PubMed
Publication types
MeSH terms
Substances
LinkOut - more resources
Full Text Sources
Other Literature Sources
Molecular Biology Databases
Research Materials
Miscellaneous
